

Siemens Energy AG
No trades
No trades
In-depth trading ideas
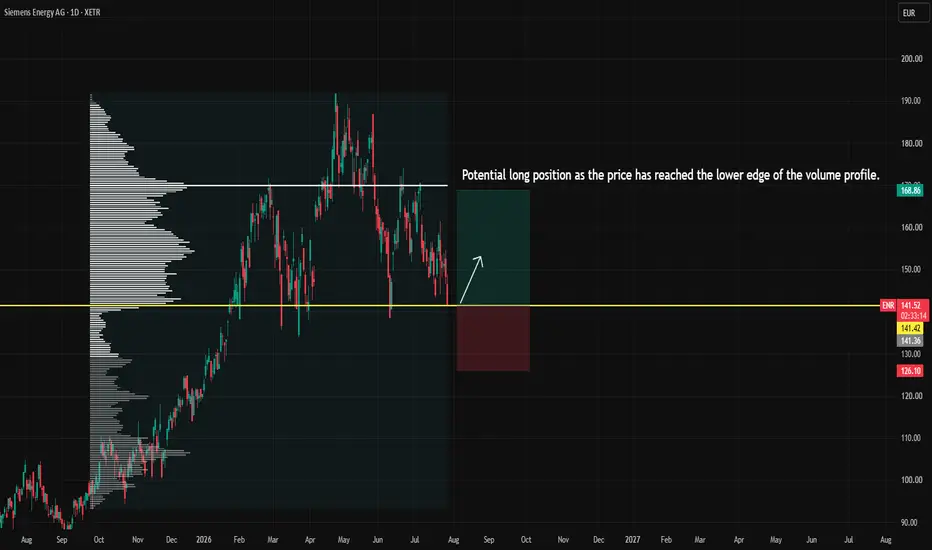
Siemens Energy – Technically Negative in the Medium TermSiemens Energy has broken down from an uptrend and has also marginally broken down from a head-and-shoulders formation (H&S). However, the price has recovered following the H&S formation, at least for now.
The price is below a red Ichimoku cloud, and RSI 21 is declining.
The 50-day MA is crossing below the 100-day MA, and both are declining around 20 July.
The stock appears to be technically negative in the medium term, with a time horizon of 1 to 6 months.
Fundamental analysts are predominantly positive on the stock.
Operating cash flow has been increasing steadily over the past three years.
However, the P/E ratio is slightly above 50.
I have decided to sell the stock at a small loss.

Current Dip is a Buying Opportunity - SMEGFTime Horizon: Long-term (Years)
The "Big Picture" (Summary)
Siemens Energy is positioned at the epicenter of a massive, structural super-cycle driven by grid modernization and artificial intelligence power demands. Despite a recent market pullback that has pressured the stock, the underlying business is booming with explosive order growth and a bulletproof balance sheet. This is a rare chance to accumulate shares of a near-monopoly player while the broader market focuses on short-term noise.
The Analysis (Simple Terms)
The Trend: While the stock has experienced a recent pullback to around $163, it remains in a powerful long-term uptrend, having doubled from its 52-week lows. The current price action is simply a healthy digestion of broader macroeconomic fears, not a fundamental breakdown of the underlying business.
Key Price Areas: At $163, the stock is trading at a significant discount to its intrinsic growth trajectory. If the market continues to panic over supply chain issues or tariffs, the stock could test a worst-case support level around $150. However, our base case fair value—where the stock becomes "expensive"—sits substantially higher at $263.
The Catalyst: The primary engine here is the highly inelastic demand for electricity, largely fueled by the U.S. market and massive AI data center build-outs. The business is booking new orders at a staggering rate of 1.72x its current billing capacity, resulting in a massive €154 billion backlog that essentially locks out competitors for years. Furthermore, their previously struggling wind power division (Siemens Gamesa) is rapidly shrinking its losses and executing a successful turnaround.
Investment Plan
Buy Zone: $155.00 - $165.00With the recent drop in price, it makes sense to start accumulating right around current levels. We are taking advantage of the market's overreaction to macroeconomic noise to build a position at a fantastic average cost.
Risk Level (Invalidation Level): $140.00
If the stock breaks heavily below this point, it suggests the technical trend is broken and something fundamentally worse has happened—such as severe raw material inflation compressing margins or a total failure of the wind division turnaround.
Target: $263.00
The structural thesis hasn't changed. By buying at $163, the risk-to-reward ratio is incredibly strong, pushing the potential upside to over 60%. This target assumes the company simply continues to execute flawlessly on the €154 billion backlog it has already secured.
Disclaimer: The information provided in this idea is for educational and informational purposes only and does not constitute financial advice. Always conduct your own due diligence and consult with a certified financial advisor before making any investment decisions.

Siemens EnergyThis was my highest from last year.
600%.
I believe it will go up to 200EUR.
Right now I don't see clear indication, but this is my felling.
Long
Siemens Energy in den letzten Zügen Bei noch maligen Bruch der Trendlinie steht der Weg nach unten offen.
 Long
Long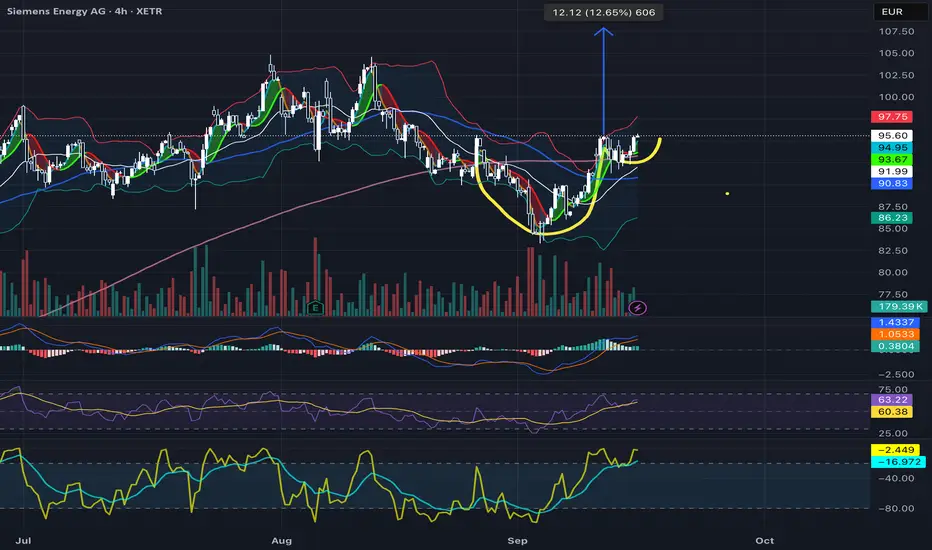
Renewables: The U.S. Opens the Door and Europe CelebratesBy Ion Jauregui – Analyst at ActivTrades
The energy transition has received an unexpected boost from the United States. Against restrictive forecasts, the Trump administration finally published the rules that define access for clean energy projects to tax credits. The outcome was surprising: far more lenient regulation than anticipated. What many expected to be a regulatory maze turned out to look more like a beginner’s sudoku.
The impact was quickly felt in Europe. Vestas Wind Systems A/S (CPH:VWS), a leader in wind turbines, experienced its best trading day since July 2022, soaring 18%. Optimism spread to other sector giants such as Siemens Energy AG (ETR:ENR) and GE Vernova, the renewables division of General Electric (NYSE:GE), which now see a clearer path ahead for rising orders.
U.S. Flexes, Europe Accelerates
In Europe, the development of clean energy has been driven by ambitious climate targets and a favorable regulatory environment, albeit with bureaucratic hurdles in permitting and grid connections. The U.S. decision—ironically under a government traditionally skeptical of green policies—puts the country in a competitive position: attractive tax credits, greater legal certainty for investors, and a framework that could draw European capital stateside.
Europe, however, still holds the advantage in industrial expertise and value chains. Manufacturers such as Vestas and Siemens Gamesa have spent years consolidating their global leadership. The new U.S. framework does not erase that advantage but does level the playing field, with transatlantic companies set to be the main beneficiaries.
Market Outlook
From a technical standpoint, Vestas is in a buying frenzy after breaking key resistance at 170 Danish crowns, with short-term potential to test 185. Siemens Energy, still grappling with financial issues, could use the momentum to stabilize above €20, while GE Vernova gains visibility within General Electric, whose immediate support stands at $147.
Siemens Energy Analysis
Advantage Regained with U.S. Support
Siemens Energy reported record orders of €16.6 billion in the second quarter alone, with a backlog reaching €136 billion, driven by strong U.S. demand, especially for data center power plants. Revenue rose 13.5% to €9.7 billion, while net profit hit €697 million, compared to a loss the year prior. Despite a €100 million tariff headwind, the company expects to reach the upper range of its guidance (13–15% sales growth, margin before special items at 4–6%), showcasing solid recovery and increasing investor confidence.
Medium-Term Bullish Trend
From a technical perspective, the trend since April has been bullish, supported by a golden cross that pushed prices to late-July highs, retested in early August. The price currently sits on the 100-day moving average, having lost the 50-day support. RSI is at 47.05%, and MACD shows a corrective move with the histogram trending downward into negative territory. Average volume holds at 1.95M. The strongest bearish pressure aligns with the Point of Control (POC) at €50.50, while bullish pressure zones coincide with the consolidation range between €104.85 and €82.34. The key level to watch is above €100: a breakout would confirm stronger upside momentum. Failure to hold current levels could see supports tested at €76.54 and €62.96.
Tailwind Effect
The renewed tailwind from the U.S. marks a significant shift: the energy transition is no longer a solely European effort but a global race where regulatory flexibility can accelerate investment. If Europe sustains its technological leadership while the U.S. offers a more attractive fiscal framework, the renewable sector may enter a new phase of synchronized growth on both sides of the Atlantic.
*******************************************************************************************
La información facilitada no constituye un análisis de inversiones. El material no se ha elaborado de conformidad con los requisitos legales destinados a promover la independencia de los informes de inversiones y, como tal, debe considerarse una comunicación comercial.
Toda la información ha sido preparada por ActivTrades ("AT"). La información no contiene un registro de los precios de AT, o una oferta o solicitud de una transacción en cualquier instrumento financiero. Ninguna representación o garantía se da en cuanto a la exactitud o integridad de esta información.
Cualquier material proporcionado no tiene en cuenta el objetivo específico de inversión y la situación financiera de cualquier persona que pueda recibirlo. La rentabilidad pasada y las estimaciones no sinónimo ni un indicador fiable de la rentabilidad futura. AT presta un servicio exclusivamente de ejecución. En consecuencia, toda persona que actúe sobre la base de la información facilitada lo hace por su cuenta y riesgo. Los tipos de interés pueden cambiar. El riesgo político es impredecible. Las acciones de los bancos centrales pueden variar. Las herramientas de las plataformas no garantizan el éxito.
Long
Siemens Energy bullishSiemens Energy seems to be in wave 3 of 5 and should continue the bullish trend till summer 2025
RSI and price action support lines added
Long
ENR Elliott-Wave AnalysisSiemens Energy Skyrocketed over the course of 2024.
I think the Chart finished the first full Elliott-Wave-Impulse (1-2-3-4-5).
Now, im expecting the price to start retracing, and stay in the downtrend for at least a couple of months.
Short Long
Long
Siemens Energy: Flag patternHigh Tight Flag for Siemens Energy: This serves as a strong entry signal for a long position. The target is positioned at the yellow resistance area.
TP (Take Profit): 15.500
SL (Stop Loss): 12.730 (flag high)
Long
ENR halfway to partial recovery, mid-term, still time to runTo Mid and long term investors: (day traders, swingers, flippers and gamblers...this is not for your weak hearts)
The stock never really had meaningful reasons to devalue. Just rumors behind a solid company with plenty of assets and cashflow. Hard times with energy wars waging and still new plans for expansion are being drawn in Starnberger lake houses. Hopefully the full acquisition of GAMESA will clear the path to renewables, which are the future considering all the pledges to go carbon neutral by 2050. ENR has all in place to succeed in that war. and moreover it is also under Graham's value.
Long
If looking for an opportunity, this could be. Just look.I believe this will close up the gap and continue the upward trend. Siemens Energy will fix the problems and the price gap will be closed in the following weeks.
Long
SIEMENS ENERGY AG NA O.NHello ladies and gentlemen,
XETR:ENR gave us an important signal, wait for the buy signal ichaellah the next months.
Long
ENR Siemens Energy OversoldENR Siemens Energy (Xetra) is currently highly oversold, RSI is above 80, Bollinger Bands are constantly at the upper band - also we do hit now the SMA 200 and entered a support/resistance zone. In my opinion you may think about to create an Alert on this one. Dont forget that Germany is struggling with Energy and that this will continue as well for some time ...
Short
ENR // Inverted shoulder head shoulder formation.Targets are determined according to Fibonacci. Pay attention to the wedge resistance in the weekly time frame.

Siemens Energy - Just some random lines XETR:ENR
Just wanted to see if I can figure out a price trend. Too early to buy? or the current energy crisis could lead to a reversal?
 Long
Long
#siemensenergy #enr Great move for energy stocks today
Week 2 of COP26 and it is becoming more and more apparent how important wind energy will be... especially with the price of oil now

Is Siemens Energy building a base? Looks like some kind of base, but we need a bullish breakout and price action to confirm the idea. For now price is still in the thin Kumo, but holding nicely above Kijun Sen.
It is very simple: it needs a break and close above 24.45, where we have the very important weekly Kijun Sen too. Set an alert there.
Long
Siemens Energy LongMoin! Zur Zeit ergibt sich durch die Elliot waves ein super Long einstieg bei Siemens Energy!
Im Chart sind die Zielbereiche hinterlegt und auch mögliche Stop losses.
Long
Long the green ponzi politicAfter 5 months of downtrend we are could forming a green doji on montly time frame:
As we can see that the bulls are buying 0.618 (22.52€) and lower.
Latest monthly candle goes below 0.618. Had high sell presure but it holding and closed above 0.618 fib retracement.
For me its more an entry point as an longterm investment. Anyway if you want to trade this setup then you should take profit at 26€ and around 30€ – 32€.
Buy zone: 23€ – 22.50€
Long
Trading Idea - Siemens EnergyBUY
ENTRY: 24.42 EUR
TARGET: 30.00 EUR (+22% profit)
STOP: 22.18 EUR
Siemens Energy AG is active in energy technology. The company focuses on the planning, development, manufacture and delivery of products, systems and services in the field of renewable energies with a focus on wind turbines.
1.) W're hitting on the bottom of a strong support area (24.50 - 26.50)! A rejection is expected! Watch out for that!
2.) Target ist at 30.00 EUR which is the overall most traded price! The point of control! I expect a return to this level!
3.) Orders in the Gas & Power business and sales can still be expanded. However, the order-to-sales ratio was strong in Q1.
4.) The focus at Siemens Energy is clearly on margin recovery. In order to achieve this, the business must focus on increasing profitability. They can do it!
5.) The profitability of business activity is a major weakness of the company.
Long