Omnicom Group Inc
No trades
No trades
Compare with Omnicom Group Inc
0.36 EUR
−46.40 M EUR
14.71 B EUR
282.67 M
Next report date
—
Report period
—
EPS estimate
—
Revenue estimate
—
Details
Sector
Industry
CEO
John D. Wren
Website
Headquarters
New York
Founded
1944
IPO date
Mar 17, 1980
ISIN
US6819191064
CUSIP
681919106
FIGI
BBG000H0MBK9
Identifiers
ISIN US6819191064
Omnicom Group, Inc. is a strategic holding company that operates through global networks, connected capabilities and specialized agencies, which connect its comprehensive portfolio of companies to deliver marketing, sales, communications, and commerce services to many of the largest global companies. Its products and service offerings support client objectives across its primary focus areas: media, content, commerce, generative AI, and branding communications. Omnicom’s agencies integrate data, creativity, and technology to deliver coordinated marketing, communications, and commerce solutions. The company was founded by Maxwell Dane in 1944 and is headquartered in New York, NY.
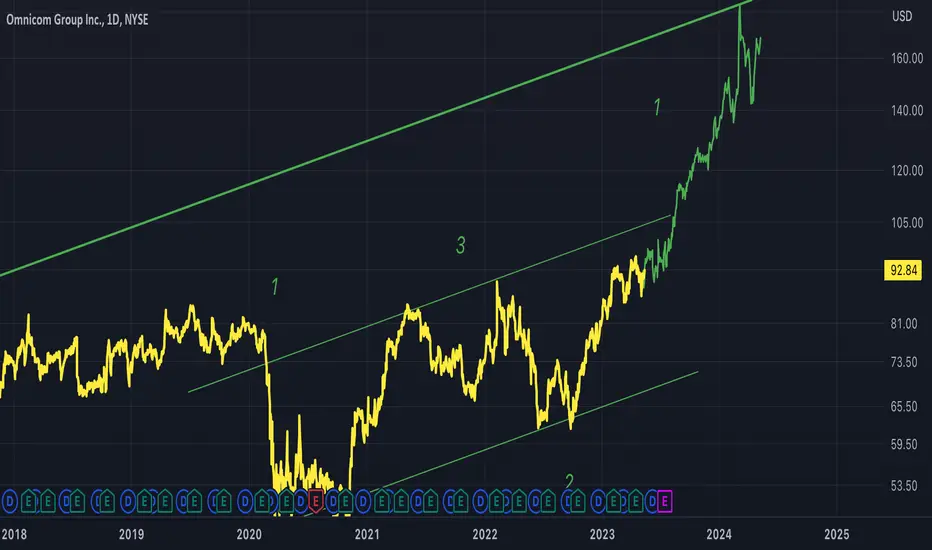
OMC on the Verge: Will a Break Above $79 Ignite a Rally?After reviewing NYSE:OMC , inspired by an excellent idea posted by TopChartPatterns titled “A 10% rally is about to happen in OMC,” I decided to take a closer look at this potential investment.
On the short-term chart, NYSE:OMC is currently in a consolidation phase, forming a rectangle pattern w
A 10% rally is about to happen in OMCA 10% rally is about to happen in OMC
Looking at NYSE:OMC chart, my first reaction is mixed.
On one side, the stock has clearly been in a long-term uptrend since 2020 (higher lows, higher highs). That usually gives me confidence as an investor. But at the same time, there are plenty of sideways
Omnicom Stock Chart Fibonacci Analysis 081325Trading Idea
1) Find a FIBO slingshot
2) Check FIBO 61.80% level
3) Entry Point > 74.5/61.80%
Chart time frame:B
A) 15 min(1W-3M)
B) 1 hr(3M-6M)
C) 4 hr(6M-1year)
D) 1 day(1-3years)
Stock progress:A
A) Keep rising over 61.80% resistance
B) 61.80% resistance
C) 61.80% support
D) Hit the bottom
E
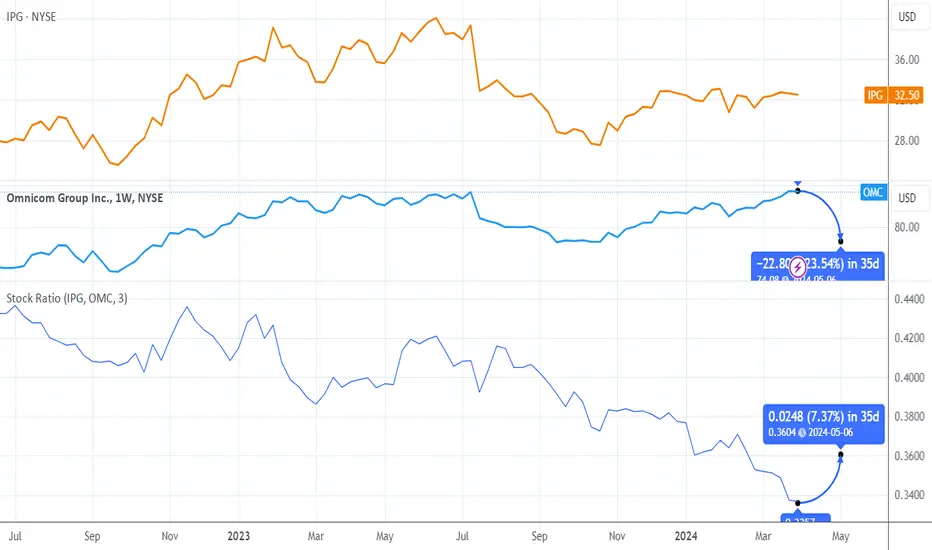
Stocks pairs trading: IPG vs OMCComparing the financial metrics and market dynamics of Interpublic Group (IPG) and Omnicom Group Inc. (OMC) provides valuable insights for investors contemplating their investment choices.
Reasons to Consider Buying IPG Over Selling OMC:
Valuation and Growth Prospects: IPG's forward P/E of 10.
See all ideas
Summarizing what the indicators are suggesting.
Neutral
SellBuy
Strong sellStrong buy
Strong sellSellNeutralBuyStrong buy
Neutral
SellBuy
Strong sellStrong buy
Strong sellSellNeutralBuyStrong buy
Neutral
SellBuy
Strong sellStrong buy
Strong sellSellNeutralBuyStrong buy
An aggregate view of professional's ratings.
Neutral
SellBuy
Strong sellStrong buy
Strong sellSellNeutralBuyStrong buy
Neutral
SellBuy
Strong sellStrong buy
Strong sellSellNeutralBuyStrong buy
Neutral
SellBuy
Strong sellStrong buy
Strong sellSellNeutralBuyStrong buy
Displays a symbol's price movements over previous years to identify recurring trends.
6.660% YTM
Maturity dateOct 1, 2048
Coupon5.40% (Fixed)
6.605% YTM
Maturity dateOct 1, 2048
Coupon5.40% (Fixed)
6.459% YTM
Maturity dateMar 1, 2041
Coupon3.38% (Fixed)
6.410% YTM
Maturity dateJun 15, 2033
Coupon5.38% (Fixed)
6.042% YTM
Maturity dateMar 30, 2030
Coupon4.75% (Fixed)
5.983% YTM
Maturity dateOct 1, 2028
Coupon4.65% (Fixed)
5.926% YTM
Maturity dateJun 2, 2036
Coupon5.30% (Fixed)
5.870% YTM
Maturity dateMar 1, 2031
Coupon2.40% (Fixed)
5.649% YTM
Maturity dateNov 1, 2034
Coupon5.30% (Fixed)
5.596% YTM
Maturity dateJun 2, 2033
Coupon5.00% (Fixed)
5.401% YTM
Maturity dateJun 15, 2033
Coupon5.38% (Fixed)
See all OCN bonds
Weight4.21%
Market value912.04 M
Weight0.03%
Market value659.25 M
Weight0.03%
Market value538.41 M
Weight0.25%
Market value475.17 M
Weight0.04%
Market value308.13 M
Weight0.44%
Market value301.61 M
Weight1.18%
Market value278.64 M
Weight0.03%
Market value272.08 M
Weight0.21%
Market value201.53 M
Weight2.19%
Market value188.95 M
Weight0.97%
Market value173.41 M
Explore more ETFs
Frequently asked questions
The current price of OCN is 70.08 EUR — it has increased by 1.54% in the past 24 hours. Watch Omnicom Group Inc stock price performance more closely on the chart.
Depending on the exchange, the stock ticker may vary. For instance, on XETR exchange Omnicom Group Inc stocks are traded under the ticker OCN.
OCN stock has fallen by −2.18% compared to the previous week, the month change is a 7.29% rise, over the last year Omnicom Group Inc has showed a 0.44% increase.
We've gathered analysts' opinions on Omnicom Group Inc future price: according to them, OCN price has a max estimate of 128.46 EUR and a min estimate of 69.51 EUR. Watch OCN chart and read a more detailed Omnicom Group Inc stock forecast: see what analysts think of Omnicom Group Inc and suggest that you do with its stocks.
OCN stock is 1.51% volatile and has beta coefficient of 0.58. Track Omnicom Group Inc stock price on the chart and check out the list of the most volatile stocks — is Omnicom Group Inc there?
Today Omnicom Group Inc has the market capitalization of 19.98 B, it has decreased by −1.51% over the last week.
Yes, you can track Omnicom Group Inc financials in yearly and quarterly reports right on TradingView.
Omnicom Group Inc is going to release the next earnings report on Jul 28, 2026. Keep track of upcoming events with our Earnings Calendar.
OCN earnings for the last quarter are 1.64 EUR per share, whereas the estimation was 1.57 EUR resulting in a 4.52% surprise. The estimated earnings for the next quarter are 2.34 EUR per share. See more details about Omnicom Group Inc earnings.
Omnicom Group Inc revenue for the last quarter amounts to 5.40 B EUR, despite the estimated figure of 5.06 B EUR. In the next quarter, revenue is expected to reach 5.64 B EUR.
OCN net income for the last quarter is 350.71 M EUR, while the quarter before that showed −801.27 M EUR of net income which accounts for 0.00% change. Track more Omnicom Group Inc financial stats to get the full picture.
Yes, OCN dividends are paid quarterly. The last dividend per share was 0.69 EUR. As of today, Dividend Yield (TTM)% is 3.89%. Tracking Omnicom Group Inc dividends might help you take more informed decisions.
As of Jul 27, 2026, the company has 120 K employees. See our rating of the largest employees — is Omnicom Group Inc on this list?
EBITDA measures a company's operating performance, its growth signifies an improvement in the efficiency of a company. Omnicom Group Inc EBITDA is 2.68 B EUR, and current EBITDA margin is 16.57%. See more stats in Omnicom Group Inc financial statements.
Like other stocks, OCN shares are traded on stock exchanges, e.g. Nasdaq, Nyse, Euronext, and the easiest way to buy them is through an online stock broker. To do this, you need to open an account and follow a broker's procedures, then start trading. You can trade Omnicom Group Inc stock right from TradingView charts — choose your broker and connect to your account.
Investing in stocks requires a comprehensive research: you should carefully study all the available data, e.g. company's financials, related news, and its technical analysis. So Omnicom Group Inc technincal analysis shows the buy rating today, and its 1 week rating is buy. Since market conditions are prone to changes, it's worth looking a bit further into the future — according to the 1 month rating Omnicom Group Inc stock shows the strong buy signal. See more of Omnicom Group Inc technicals for a more comprehensive analysis.
If you're still not sure, try looking for inspiration in our curated watchlists.