WDC: 594-600 Is the Decision Zone Bulls Need to ReclaimThe area between 594 and 600 is, in my opinion, the most important level on the chart right now.
If you look at the arrows I've marked, you'll notice that price has repeatedly reacted in this exact region. Every rejection, bounce, and hesitation tells the same story: buyers and sellers are locked in a battle for control. This isn't just another resistance level—it's a true market inflection point, where whichever side gains control could dictate the next meaningful move.
At the moment, WDC is once again testing this zone, making it the level I'm watching more closely than any other.
Bullish Scenario
What I'd like to see is a clean reclaim of the 594-600 range, followed by a textbook break-and-retest. If buyers can push above this area, hold it as new support, and begin printing higher highs and higher lows, that would signal a shift in momentum and increase the probability of continuation.
Should that confirmation occur, my next upside objective is the 638-642 supply zone, where I'd expect sellers to become active again.
Why This Level Matters
Markets often reveal their intentions at areas where price has repeatedly changed character. The repeated reactions around 594-600 show that both buyers and sellers recognize this as a key value area. The more times price tests a level without decisively breaking away, the more significant that level becomes.
Rather than predicting the breakout, I'm waiting for the market to prove it.
For now, 594-600 remains the line in the sand. A successful reclaim and retest would shift the odds in favor of the bulls and set the stage for a potential move into 638-642. Until then, this remains the key battleground where patience is more valuable than anticipation. If we get the clear break and retest above our key levels I will personally go long. No Break and Retest No Entry!
Key Levels
Major Inflection Zone: 594-600
Bullish Confirmation: Break → Retest → Hold
Upside Target: 638-642 Supply Zone
This is my personal technical analysis and not financial advice. Always manage your risk and trade your own plan.
Western Digital Corporation
No trades
No trades
In-depth trading ideas
Will Western Digital Monopolize the AI Storage Era?Macroeconomics and the Hardware Reset
Wall Street is undergoing a massive artificial intelligence hardware reset. Prominent banks like BofA, Citi, and UBS recently turned intensely bullish on core hardware infrastructure. Analysts are aggressively raising price targets for key storage providers. Artificial intelligence requires vast data repositories, making high-capacity storage an absolute economic necessity. Western Digital sits directly at the center of this structural macroeconomic shift.
Industrial Trends and the Pure-Play Business Model
The storage industry is shifting toward highly specialized corporate frameworks. Western Digital successfully completed its historic Flash spin-off in early 2025. This strategic move detached the volatile NAND flash business into an independent SanDisk entity. Consequently, Western Digital now operates as a pure-play hard disk drive powerhouse. This lean business model captures steady, high-margin revenue from enterprise cloud hyper-scalers.
Geopolitics and Sovereign Geostrategy
Global trade friction forces technology leaders to diversify their physical footprints. Recent political shifts create volatile market dynamics and sudden asset liquidations by prominent accounts. In response, Western Digital is executing a brilliant geopolitical hedge. The corporation just announced a massive RM1.8 billion manufacturing expansion in Sarawak, Malaysia. This move secures vital supply chains away from highly contested geopolitical chokepoints.
Technology, Science, and High-Tech Innovation: Modern data centers demand unprecedented physical storage density. To meet this challenge, Western Digital is pioneering Heat-Assisted Magnetic Recording (HAMR). The science relies on localized laser heating to write microscopic data bits securely. Furthermore, the company's new Sarawak facility focuses entirely on manufacturing advanced glass substrates. Glass resists extreme operational temperatures far better than traditional aluminum materials.
Patent Analysis and Intellectual Property Moats
Intellectual property portfolios dictate long-term market dominance. Patent analysis shows Western Digital aggressively securing high-density recording designs. Their robust patent pipeline protects proprietary technologies like UltraSMR and multi-stage actuation. These patents prevent competitors from easily replicating their massive 40TB drive architectures. By locking down key recording mechanisms, the company builds a highly resilient commercial moat.
Corporate Culture, Management, and Leadership
CEO Irving Tan is instilling a culture of relentless operational agility. Corporate leadership actively aligns technological scaling with strict global sustainability mandates. For example, Western Digital signed a milestone Renewable Energy Certificate agreement with Sarawak Energy. This partnership instantly reduces Scope 2 emissions to zero through clean hydropower. Forward-thinking management proves that green manufacturing enhances corporate profitability.
Cybersecurity and Infrastructure Defense
Massive storage arrays invite sophisticated cyberthreats. Because Western Digital drives form the bedrock of global cloud architecture, hardware security is paramount. A single firmware vulnerability could expose exabytes of sensitive corporate enterprise data. Therefore, the company integrates advanced cryptographic defenses directly into its drive controllers. Robust physical cybersecurity protects the global information economy from devastating infrastructure breaches.
The Pharmaceutical and Bio-Science Nexus
The data storage revolution directly impacts the pharmaceutical industry. Modern drug discovery relies on heavy artificial intelligence workloads to process genetic data. Pharmaceutical giants require massive, ultra-reliable storage pools to map complex molecular structures. By delivering cost-efficient, high-density hardware, Western Digital quietly accelerates life-saving biomedical innovations. The tech sector effectively fuels the next generation of healthcare breakthroughs.
The Bottom Line
Western Digital is quietly re-architecting how the world preserves data. Its bold strategy separates it from legacy competitors. Investors must look past temporary market noise to recognize this infrastructure juggernaut.
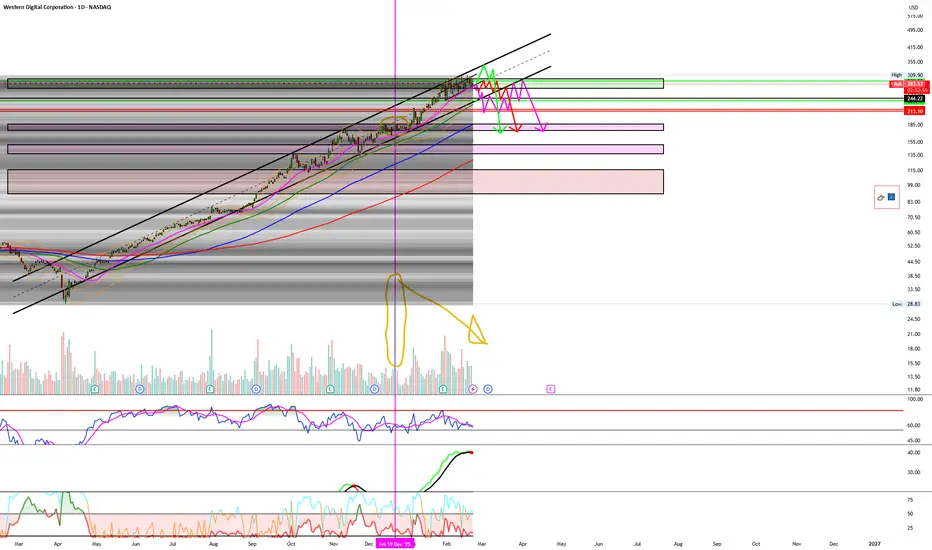
Took profits on my short. Here are my levels to watchI took profits on my short because we have multiple short term factors for me to cover. We are in a technical area of support that, I as a technician of the charts I must respect until proven otherwise. In my humble opinion based on what I see in the charts I do believe we will break this parallel because 8/10 times upsloping parallels tend to break to the down side. Charts like NVDA are actually warning us what is to come! I got what I wanted and I'm out for now I will sit on the side lines and wait to buy or short at my levels. Hope this helps. What is your plan!?
Western Digital momentum suggests another leg higher this weekCurrent Price: 531.21 (Analysis was generated on Monday Morning)
Direction: LONG
Confidence level: 55%(Professional trader commentary consistently references WDC moving strongly alongside other semiconductor leaders, while social sentiment shows more bullish than bearish signals. However, limited explicit technical levels and mixed conviction reduce confidence.)
Targets
Target 1: 547.00
Target 2: 563.00
Stop Levels
Stop 1: 515.00
Stop 2: 504.00
Key Insights:
Here’s what’s driving this setup right now. Several professional traders are pointing out that semiconductor and storage names have been “ripping” recently, and WDC keeps getting mentioned in the same breath as leaders in the space. That matters because capital rotation inside the semiconductor ecosystem often lifts the entire group once momentum builds.
Another factor is the AI infrastructure cycle. Storage demand is expanding as hyperscale data centers grow. News coverage highlights that Western Digital is benefiting from the so‑called “memory melt‑up,” where rising demand for high‑capacity storage pushes pricing and margins higher. That theme is attracting both institutional buyers and retail attention.
What's interesting is the institutional accumulation happening behind the scenes. Large asset managers recently increased their stakes in the company, reinforcing the bullish narrative tied to AI data storage growth. When institutions start scaling positions during a momentum phase, short‑term pullbacks often become buying opportunities.
Recent Performance:
The stock has been one of the strongest performers in the computer hardware segment over the past year, posting more than 200% gains in 2026 according to sector data. Recently, price action has slowed slightly around the $530 zone, but it hasn’t broken down. Instead, it looks like consolidation after a strong run — a pattern traders often see before another push higher.
Expert Analysis:
Professional traders following the semiconductor sector repeatedly grouped Western Digital with other high‑momentum names like Micron, AMD, and SanDisk. Several traders described these stocks as continuing to “rip,” which is trader shorthand for sustained bullish momentum.
When I look at the setup, the takeaway is simple: the sector leadership remains intact. If the semiconductor momentum trade continues this week, WDC could follow the same pattern where consolidation resolves with another upside burst. Traders often chase these continuation setups once the stock holds above recent support zones.
News Impact:
Recent developments add fuel to the story. Institutional investors including major global funds have increased their exposure to WDC, and the appointment of a former Nvidia executive to the board strengthens the company’s AI positioning. On top of that, analysts highlight improving gross margins — potentially reaching the 51‑52% range — thanks to higher‑capacity drives and better pricing.
That combination of AI demand, improving margins, and institutional buying is exactly the kind of narrative that tends to attract momentum traders.
Trading Recommendation:
Here’s my take. I’m leaning LONG on WDC this week as long as price holds above the $515 support zone. The broader semiconductor momentum and AI storage demand narrative give this trade a solid backdrop.
My strategy would be entering near the current price around $531 with an upside target near $547 first, followed by a momentum extension toward $563 if buyers step back in. Risk management matters here — a break below $515 weakens the short‑term structure, and $504 is the level where I’d fully step aside.
This isn’t the highest‑conviction trade in the market right now due to limited technical signals, but momentum plus strong sector tailwinds make it a setup worth watching closely this week.
Western Digital #WDC: AI Storage Boom Could Push the Stock Towar✅ Western Digital #WDC is one of the key players in the data storage segment: HDDs, enterprise drives, and infrastructure solutions for the cloud and data center market. Against the backdrop of the AI boom, demand for high-capacity data storage systems remains one of the main growth drivers for the company.
📊 FUNDAMENTAL ANALYSIS
🟢 Western Digital continues to benefit from the expansion of AI infrastructure and the growing demand for data storage from hyperscalers and cloud providers.
🟢 The company delivered strong fiscal Q3 2026 results: revenue reached $3.34 billion, up approximately 45% year-over-year, while adjusted EPS exceeded market expectations.
🟢 Guidance for the next quarter also remains strong: the company expects revenue of around $3.65 billion, above analysts’ consensus estimates, confirming sustained demand for storage solutions.
🟢 Following the separation of its flash memory business into SanDisk, Western Digital has become a more focused company in the data storage market for data centers, strengthening the investment case amid the AI cycle.
🟢 Another positive factor is long-term contracts and limited supply in the HDD/SSD sector. This supports pricing power and gives the company better visibility into future revenue.
🔴 The main risk is that the stock has already made a very strong move higher, so sharp corrections and profit-taking are possible.
🔴 The second risk is dependence on AI capex and demand from major cloud customers. Any slowdown in data center investment could negatively affect valuation multiples and investor sentiment.
🛠 TECHNICAL ANALYSIS
📈 LONG
▪️ The price is trading above the 50 EMA and 200 EMA on the 4H timeframe, which means the medium-term structure remains bullish.
▪️ After breaking out of the ascending channel, the stock entered a corrective phase and is now testing a breakout of the descending resistance line.
▪️ The chart shows a rebound from the 50 EMA zone, indicating that buyers are still active on pullbacks.
▪️ The current price is around $481.65, above the Pivot zone at $476.97. A consolidation above the Pivot would increase the probability of continued upside movement toward new highs.
▪️ RSI has turned upward from the neutral zone and is not yet in overbought territory, leaving room for further growth.
▪️ OsMA/MACD shows a recovery in momentum: the histogram is moving into positive territory, confirming the return of buyers.
▪️ The nearest important support is the S1 zone at $349.17, as well as the dynamic support of the 50 EMA. As long as the price remains above these levels, the long scenario stays valid.
▪️ The key resistance area is the previous high around $525.15. A breakout and consolidation above this zone could open the way toward T1 and T2.
↗️ TRADE
🎯 First target price: $603.80
🎯 Second target price: $681.00
📊 Upside potential: approximately 41%
💼 Portfolio: #active_management
⚠️ The published ideas are not investment recommendations. They represent only the personal opinion of the author of this blog.
Western Digital: A Duopoly Business With Cyclical EconomicsExecutive Summary:
Western Digital operates in an unusually concentrated industry: a global duopoly that produces the cheapest large-scale storage medium used to store the world’s data. That positioning matters. At the same time, the company’s current financial performance looks more like peak cycle profitability than normalized earnings power. With the stock trading around $85.74 per share, the valuation appears close to fair value under reasonable assumptions rather than meaningfully discounted. Margin of safety verdict: limited. For a strict value investor, this looks more like a business to keep on the watchlist than one to purchase immediately.
One Stock, Dozens of Voices:
This analysis does not rely on a single viewpoint. CrowdWisdom aggregated 22 independent sources covering Western Digital, including 20 financial research articles from the web, one live market intelligence feed, and one verified financial data check through Yahoo Finance. The goal was to synthesize the common themes: where investors broadly agree, where opinions diverge, and what assumptions may already be embedded in the stock price.
Those perspectives were then tested against one another by constructing a bull case, a bear case challenging the prevailing consensus, and an examination of what expectations the market may already be pricing in. Financial metrics referenced throughout were cross-checked against current market data.
The sections that follow highlight where opinions align, where they split, and whether today’s price offers a genuine margin of safety.
Business Quality and Moat Durability:
Western Digital today is primarily an enterprise storage supplier focused on hard disk drives used in hyperscale data centers. After spinning off its flash memory business, the company now operates essentially as a pure play HDD manufacturer.
The structure of the HDD market is both unusual and important. Global supply has consolidated into a near duopoly led by Western Digital and Seagate. Western Digital controls roughly 55 to 60 percent of the global market. Entering this industry from scratch would be extraordinarily difficult. Developing a competitive HDD platform requires decades of engineering expertise, complex firmware design, highly precise manufacturing processes, and long-standing supplier relationships.
Two structural advantages help support this industry.
The first is cost per terabyte. Even today, HDD technology remains significantly cheaper than solid-state drives when storing very large volumes of data. Hyperscale cloud operators continue to rely heavily on HDDs for cold storage and nearline workloads where cost efficiency matters more than speed.
The second advantage comes from integration friction. Hyperscalers qualify storage hardware through long engineering and validation cycles. Once a particular drive architecture is deployed across thousands of servers, switching suppliers introduces operational risk and extensive testing requirements.
Still, the moat should not be overstated. The advantage here is largely economic and tied to technology cost curves rather than a permanent structural barrier.
If flash memory eventually becomes materially cheaper per terabyte, the economic case for HDDs could weaken.
Moat verdict: stable today, but not widening. Long-term durability will depend heavily on how competing storage technologies evolve on the cost curve.
Return on Invested Capital (ROIC):
Precise ROIC figures are not available in the dataset, which itself highlights a limitation for investors who prioritize detailed capital efficiency analysis.
What can be inferred instead is the relationship between cash generation and capital intensity.
In the most recent quarter, Western Digital produced roughly $653 million in free cash flow on revenue of about $3.02 billion. That works out to a free cash flow margin of approximately 21.6 percent.
Capital expenditures during the same period were about $92 million, or roughly 3 percent of revenue. In the current environment, that implies extremely strong incremental returns on invested capital.
However, this snapshot may give an incomplete picture.
Hardware manufacturing businesses often appear capital light during periods of strong demand because the major investments in production capacity have already been made. When new technology transitions occur, capital requirements usually increase again.
Future development of technologies such as HAMR or MAMR could require additional research spending, new manufacturing equipment, and significant yield optimization.
If capital expenditures move closer to 6 to 10 percent of revenue during those transitions, incremental ROIC could fall meaningfully.
For that reason, current returns likely reflect elevated cycle economics rather than steady-state profitability.
Quality of Earnings:
At first glance, Western Digital’s earnings quality appears solid.
Operating cash flow reached about $745 million in the most recent quarter, while free cash flow totaled roughly $653 million. That indicates strong conversion of accounting earnings into real cash.
Looking back a bit further, however, tells a more cyclical story.
Just two fiscal years earlier, the company generated negative free cash flow during a downturn in the storage cycle. Revenue fell while fixed manufacturing costs remained in place.
This kind of volatility is typical for hardware manufacturers whose demand depends heavily on capital spending cycles.
The current profitability surge appears genuine, but it should not be assumed to represent a permanent baseline.
Capital Allocation Scorecard:
Management has recently placed greater emphasis on returning capital to shareholders.
The company authorized a $2 billion share repurchase program and bought back approximately $615 million of stock in the latest quarter alone. Western Digital also pays a small dividend.
Leverage looks manageable, with debt to EBITDA around 1.4 times. Cash balances are roughly comparable to total debt, suggesting a reasonably balanced balance sheet.
The key question is timing.
Share repurchases create value when shares are bought below intrinsic value. If repurchases occur during a period of peak cycle profitability, they can end up destroying value rather than creating it.
Capital allocation grade: B. Balance sheet discipline appears reasonable, though the scale of buybacks during a strong cycle warrants attention.
Customer and Revenue Concentration:
Customer concentration represents one of the most significant structural risks in the investment case.
Hyperscale cloud providers account for the vast majority of Western Digital’s revenue. The cloud segment represents close to 89 percent of total revenue in recent disclosures.
The customer list includes some of the largest technology companies in the world, including Amazon, Microsoft, Google, Meta, and other global cloud infrastructure operators.
These customers have enormous bargaining power. They purchase storage in extremely large volumes and continually optimize the cost structure of their infrastructure.
If even one or two of these companies shifted portions of their storage architecture toward SSD or internally designed solutions, Western Digital could face a sudden drop in demand.
That level of concentration creates a structural vulnerability investors should keep in mind.
Management Alignment:
Insider ownership appears typical for a mature technology manufacturer rather than unusually high.
Recent insider activity shows several senior executives selling shares totaling roughly five to six million dollars during early 2026.
Insider sales by themselves do not necessarily signal negative expectations. Executives often sell shares for diversification or tax purposes.
However, the absence of insider buying during a period of strong profitability does not indicate particularly strong internal conviction either.
Institutional ownership remains dominated by large passive asset managers such as BlackRock, Vanguard, and State Street.
Overall alignment appears neutral rather than strongly positive.
10-Year Durability Test:
The key question for Western Digital is not next quarter’s demand. It is whether HDD technology still holds economic relevance in 2036.
History offers mixed evidence.
For more than a decade, analysts have predicted that solid-state storage would eventually replace HDDs. Yet HDDs remain widely used because their cost per terabyte is dramatically lower for large-scale storage.
That advantage matters enormously when hyperscalers manage hundreds of exabytes of data.
Still, technology cost curves rarely remain fixed.
Flash memory prices continue to fall, and hyperscale companies constantly redesign infrastructure to optimize both performance and cost.
Artificial intelligence workloads add another layer of uncertainty. Some AI applications require faster storage tiers, which could gradually increase demand for SSD-based solutions.
The most realistic outcome is gradual evolution rather than sudden disruption. Consumer HDD markets may continue shrinking while enterprise cold storage remains stable.
Even so, forecasting the balance between these technologies ten years from now is difficult.
For investors who require highly predictable long-term economics, this business may begin to approach the edge of the “too hard” pile.
Multi-Year Thesis (3 to 7 years):
Base Case Scenario
Probability: 50 percent
Assumptions:
Exabyte demand from hyperscalers continues growing steadily as cloud infrastructure expands. HDD maintains its cost advantage for cold storage, though margins ease slightly from current elevated levels.
Revenue grows around 6 to 8 percent annually. Gross margin settles near 42 percent rather than the current mid 40s level. Free cash flow margins normalize near 15 percent.
Estimated intrinsic value: approximately $90 per share.
Bull Case Scenario
Probability: 25 percent
Assumptions:
Artificial intelligence workloads accelerate growth in global data storage demand. The HDD duopoly maintains supply discipline while density improvements increase capacity per drive without requiring large increases in capital intensity.
Revenue growth approaches 10 percent annually while margins remain near current levels above 45 percent.
Estimated intrinsic value: approximately $120 to $130 per share.
Bear Case Scenario
Probability: 25 percent
Assumptions:
Hyperscale storage demand slows or shifts toward SSD architectures. Pricing pressure increases and margins revert closer to historical averages.
Gross margins fall toward 38 percent and free cash flow margins decline toward 8 to 10 percent.
Estimated intrinsic value: roughly $60 to $65 per share.
Probability weighted intrinsic value across scenarios: roughly $90 per share.
Margin of Safety Verdict:
For value investors, the margin of safety is the central question.
With shares trading near $85.74, Western Digital sits close to the estimated intrinsic value derived from normalized assumptions.
That leaves relatively little room for error.
If margins remain elevated and demand continues to expand, modest upside is possible. But if margins revert toward historical levels, the downside could reach 20 to 30 percent.
Under a disciplined value framework, the current price looks closer to fair value than to a clear bargain.
Peak Margin Stress Test:
Current profitability may reflect unusually strong industry conditions.
Gross margin recently reached roughly 46 percent while operating margin exceeded 30 percent.
Assume margins revert toward a more typical range near 39 percent.
Operating income could decline roughly 30 to 40 percent due to operating leverage embedded in the manufacturing base.
Free cash flow margins could compress from about 21 percent today to closer to 10 to 12 percent.
Under those assumptions, a normalized valuation might fall toward the $60 to $70 range.
That scenario implies potential downside of roughly 20 to 30 percent if peak margins fade.
Valuation Framing:
Several different valuation approaches point toward similar conclusions.
A normalized free cash flow model assuming approximately $1.2 billion annual FCF and a 10 percent discount rate suggests intrinsic value near $90.
A comparable multiple approach based on mid cycle earnings produces a similar range around $85 to $95.
Narrative driven valuations exceeding $180 rely on assumptions of sustained peak margins combined with unusually strong growth. Given the industry’s historical cyclicality, those assumptions appear optimistic.
Perception vs Reality:
Perception: AI driven data growth guarantees long term demand expansion and structurally higher margins.
Reality: data growth is real, but hardware supply chains often remain cyclical even when underlying demand trends are strong.
Perception: the HDD duopoly ensures durable pricing power.
Reality: hyperscale customers retain significant negotiating leverage because they represent the majority of global demand.
Why This May Be Misunderstood:
Markets often extrapolate peak profitability during technology cycles.
When supply tightens and demand surges, margins can expand rapidly. Investors may interpret this as a structural shift rather than a cyclical high point.
Western Digital’s recent profitability may reflect exactly that dynamic.
Three Measurable Things to Watch Next Quarter:
First, gross margin sustainability. If margins remain above 45 percent for several consecutive quarters, it would suggest a structural improvement rather than temporary supply tightness.
Second, hyperscaler purchase commitments. Changes in long term supply agreements could signal shifts in demand or storage architecture.
Third, capital expenditure trends. A meaningful rise in capex could indicate heavier investment requirements for next generation storage technologies.
Historical Conviction Drift:
Investor enthusiasm around Western Digital has increasingly followed the broader artificial intelligence infrastructure narrative.
As data center spending accelerated, sentiment toward storage suppliers improved significantly.
Momentum traders and investors have begun grouping Western Digital with other AI infrastructure plays.
Yet beneath that narrative, the economics still resemble those of a hardware manufacturer exposed to capital spending cycles rather than a software-like compounder.
Disconfirming Evidence:
The strongest argument against owning Western Digital is simple.
The entire business depends on HDD technology remaining cheaper than flash memory for large-scale storage.
If NAND flash cost curves decline faster than expected, hyperscalers could migrate substantial portions of their storage workloads toward SSD.
In that scenario, Western Digital’s competitive position would be permanently weakened.
Risks:
Technology substitution from SSD or emerging storage architectures.
Customer concentration among hyperscale cloud providers.
Cyclical swings in data center capital expenditures.
Execution risk in next generation recording technologies.
Value destruction if large buybacks occur during peak cycle profitability.
Summary:
Western Digital is a respectable business operating within a favorable industry structure. The HDD duopoly provides a degree of stability, and the cost advantage of HDD storage remains meaningful for large-scale archival data.
At the same time, the business remains cyclical and heavily dependent on a small group of hyperscale customers. The current margin profile likely reflects strong conditions in the cycle rather than normalized economics.
At current prices, the stock appears roughly fairly valued.
For disciplined value investors focused on margin of safety, Western Digital may be best treated as a watchlist candidate until a more attractive entry point appears.
Data Snapshot:
Company: Western Digital Corporation
Metric: Value
Current Price (WDC): $343.43
Market Capitalization: $117.42 billion
Shares Outstanding: 339,037,922
Trailing P/E: 32.46x
Forward P/E: 25.19x
Enterprise Value (EV): $117.42 billion
EV/EBITDA: 34.98x
Revenue (TTM): $10.73 billion
Gross Margin: 42.72%
Operating Margin: 31.92%
Free Cash Flow (FCF): $3.90 billion
FCF Yield: 3.32%
52-Week Range: $35.00 to $349.75
Sector: Technology
Industry: Computer Hardware
References:
1. Yahoo Finance. Is There Now An Opportunity In Western Digital Corporation (NASDAQ:WDC)?. finance.yahoo.com
2. Yahoo Finance. Is There Now An Opportunity In Western Digital Corporation (WDC)?. finance.yahoo.com
3. Yahoo Finance. Western Digital (WDC): Reassessing Valuation After ESOP Offering, AI Storage Tailwinds, and Capital Return Moves. finance.yahoo.com
4. Yahoo Finance. What Does Western Digital Corporation's (NASDAQ:WDC) Share Price Indicate?. finance.yahoo.com
5. Yahoo Finance. Why Is Western Digital Corporation (WDC) Among Billionaire Paul Singer’s Top Long-Term Stock Picks?. finance.yahoo.com
6. Yahoo Finance. Is It Too Late To Consider Buying Western Digital Corporation (NASDAQ:WDC)?. finance.yahoo.com
7. Yahoo Finance. Western Digital (WDC) Surges 19.1% After Analyst Upgrades Driven by AI Data Center Demand. finance.yahoo.com
8. Yahoo Finance. Western Digital Corp (WDC) Q2 2026 Earnings Call Highlights: Strong Revenue Growth and Strategic Customer Agreements. finance.yahoo.com
9. Yahoo Finance. Sandisk Corporation (SNDK): A Bull Case Theory. finance.yahoo.com
10. Forbes. The Case For Intel: An Illustration Of The Value Investing Mindset. www.forbes.com
11. Yahoo Finance. How Western Digital’s AI Linked ESOP Shelf Offering Has Changed Its Investment Story. finance.yahoo.com
12. Yahoo Finance. Is There Now An Opportunity In Western Digital Corporation. finance.yahoo.com
13. Yahoo Finance. Warren Buffett: America's businesses usually find a way. finance.yahoo.com
14. Yahoo Finance. Western Digital Trim And Fund Exit Reframe Sandisk AI Valuation Story. finance.yahoo.com
15. Yahoo Finance. Sandisk Corporation (SNDK): A Bull Case Theory. finance.yahoo.com
16. Forbes. The Rise And Reality Of Digital Asset Treasury Companies. www.forbes.com
17. Wall Street Journal. How Index Funds Democratize Investing. www.wsj.com
18. Yahoo Finance. Western Digital’s AI Storage Shift Puts Hyperscaler Roadmap In Focus. finance.yahoo.com
19. Wall Street Journal. Is It Time to Diversify Away From U.S. Stocks Into Global Markets?. www.wsj.com
20. Yahoo Finance. Google TurboQuant Puts Western Digital AI Storage Growth In Focus. finance.yahoo.com
21. Insider Monkey. Analysts Note Growth Potential and Risks for Western Digital (WDC). www.insidermonkey.com
22. Western Digital Investor Relations. Investor Events. investor.wdc.com
23. Western Digital. Western Digital Reports Fiscal Second Quarter 2026 Financial Results. www.westerndigital.com
24. Seeking Alpha. Western Digital Earnings Summary. seekingalpha.com
25. Wall Street Journal Market Data. Western Digital Financials. www.wsj.com
26. Fiscal.ai. Western Digital Free Cash Flow Metrics. fiscal.ai
27. StockAnalysis. Western Digital Statistics. stockanalysis.com
28. StockTitan. Western Digital Financial Statements. www.stocktitan.net
29. Western Digital Investor Relations. Western Digital Reports Fiscal Second Quarter 2026 Financial Results. investor.wdc.com
30. InsiderScreener. Western Digital Insider Transactions. www.insiderscreener.com
31. Morpher. Western Digital Institutional Ownership Insights. www.morpher.com
32. Yahoo Finance. Combined valuation discussion articles. finance.yahoo.com finance.yahoo.com finance.yahoo.com
33. Yahoo Finance. Western Digital Corp (WDC) Q2 Earnings Highlights. finance.yahoo.com
34. Yahoo Finance. Western Digital AI Linked ESOP Shelf Offering. finance.yahoo.com
35. ChartGuys YouTube Channel. Market analysis video discussing WDC sector momentum. www.youtube.com
36. Disclaimer: This material is for informational purposes only and does not constitute investment advice. Investors should conduct their own research and consider their financial circumstances before making investment decisions.
WDC Momentum Building: Traders Eye Push Toward $368:Current Price: 343.43 (Analysis was generated on Monday Morning)
Direction: LONG
Confidence level: 58%(Several professional traders described bullish momentum, higher lows, and potential upside toward the 368 level. However, social sentiment volume is small and there are limited explicit price targets, reducing conviction.)
Targets
Target 1: 355.00
Target 2: 368.00
Stop Levels
Stop 1: 335.00
Stop 2: 325.00
Key Insights:
Here's what's driving this setup. Several professional traders highlighted strong momentum across semiconductor and storage names, and Western Digital was specifically mentioned as one of the stocks showing strong short‑term upside momentum. That matters because storage names often move together when capital rotates into AI infrastructure and data‑center hardware.
Another interesting point from trader discussions is the expectation of a daily higher low forming on the hourly chart. When traders talk about higher lows in this context, they're basically watching for accumulation before another push upward. That pattern often precedes continuation moves, especially when the broader semiconductor space is already strong.
The level that keeps popping up in trader discussions is $368. Several traders referenced this zone as the level that would open the door for a catch‑up move relative to other memory stocks that have already pushed to new highs. That's why I'm using it as the upper target for the week.
Recent Performance:
You can see this sentiment reflected in price action. WDC is currently trading around $343.43, sitting comfortably above major trend averages and continuing the strong run following recent earnings momentum. The stock has been trending upward while many hardware names are consolidating, which tells me buyers are still active.
What stands out is that dips have been relatively shallow. That kind of price behavior usually means institutional accumulation rather than speculative spikes. As long as the stock holds the mid‑$330s area, the structure of the uptrend remains intact.
Expert Analysis:
Traders watching this setup repeatedly pointed to higher‑low behavior on shorter timeframes, suggesting the pullbacks are being bought. That’s often the early stage of another breakout attempt.
The key technical discussion among professional traders revolves around $368. Many traders see that as the level where WDC could accelerate because other storage peers have already printed new highs. In other words, some traders think WDC might be playing catch‑up.
Another point traders highlighted is sector strength. When both memory and AI infrastructure names push together, momentum funds tend to rotate capital into the group. WDC tends to benefit from those flows.
News Impact:
Recent coverage around AI‑driven storage demand and strong earnings performance is reinforcing the bullish narrative. Analysts raising price targets and highlighting demand for cloud storage infrastructure have kept WDC in focus for momentum traders.
There’s also ongoing discussion around possible strategic moves involving Kioxia, which adds a layer of optional upside speculation. Even though nothing is guaranteed, these kinds of headlines often keep traders engaged with the stock.
Trading Recommendation:
Putting it all together, I'm leaning LONG on WDC this week. The professional trader commentary consistently points toward momentum continuation, and the technical structure still favors higher prices if support holds.
My approach would be to look for entries around the $340–$345 area, targeting $355 first and $368 as the breakout level many traders are watching. Risk management matters here—if price breaks below $335, momentum likely fades, and a deeper pullback toward $325 becomes possible.
This isn't a high‑certainty setup because the social data volume is limited, but the trader analysis and technical structure both tilt bullish. For short‑term traders, the risk‑reward still looks favorable on the upside.
WDC Is Up 900%+ Over 12 Months, But Its Chart Hints at CoolingMemory chips have been in demand to the point of scarcity, driving Western Digital NASDAQ:WDC to record highs -- up some 90% year to date and more than 900% over the past 12 months. But are the storage-solutions company's stock chart and fundamental analysis telling a different story?
Let's check it out:
Western Digital's Fundamental Analysis
Industry leaders like Micron Technology NASDAQ:MU and Sandisk NASDAQ:SNDK (a former Western Digital unit spun off in 2025) have been trending thanks to the advent of artificial intelligence and date-center expansions.
As for Western Digital, the firm will likely report fiscal Q3 results very late in April, with the Street currently looking for $2.35 in adjusted earnings per share on $3.25 billion of revenue.
That would represent 72.8% growth from the $1.36 in adjusted EPS that the company reported for the year-ago period, while also totaling close to 41% in year-over-year sales growth.
That kind of growth will have analysts watching closely for forward guidance, with the Street's current consensus for full year sales sitting at about $12.47 billion.
And very interestingly, all 17 sell-side analysts that I know of who cover WDC have revised their earnings estimates higher for this quarter since the period began.
Western Digital's Technical Analysis
Now let's look at WDC's daily chart going back some 4-1/2 months and running through Thursday afternoon (April 2):
Readers will see that this chart has been dominated by a rising-wedge pattern of bearish reversal (the orange-shaded area).
The stock also recently fell below its 21-day Exponential Moving Average, or "EMA," marked with green line. It also pierced but did not break its 50-day Simple Moving Average, or "SMA," denoted by a blue line. Those are both generally bearish signs.
Now, it's not at all uncommon for stocks to touch both the top and bottom of closing-wedge patterns three to four times prior to breaking out in either direction. For example, the stock survived its lower test of this pattern in late March.
Meanwhile, Western Digital's Relative Strength Index (the gray line at the chart's top) has improved to where it's now better than neutral.
Similarly, the stock's daily Moving Average Convergence Divergence indicator (the blue bars and black and gold lines at the chart's bottom) is starting to look better after recently taking a sudden downturn.
The histogram of the stock's 9-day EMA (the blue bars) has been moving back back towards zero, while the 12-day EMA (the black line) is trying to cross back above the 26-day EMA (the gold line). All of that is potentially bullish.
(Moomoo Technologies Inc. Markets Commentator Stephen "Sarge" Guilfoyle had no position in WDC at the time of writing this column.)
This article discusses technical analysis, other approaches, including fundamental analysis, may offer very different views. The examples provided are for illustrative purposes only and are not intended to be reflective of the results you can expect to achieve. Specific security charts used are for illustrative purposes only and are not a recommendation, offer to sell, or a solicitation of an offer to buy any security. Past investment performance does not indicate or guarantee future success. Returns will vary, and all investments carry risks, including loss of principal. This content is also not a research report and is not intended to serve as the basis for any investment decision. The information contained in this article does not purport to be a complete description of the securities, markets, or developments referred to in this material. Moomoo and its affiliates make no representation or warranty as to the article's adequacy, completeness, accuracy or timeliness for any particular purpose of the above content. Furthermore, there is no guarantee that any statements, estimates, price targets, opinions or forecasts provided herein will prove to be correct.
Moomoo is a financial information and trading app offered by Moomoo Technologies Inc. In the U.S., investment products and services on Moomoo are offered by Moomoo Financial Inc., Member FINRA/SIPC.
TradingView is an independent third party not affiliated with Moomoo Financial Inc., Moomoo Technologies Inc., or its affiliates. Moomoo Financial Inc. and its affiliates do not endorse, represent or warrant the completeness and accuracy of the data and information available on the TradingView platform and are not responsible for any services provided by the third-party platform.
WDC first target $175!WDC rsi divergence and a recent break of the uptrend line, and a retest above it. This is one of the few stocks spared from the selloff. Wall street takes them ALL to the woodshed sooner or later. So many negatives on the horizon, how can this possibly continue the upward momentum?
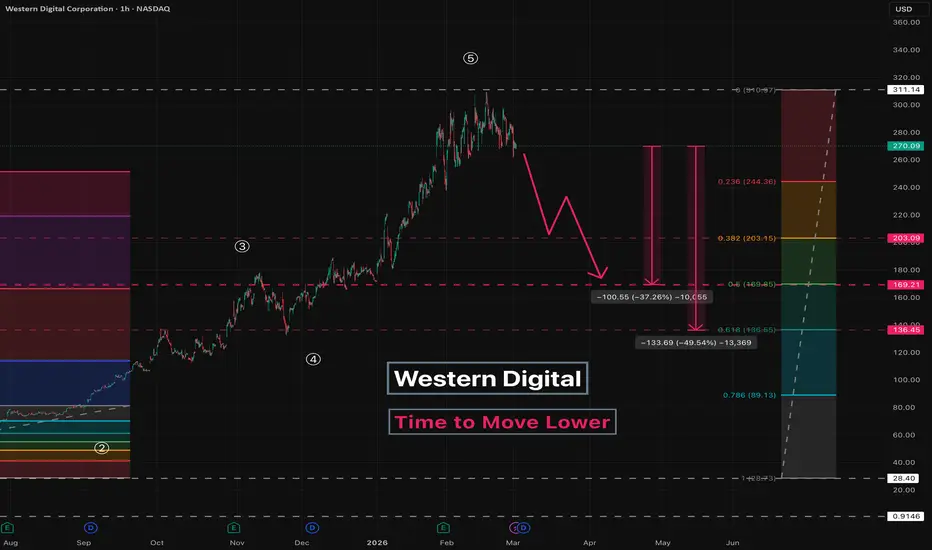
Western Digital - Time to Move LowerLet’s take a look at NASDAQ:WDC
In previous ideas, we discussed the upside potential - for example here:
Now it’s time to talk about downside risk.
Price is expected to return to the origin of Wave 5 .
Preliminary targets:
203 - local correction
169
136
Potential move from current levels: ~37-49%
A similar structure can be observed in NASDAQ:STX and NASDAQ:SNDK
See other ideas for more details.
---
Subscribe and leave a comment.
You’ll get new ideas faster than anyone else.
---
Western Digital - 2026BUY and HOLD
**The 2022–2025 story is extreme:** From -56% in 2022 (HDD downcycle + macro), through modest recovery in 2023–2024, to an extraordinary ~+970% in 2025 — fuelled by AI demand re-rating and the SanDisk spinoff that transformed WDC into a pure-play HDD company. A $10k buy-and-hold from 2022 turned into ~$394,000.
**The fundamental case right now is real:** Q2 FY26 delivered revenue of $3.02B (+25% YoY) and EPS of $2.13 (+78% YoY), both above the high end of guidance. Q3 guidance points to ~40% YoY revenue growth, with gross margin expected at 47–48% — sequential expansion for three consecutive quarters.
**The AI storage thesis is structural:** WDC's cloud revenue rose to 89% of total sales and hyperscalers are effectively locking in supply through 2027, placing orders early to avoid constraint as they expand GPU clusters. The CEO confirmed the company is "pretty much sold out for calendar 2026" with firm purchase orders from the top 7 customers.
**Capital discipline adds conviction:** WDC returned over 100% of its free cash flow to shareholders in Q2 via buybacks and dividends, and the board authorised an additional $4B in share repurchases.
**One honest caveat:** WDC is a high-beta name (2.26×) — if the AI trade pauses or hyperscalers slow capex, the stock can correct quickly. After a near-10× move in 2025, position sizing and DCA on pullbacks (the stock dropped 10% the day of the Q2 earnings beat) remain important disciplines.
Western Digital at $285: Trader Risks Point to a Pullback This Current Price: 285.52 (Analysis was generated on Monday Morning)
Direction: SHORT
Confidence level: 58%(Several professional traders consistently highlighted China exposure and memory oversupply risks, but lacked precise short-term price targets. Social data volume is limited, keeping confidence moderate rather than high.)
Targets
Target 1: 275.0
Target 2: 268.0
Stop Levels
Stop 1: 295.0
Stop 2: 305.0
Key Insights:
Here’s what’s driving my short bias. Several professional traders flagged Western Digital’s heavy exposure to China-linked demand and supply chains. That matters right now because trade policy uncertainty and rising domestic competition inside China can hit orders quickly, especially for hardware and memory-related names.
Another recurring theme from traders is industry supply risk. Memory markets don’t turn gently. When major players ramp production at the same time, pricing pressure follows fast. Multiple traders pointed out that if NAND supply loosens even slightly, margins can compress before the market has time to react. That’s not a long-term thesis — it’s a short-term risk window.
Recent Performance:
You can see this tension in the price action. WDC pushed up into the mid-$280s after strong momentum earlier in February, but volume has cooled. The stock is now sitting closer to a psychologically important resistance zone near $300 than to firm support. When price stalls like this, downside tests tend to come first before any sustained breakout.
Expert Analysis:
Professional traders I’m tracking aren’t calling for a collapse — they’re warning about a reset. The consensus view is that upside from here looks crowded, while downside toward the $270 area could happen quickly if broader tech sentiment wobbles or if memory pricing headlines hit. With no widely shared bullish price targets for this week, risk control takes priority.
News Impact:
Recent analyst upgrades and buyback headlines helped fuel the earlier run, but traders are now asking whether that good news is fully priced in. At the same time, macro uncertainty around tariffs and global demand is back in focus. When positive news stops pushing price higher, that’s often when short-term sellers step in.
Trading Recommendation:
Here’s my take. I’m leaning SHORT on Western Digital this week while price holds below $295. I’d look for a move toward $275 first, with a deeper flush to $268 if selling accelerates. Risk is clearly defined above $305, where this setup is wrong. This is a tactical trade, not a statement on the company’s long-term future.
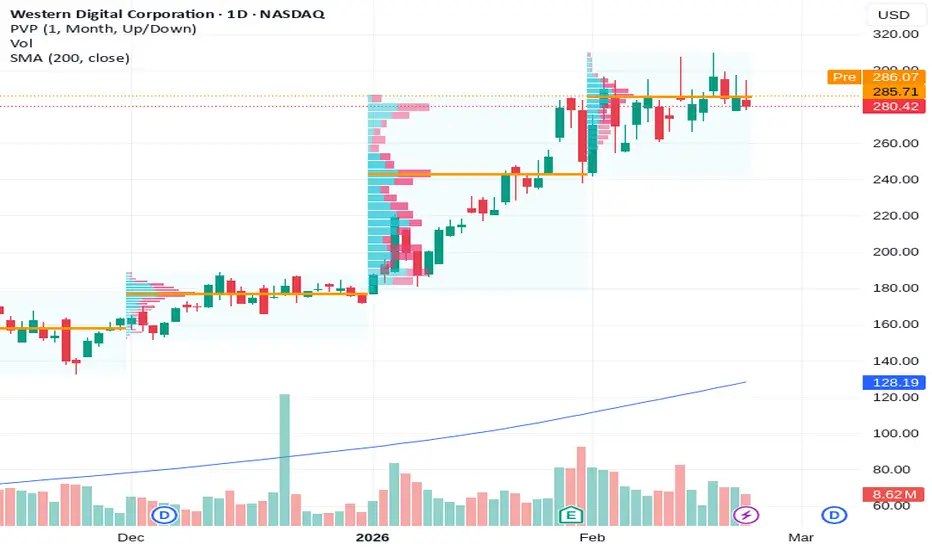
Larger time frame rolling over. Very extended...The largest volume candle sits at where I think price is heading to in the near term future.
That testing of support will be the make or break moment but we most likely will still consolidate up here at the higher prices per share for the next 1-3 months.
Long term pattern points down.
WDC — Long Setup (Trend Continuation)The trend structure remains strong, with ADX ~46 confirming robust directional strength. Price trades well above both the SMA200 and SMA50 and remains positioned above the 1-hour VWAP, indicating a favorable continuation environment.
Momentum supports the upside case (1h RSI 60; positive 4h MACD histogram). The entry zone at 282 –286 aligns with current technical structure and defined risk parameters (stop: 234.54, approx. R 1:2.5). Upside targets are 296 (conservative) and 404 (primary).
Order flow is currently normal, indicating no clear institutional absorption; monitor this closely for any shift toward absorption or churn, which could materially affect trade management in this particular setup.
Overall summary: Technical strength + supportive sentiment justify a buy, with disciplined risk control at 234.54 (SL) and ongoing monitoring of volume profile and news flow.
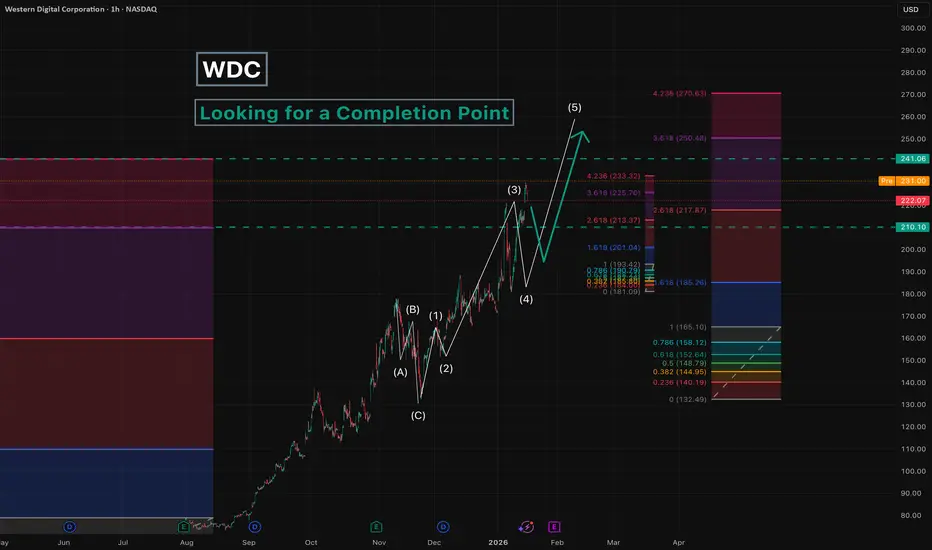
WDC - Looking for a Completion PointContinuing the idea from the previous analysis.
If we take a closer look at the chart, most corrections are zigzags .
Therefore, the move starting from November 2025 can be considered the beginning of a five-wave structure.
This means we may expect the move to complete slightly higher than previously anticipated.
Key targets:
250
270
Most importantly, you’ve been warned - the final decision is always yours.
---
Please subscribe and leave a comment!
You’ll get new information faster than anyone else.
---
$WDC – Flag Breakout as Memory Sector IgnitesNASDAQ:WDC – Flag Breakout Setup with Memory Prices Surging
Western Digital ( NASDAQ:WDC ) is setting up for a clean flag breakout, and the memory sector is on fire right now — exactly the environment where these continuation patterns work best.
🔹 The Setup:
NASDAQ:WDC has been consolidating tightly, forming a bullish flag just under resistance.
Price is holding above key moving averages, showing constructive digestion after the prior run.
A breakout here could lead to a momentum expansion.
🔹 Sector Tailwinds (This Is Key):
Memory prices are skyrocketing, and the entire group is catching bids.
NASDAQ:MU is leading the charge today.
NASDAQ:SNDK is also breaking out, confirming broad-based strength across the memory space.
When multiple names in the same group break out together, follow-through improves dramatically.
🔹 My Trade Plan:
1️⃣ Entry: Swing on the flag breakout with confirmation.
2️⃣ Stop: Under the 9 EMA zone — tight, logical risk.
3️⃣ Target: Riding sector momentum — trail stops if the trend accelerates.
Why I Like This Setup:
Clean technical structure + strong sector confirmation.
Memory stocks tend to move in packs — when one goes, others follow.
Risk is clearly defined, upside is open if the cycle continues.
I WILL TRADE THIS 1/3 SIZE very low risk due to the market itself still being shady. We are seeing a lot of stocks pop and drop so i want to really get a feel for the market.
Will not enter NASDAQ:WDC till the close to see if it holds up and how the market is behaving on the ffirst day of 2026
WDC - Revisiting the ChartIn the previous idea, we didn’t see a deep correction at the designated targets; the chart moved upward.
Let’s look at what could happen next. So far, only the 3rd wave is complete, and we’re now drawing the 5th wave to finish the move. The correction looks like a running flat .
We can’t be completely certain about the exact point where the correction ended, so the final scenario isn’t clear. Still, we’ll focus on the most likely scenario. Unlike Sandisk, where the chart is straightforward, here things are less obvious
Key targets to complete the movement: 210 and 241 (possibly higher).
Less likely scenario:
With 210 already reached, the movement is complete. The correction is wrapping up, and then the price is expected to drop.
More likely scenario:
Heading towards 241 .
The movement after the correction overlaps the first wave - this happens in a fifth wave, which means we are drawing a wedge (ending diagonal).
Alternative scenario:
Heading well above 241 .
Conclusion:
Most probable target for completing the movement: 241
Pattern of the movement: wedge .
---
Please subscribe and leave a comment!
You’ll get new information faster than anyone else.
---