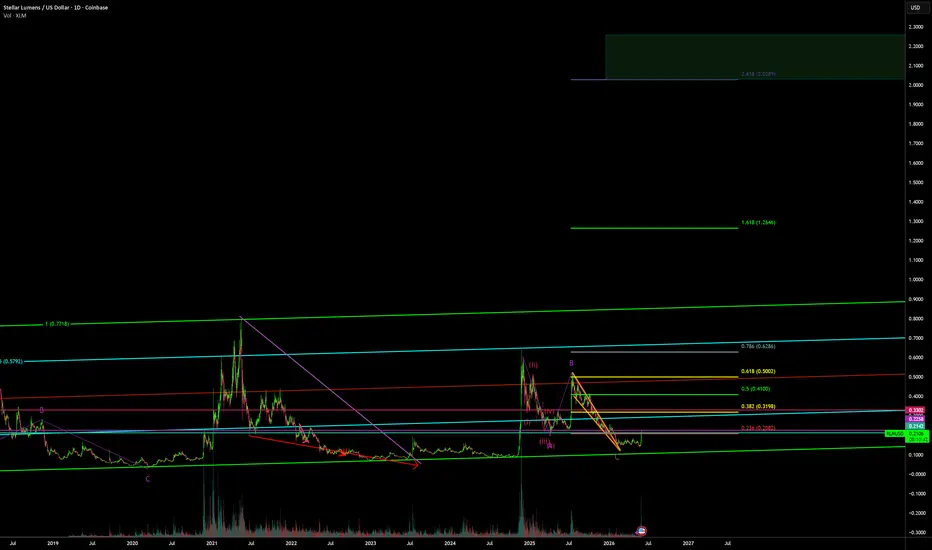
Stellar Lumens: LowerXLM recently came under renewed selling pressure, although some downside room remains in the immediate term. Once the altcoin turns higher just above the support at $0.13, we expect it to advance beyond the resistance at $0.29. We then primarily anticipate a sell-off into our green Target Zone between $0.13 and $0.07. Within this range, we expect XLM to complete the downward movement that has been unfolding since 2018 and establish a major bottom, paving the way for a higher-degree reversal to the upside. However, XLM could break below the support at $0.13 more or less directly and reach our green Target Zone between $0.13 and $0.07 sooner than projected. We assign this scenario a probability of 39%.
In-depth trading ideas
XLM, an important one- Follow- NC HAMMER CRYPTO on all platformsIf you’ve been following along for the past year and a half, I’ve been covering XRP, XCN and XLM almost daily while referencing BTC for movements. Follow me on all platforms for up to date TA on many different cryptocurrencies.
Become a MEMBER get new coins before they take off, as well as coin requests covered. Many members have joined and profited over $700 within 4 days of being a MEMBER— keeping in mind 50% of all MEMBERSHIPS go to save animals lives. Invest $10 in your education, no $3000 courses, no BS or hype just TA day after day on where this market is going
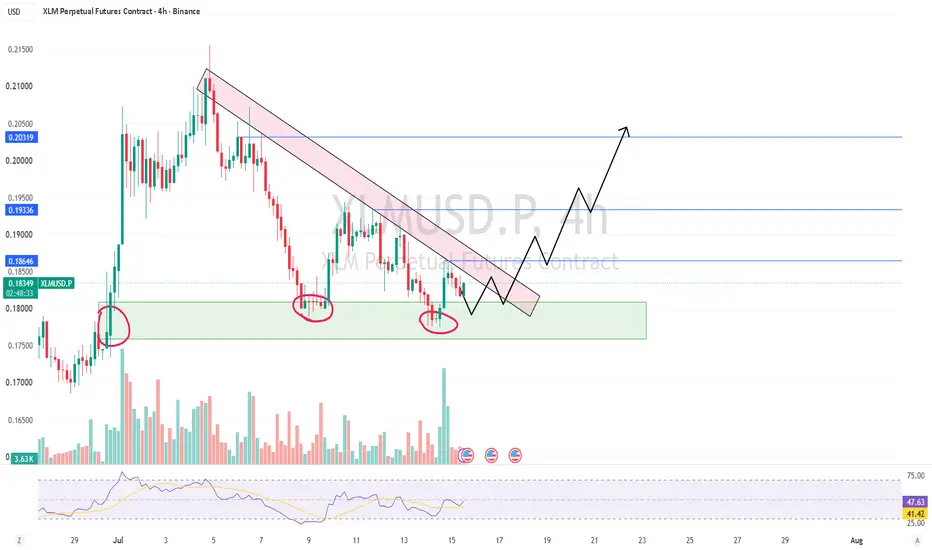
$XLMUSD Looks Ready for a Reversal? XLM Looks Ready for a Reversal? 👀
After testing the same demand zone multiple times, XLM continues to show signs that buyers are defending this area. Every revisit has been met with buying pressure, which is exactly what we want to see before a potential trend reversal. At the same time, price is still trading inside a descending trendline, so this level remains the key obstacle.
A confirmed breakout above the trendline, followed by a successful retest, would significantly strengthen the bullish case. If that happens, the next upside targets are around 0.186, 0.193, and 0.203. Until then, patience is important because the setup is still waiting for confirmation.
Bullish confirmation checklist:
✅ Demand zone continues to hold.
✅ Strong candle closes above the descending trendline.
✅ Breakout is supported by increasing volume.
✅ RSI continues strengthening above the mid-level.
Is the Downtrend Over? Not Yet, Says the ChartThe overall technical picture remains bearish, with sellers continuing to hold the advantage. While the recent price action suggests that selling pressure has slowed, there is currently no convincing evidence of a trend reversal. Unless buyers can reclaim key resistance levels with strong volume and establish a higher high, the prevailing downtrend is likely to remain intact.
XLM. Days after DTCC.a classic global three-point channel with multiple mid-channel touches during the formation period, indicating validity and extremes that serve as points of attraction and determine the medium-term trend
locally, the price forms an equilateral triangle with possible price exits in both directions, however, the empirical priority downwards remains - through a false breakout, an exit to the top of the channel
the reference points for assessing the probable downward movement are the previous sideways movement and, as a result, the probable decline may amount to 20%
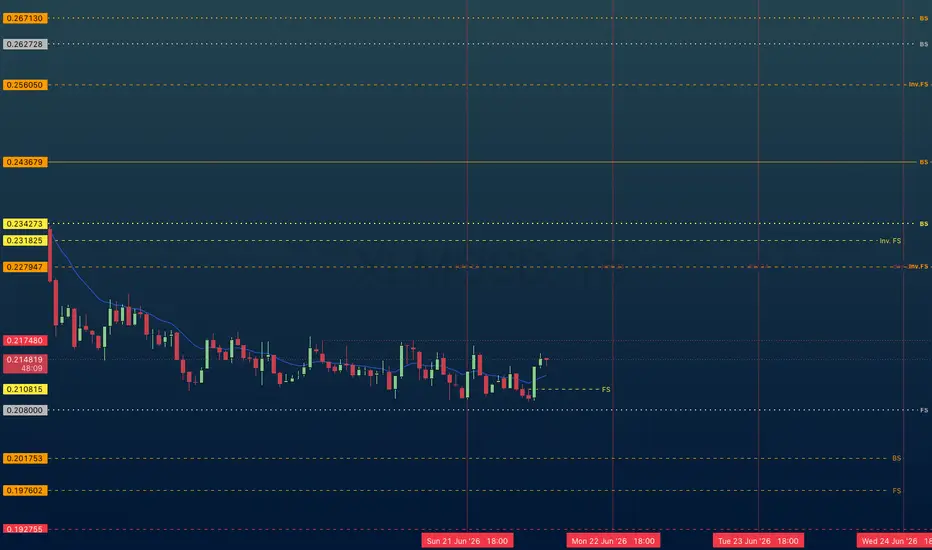
XLM | 1hr chart | June Q2Multiple Time-Frame Analysis; Color Code | Strength favors the higher timeframe.
Yearly timeframe = black
Monthly timeframe = pink
weekly = grey
daily = red
4hr = orange
1hr = yellow
15min = blue
5min = green if they are shown. (Level visibility on intervals is set to timeframe the level was found on and below to keep chart view organized.)
** Candle Science explained **
A Range = two or more consecutive color candles.
There are two types of ranges - accumulation and distribution.
DISTRIBUTION RANGES DEFINED: BackSide (BS) Candle - First distribution candle in a distribution range. Expectation = strong reaction to price. long wicks reaching to or away from level.
FrontSide (FS) Candle - Last distribution candle in a distribution range. Expectation = reversal, create a trend in the opposite direction. Distribution candles are used as support.
ACCUMULATION RANGES DEFINED:
Inverse BS (Inv.BS) - First Accumulation candle in an accumulation range. Expectation. = strong reaction to price. long wicks reaching to or away from level.
Inverse FS (Inv.FS) - Last accumulation candle in an accumulation range. Expectation = reversal, create a trend in the opposite direction. Accumulation candles are used as resistance.
Horizontal Ray tool on BS & FS levels are default support levels when dashed lines, tested when dotted lines and resistance when solid lines.
Horizontal Ray tool on Inverse BS & Inverse FS levels default as resistance and shown with a dashed line, tested when 1x dotted line, and support when solid line.
The inverse is true for the Inv. BS Inv. FS levels, they are resistance as dashed lines, tested as dotted and support as solid lines.
XLMUSD LONG — 30m Bullish Continuation Setup | 2R PotentialXLMUSD LONG — 30m Setup
Time: 2026-06-21 12:00 UTC
Entry Zone: Around 0.2135
Stop Loss: Around 0.2085
Take Profit: Around 0.2235
Setup Reason: XLMUSD is showing potential short-term strength around the entry area, with buyers defending the lower zone. The setup is based on a possible bullish continuation toward the next resistance/liquidity area.
Invalidation: A 30-minute candle close below 0.2085 would invalidate the long setup.
Risk/Reward: Approx. 2.0R, depending on exact entry.
Educational trade idea only. Not financial advice.
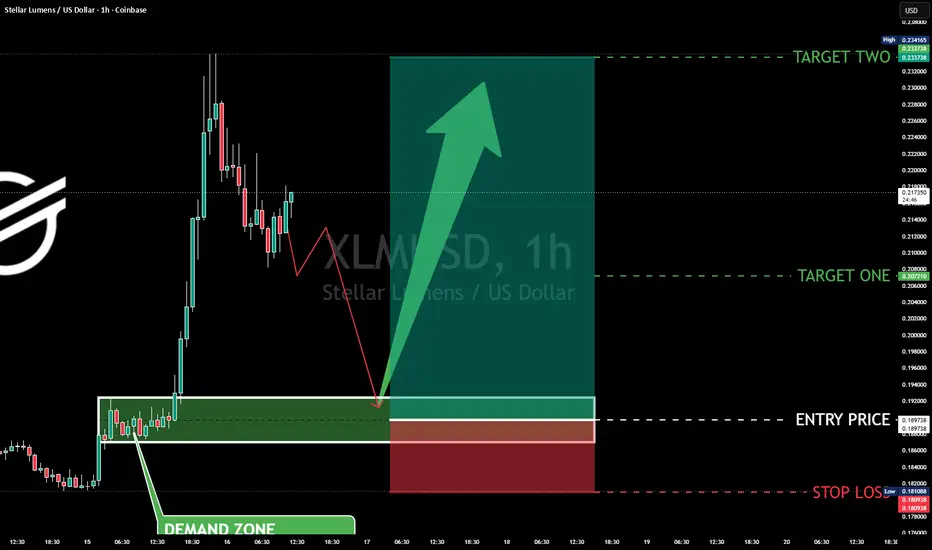
$XLM is trading at $0.2172 right now — but the real trade....🔥 BINANCE:XLMUSDT is sitting at $0.2172 right now — but patient traders aren't touching it yet. The real entry is ~10% lower, and most people will either chase here or panic when it drops. Don't be either.
📰 24H NEWS SNAPSHOT
SEC approved a T. Rowe Price active crypto ETF that can hold XLM— a major institutional signal. 24H volume spiked 423% to $932M, suggesting that accumulation interest is growing.
📊 MARKET BIAS: Bullish on Pullback
Structure is intact — waiting for price to fill the demand zone before any entry is valid.
🎯 TRADE LEVELS
📍 Entry Zone: $0.1924 – $0.1870 ← set limit orders here
🛑 Stop Loss: $0.1811 (-4.5% | Risk: 1–2% of portfolio max)
🎯 TP1: $0.2071 (+9.2% | 2:1 RR)
🎯 TP2: $0.2337 (+23.2% | 5:1 RR)
📐 Overall R:R: Up to 5:1
🧠 CHART ANALYSIS
The 1H chart shows a sharp drop from $0.240 that created a strong demand zone between $0.1924–$0.1870.
Price is currently at $0.2172 — still above the zone. The setup calls for a continuation drop into that demand zone, a bounce, and then a move through TP1 at $0.2071 toward TP2 at $0.2337.
Invalidation: any 1H close below $0.1811 cancels the setup entirely.
🛡️ RISK MANAGEMENT
Do NOT enter at current price ($0.2172).
Set your limit orders at $0.1897–$0.1924 and walk away.
Chasing entries above the zone destroys your R:R ratio and turns a 5:1 setup into a coin flip.
📚 EDUCATIONAL NUGGET
This is called a "set and forget" limit order strategy — you map the zone in advance, place your order, and let the price come to you.
The biggest edge in trading isn't analysis. It's discipline to wait for your price.
Where's your limit order set? Drop it below 👇
#XLM #Stellar #CryptoTrading
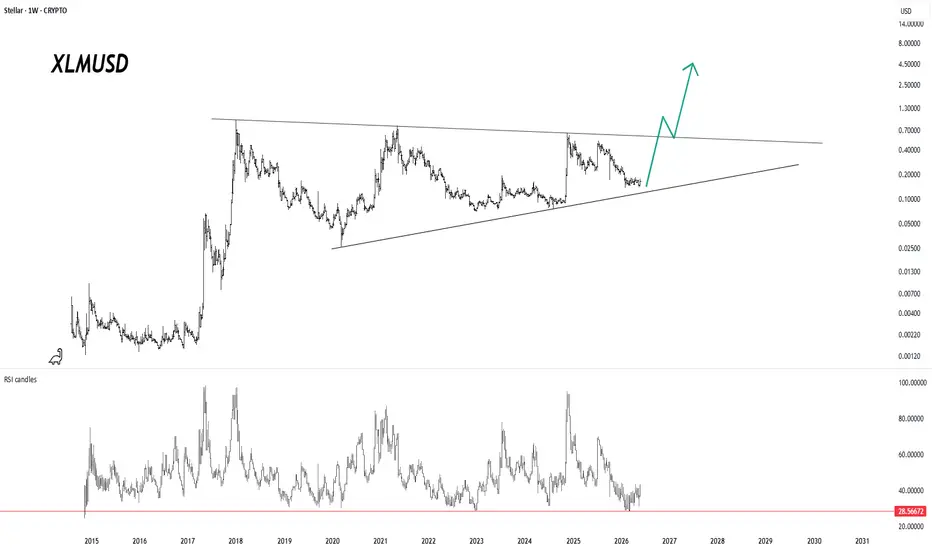
XLM/USD The Compression Nobody Is Watching XLM is not interesting because the crowd is excited.
It is interesting because the chart is still alive while almost nobody cares.
This is exactly the kind of structure most people ignore until the breakout already becomes obvious.
XLM/USD has spent years inside a large compression range.
The upper side of the structure has rejected every major expansion attempt since the previous cycle.
The lower side has continued to rise quietly, creating a long-term squeeze between falling resistance and rising support.
That is the entire chart.
Not hype.
Not confirmation.
Compression.
The important part is that price is no longer collapsing freely. It is moving inside a narrowing structure, and the current zone is close to the lower side of that structure.
If the lower support continues to hold, the next meaningful question becomes simple:
Can XLM return to the upper resistance line?
And if that resistance finally breaks, the structure changes completely.
The RSI structure also fits the same idea. Momentum is not euphoric. It is not overheated. It is closer to a reset / rebuild zone after a long period of weakness.
That does not mean the move starts immediately.
But it does mean the chart is no longer only a dead chart.
It is a compression chart.
The crowd usually waits for the breakout candle.
The structure usually appears before the crowd returns.
For now, the map is simple:
Support holds → compression continues.
Upper line breaks → market structure changes.
Support fails → the thesis weakens.
XLM is still in the “prove it” zone.
But this is exactly where ignored charts should be watched carefully.
XLM/BTC weekly
XLM. DTCC.it feels like I haven't been here for so long and last year seems like a distant, distant era where we all wanted to be wealthy but every cryptocurrency investor is ignorant and any trading idea should not be taken as financial advice
time goes on, and I still like charts, investing, and curiosity pushes me to take the next step, but only with a new understanding of things (I think) - that's why I'm still here, analyzing the chart, and my goal is still to make gains! today, I'm focusing on Lumens and Stellar blockchain, because it seems to me that everyone was led by the nose a few years ago and most of the market here is in negative values.. I don't take it upon myself to admit the ultimate truth, I'm simply thinking and drawing charts based on my own position regarding world events and therefore investing
at the moment, my portfolio consists exclusively of tokens on the Stellar blockchain, the tickers of which I will not disclose - from now on, I will only provide general information regarding the blockchains in which I invest, and maybe later, if specific targeted investments turn out to be positive, I will talk specifically about them
Lumens is currently experiencing an upward trend, but as always (as we have learned from cyclicality), the price may drop to the middle of the channel during the summer while everyone here is fill bags BUT sell in may and go away?... is this the case this time?
everyone is sticking to their own strategy and it can't be revealed
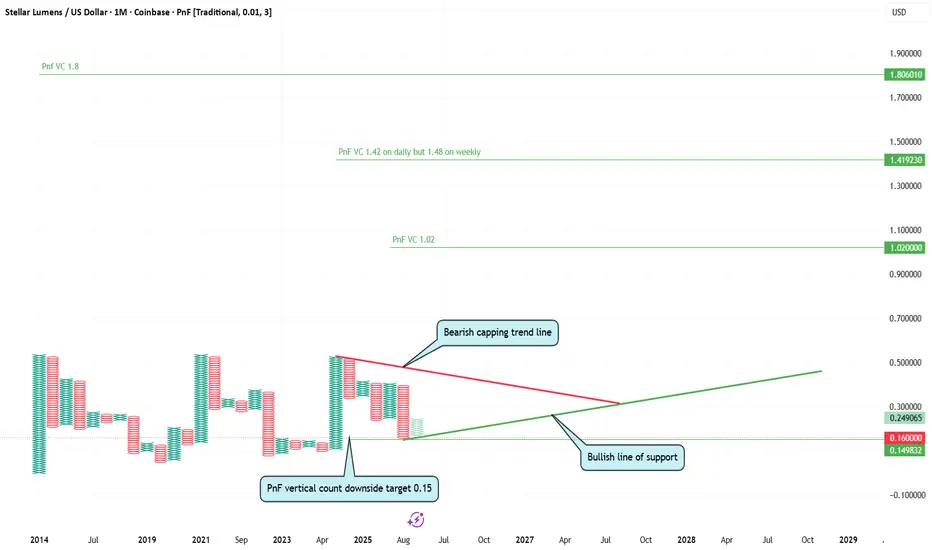
XLM PnF Point and Figure targets XLM Point & Figure Targets and Bull Market Outlook
Below are the current Point & Figure (PnF) targets for XLM.
The expectation is that price will eventually move higher and reach one of these PnF targets. For that to happen, it would likely need to coincide with the next major cryptocurrency bull market. There is also the possibility that XLM becomes one of the early leaders of the next cycle.
Traditionally, crypto markets have followed a four-year cycle, and the next strong phase should begin later this summer. However, several indicators I follow suggest that the bull market may already be underway. My working assumption is that the previous cycle was relatively muted on both the upside and downside compared with historical norms.
This may be slightly early, but the move off the lower target was very strong. Hopefully it proves to be the start of a genuine trend rather than a short-lived rally driven purely by recent news.
If trillions of dollars eventually flow into the crypto sector, some projects will experience substantial appreciation. The growth of tokenisation, where ownership can be fully verified rather than obscured through rehypothecation, could become a transformational development. What looks like a small seedling today could eventually grow into an oak tree.
Historically, both XLM and XRP have been viewed as the "bankers' coins." XRP performed strongly during the last cycle, rising approximately sixfold relatively early in the move. XLM, by comparison, has been largely dormant. This raises the possibility that XLM could be one of the remaining major cryptocurrencies yet to have its turn. Its long-term chart resembles a coiled spring or triangle formation, suggesting significant potential energy waiting to be released. That is what the charts are currently indicating.
One important point to remember is that Point & Figure analysis does not provide timing. It can indicate where price may eventually travel, but not when the move will occur.
At present, I believe XLM has bounced from the active downside PnF target around $0.15.
Point & Figure analysis identified this level very effectively.
Looking at other charting methods, my 360-degree analysis of XLM showed a break below the supporting BAGL (Basing Ascending Grind Line), which is an upward-sloping trendline. Price briefly moved below this line before quickly reclaiming it, suggesting buyers stepped in to support the market. Shortly afterwards, a positive announcement was released and the price accelerated higher.
On the ratio chart, (not shown here) I calculated a potential 100x move from this week's low. While that sounds extraordinary, it is important to understand that this is a ratio chart. It does not imply that the actual price of XLM will rise by 100x. Instead, the ratio chart is intended to help identify when it may be time to exit a long position after the next crypto bull market has run its course. In any case that chart supports this view too, but cannot easily be shown as a PnF chart.
For the bullish thesis to remain valid, price needs to stay above the green trendline.
You can also see what is effectively a triple-top formation developing. If price breaks above this level, it would trigger another Point & Figure triple-top breakout signal and generate a new upside target. If and when that occurs, I will return and update the analysis with the new target.
Good luck out there trading guys may the market carry on giving us munificent gifts
please share the knowledge and help as many people as we can!
Built For This MomentOn May 27, 2026, the Depository Trust & Clearing Corporation — the backbone of US capital markets, processing $4.7 quadrillion in securities transactions annually and holding $114 trillion in custody — announced it would tokenize DTC-custodied assets on the Stellar network, targeting H1 2027 deployment. The working group includes BlackRock, Goldman Sachs, JPMorgan, Morgan Stanley, and Bank of America. This is not a pilot. This is Wall Street choosing its rails.
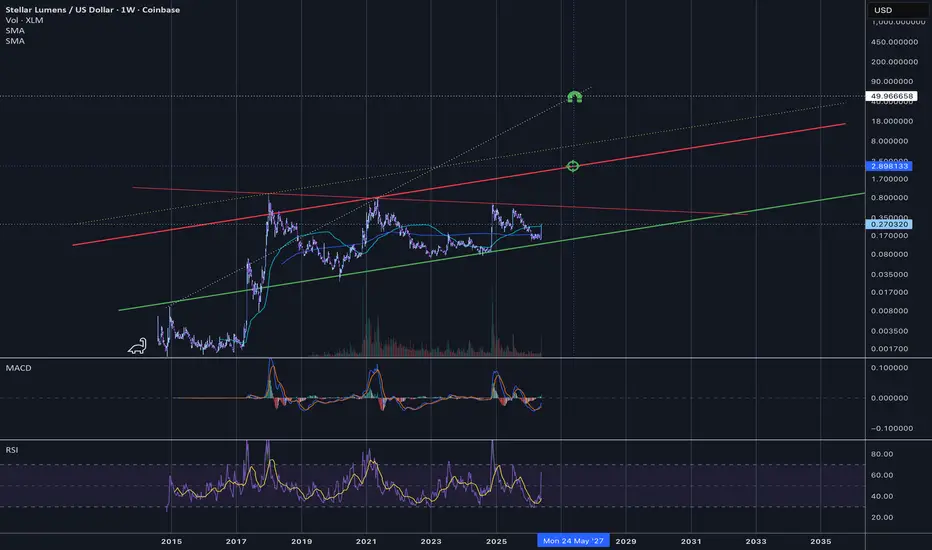
XLM responded with an 80%+ candle in a single week, breaking out of a multi-year compression pattern. The chart is set up for two targets: $2.90 at the red upper channel boundary, and $50 at the outer dotted macro extension — both within the 2027 window as the DTCC integration goes live. The quantitative model below shows why those targets may be deeply conservative.
The Origin Story Most People Forget:
Stellar was not built from scratch. It was created by Jed McCaleb, co-founder of Ripple, using the same foundational codebase that powers XRP — the fastest, lowest-cost settlement protocol in crypto. The original DNA is the same: sub-5-second finality, fractions-of-a-cent fees, and a consensus mechanism built for institutional-grade financial infrastructure, not consumer speculation.
Where Ripple went enterprise-first with a closed partner network, McCaleb took the same engine and built an open, permissionless, compliance-first public chain. A decade of quiet, deliberate development for exactly one purpose: to be the settlement rail that regulated finance could actually use.
Stellar Development Foundation CEO Denelle Dixon said it herself on the day of the DTCC announcement: "Our network was built for this moment."
She was not wrong.
Why DTCC Chose Stellar Over Everyone Else
DTCC's selection criteria were explicit: compliance-minded architecture, transaction throughput, low-cost operations, and proven track record with institutional assets onchain. Ethereum was passed over entirely. Solana was passed over. The SEC's December 2025 No-Action Letter authorizing DTCC's tokenization service specifically requires that token movement be restricted to registered wallets — a capability Stellar handles natively at the base layer because tokens are first-class primitives on the network, not smart contracts bolted on top. DTCC can force token transfers or burns in cases of fraud or error. You cannot do that on Ethereum.
The other network DTCC selected was Canton — a private, institution-only L1. For the public blockchain leg of the world's most important tokenization program, they chose Stellar.
The Quantitative Case: How Do You Price $4.7 Quadrillion?
Using the Equation of Exchange (MV = PQ), we can model what XLM must be worth if Stellar captures a meaningful share of DTCC's settlement flow:
Required XLM Price = (DTCC Volume × Stellar Share × Net Settlement Rate) ÷ (Velocity × Circulating Supply)
The two most critical variables in this model:
1. Net Settlement Rate — DTCC processed ~$4.7 quadrillion gross in 2025, but nets approximately 98% of trades before final settlement. Only the residual actually needs to move on-chain. This single assumption swings the price estimate by orders of magnitude.
2. Stellar's Share — DTCC's stated strategy is building across multiple L1 and L2 networks, with Canton already handling Treasuries and Chainlink handling orchestration. Stellar will not get 100% of the flow.
Three Scenarios:
► Conservative — 5% Stellar share, 2% net settlement rate, velocity 200
→ Required XLM price: ~$7.83 (~46× from $0.17)
► Base Case — 15% Stellar share, 5% net settlement rate, velocity 100
→ Required XLM price: ~$117.50 (~691× from $0.17)
► Aggressive — 30% Stellar share, 10% net settlement rate, velocity 50
→ Required XLM price: ~$940 (~5,500× from $0.17)
Important caveat: XLM fees are 0.00001 XLM per transaction. Even at a billion daily transactions, fee-driven demand is negligible (~$170/day). The price thesis lives entirely in the velocity/collateral model, not fee burns. XLM must be held as working capital to settle transactions — the higher the volume flowing through Stellar, the more XLM must be locked in motion at any given time.
The $50 chart target corresponds roughly to a conservative-to-base scenario. The $940 scenario is the aggressive case but requires only 30% share and 10% net settlement — neither assumption is outlandish if Stellar becomes the dominant public chain leg of DTCC's infrastructure.
The Macro Setup
The weekly log channel has contained every major move in XLM's history. Price is breaking out of the lower bound of the inner channel after a multi-year base, MACD histogram curling from deeply negative territory, RSI at ~62 confirming early expansion phase. The god candle off the DTCC announcement is the first structural confirmation that the market is beginning to price this thesis.
Fundamental Accelerants:
• DTCC limited production trades begin July 2026, full commercial launch October 2026
• Stellar integration live H1 2027 — Russell 1000 stocks, major ETFs, US Treasuries
• $2B+ in tokenized RWAs already on Stellar as of Q1 2026, up 72% YoY
• GENIUS Act (stablecoins) and CLARITY Act (market structure) both accelerate institutional onchain adoption
• XLM has been processing real cross-border payments for a decade — not a new chain with a promise, an operational network getting a $114 trillion volume mandate
Targets: $2.90 (red channel) → $50 (outer extension) → $940 (aggressive MV=PQ scenario)
Invalidation: Weekly close back below the green channel lower rail negates the breakout.
Not financial advice. Technical analysis and quantitative modeling only.
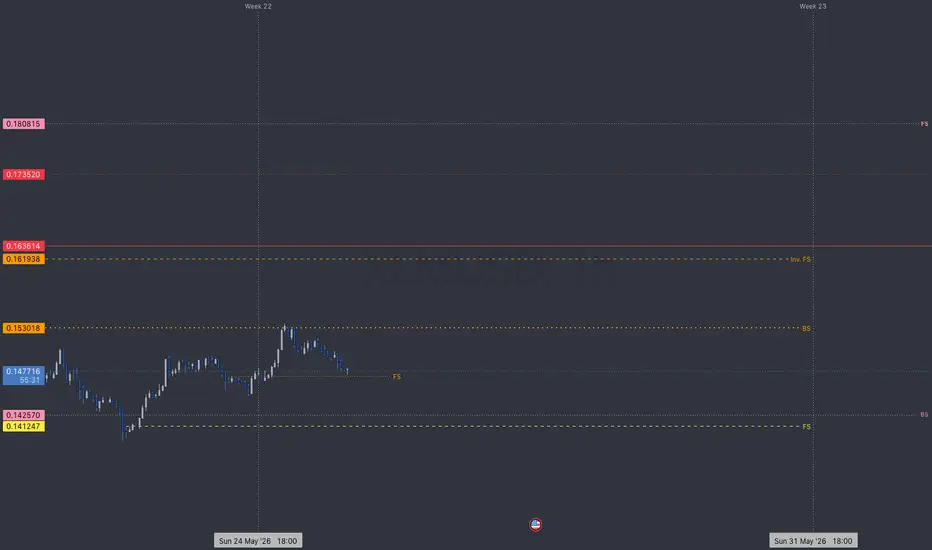
XLM | Week 22 | 1hr Chart-------------------------
Multiple Time-Frame Analysis; Color Code | Strength favors the higher timeframe.
Yearly timeframe = black
Monthly timeframe = pink
weekly = grey
daily = red
4hr = orange
1hr = yellow
15min = blue
5min = green if they are shown. (Level visibility on intervals is set to timeframe the level was found on and below to keep chart view organized.)
** T.A explained **
A Range = two or more consecutive color candles.
There are two types of ranges - accumulation and distribution.
DISTRIBUTION RANGES DEFINED: BackSide (BS) Candle - First distribution candle in a distribution range. Expectation = strong reaction to price. long wicks reaching to or away from level.
FrontSide (FS) Candle - Last distribution candle in a distribution range. Expectation = reversal, create a trend in the opposite direction. Distribution candles are used as support.
ACCUMULATION RANGES DEFINED:
Inverse BS (Inv.BS) - First Accumulation candle in an accumulation range. Expectation. = strong reaction to price. long wicks reaching to or away from level.
Inverse FS (Inv.FS) - Last accumulation candle in an accumulation range. Expectation = reversal, create a trend in the opposite direction. Accumulation candles are used as resistance.
Horizontal Ray tool on BS & FS levels are default support levels when dashed lines, tested when dotted lines and resistance when solid lines.
Horizontal Ray tool on Inverse BS & Inverse FS levels default as resistance and shown with a dashed line, tested when 1x dotted line, and support when solid line.
The inverse is true for the Inv. BS Inv. FS levels, they are resistance as dashed lines, tested as dotted and support as solid lines.
XLM stellar. The new monetary system infrastructure. Fundamentally assuming stellar is the rails for the next monetary system based on its partnership with DTCC and also evidenced by Bermuda putting its whole economy on the stellar blockchain, expect exponential bullish thrusts. 4.7 quadrillion settled with dtcc and custodies over 115 trillion from 150 countries.
2. Technically, full 1st wave correction complete and ready for wav 3 mega thrust to top of fib extension at around $2. And that's just to start. :)
3. This is the only blockchain that matters. Everything else is a decoy and distraction for the normies.
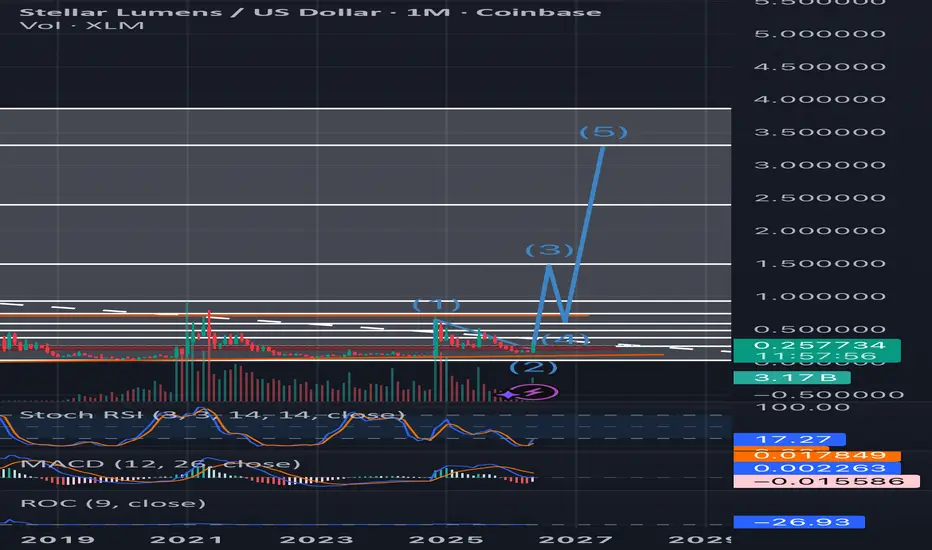
Stellar (XLMUSD): Bullish Triangle Structure Nearing Completion?Stellar (XLMUSD) has been trading sideways for the past eight years, which appears to represent a large-scale consolidation within a bullish ABCDE triangle pattern as part of wave IV, before a potential continuation of the broader uptrend into wave V.
Such triangle structures are typically terminal corrective formations that resolve in the direction of the prevailing higher-degree trend once completed. In this context, the potential completion of wave E may be signaling the end of a prolonged consolidation phase and the early stages of a new impulsive bullish cycle.
Triangles in Elliott Wave theory are corrective structures composed of five overlapping waves labeled A–B–C–D–E. They typically form in wave 4, wave B, or wave X positions and represent a period of consolidation where price contracts or broadens within converging trendlines. Each sub-wave is corrective, and momentum generally fades as the pattern develops, often accompanied by declining volume and increased choppiness. Triangles usually resolve in the direction of the larger trend, with the final breakout often leading to a strong impulsive move once wave E is completed.
$XLM Long - Important BreakoutSignal: Long
Price: 0.203
Price has produced a strong breakout candle, rising sharply above the full moving-average stack: 20 EMA ~0.15795, 50 EMA ~0.1593, 100 EMA ~0.1686, and 200 SMA ~0.19649. The breakout has also pushed price above the upper Bollinger Band, showing a major volatility expansion and strong bullish momentum. The ADX is around 18.50, which suggests trend strength is starting to build, while +DI at 49.72 is far above -DI at 9.61, confirming that buyers currently dominate directional pressure. Although price is short-term extended after the large candle, the technical structure favors continuation higher as long as XLM holds above the reclaimed 200 SMA and does not immediately fall back into the prior range.
Stellar (XLM) is showing increasingly strong fundamentals as real-world adoption accelerates, led by over $2 billion in tokenized real-world assets on-network and $5.5 billion in Q1 2026 payment volume, alongside a 72% year-over-year rise in transaction activity and an 86% increase in developer participation—signals of broadening, non-speculative usage. Institutional momentum is also building through high-impact partnerships, most notably a DTCC tokenization collaboration aimed at connecting the global securities processing giant to Stellar by 2027, complemented by integrations spanning Visa for stablecoin settlement flows, Franklin Templeton for tokenized Treasuries, and Bermuda’s sovereign digital dollar pilot with Circle and Coinbase. At the protocol level, Soroban smart contracts, Protocol 25 privacy enhancements, and emerging zero-knowledge capabilities are expanding the platform’s addressable market across DeFi, RWAs, and CBDC-related rails, while the post-2019 reduced supply near 50 billion XLM adds a scarcity tailwind as fee demand and bridging utility increase—together reinforcing the case for sustained network effects and ecosystem expansion.
XLM/USDI think we are at an important time in the history of the crypto market and this opportunity will not come our way for many years. For example, Stellar has been in an 8-year time and price correction since it hit its high in January 2018. After 8 years, I think the corrective wave is complete and ready for a price explosion. As can be seen in the chart, wave e of the triangle is completing. The price targets are indicated on the chart. Finally, it should be noted that all analyses are personal opinions and I am not responsible for your buying or selling. Thank you for your attention.
Stellar XLM Ascending Triangle XLM has been in a rising bull market with big dips. The last 3 parabolic rises (tops) and Earth shattering dumps have formed an ABCDE Ascending Triangle. Fibs measured with trend base fib tool (blue & white circles) for more confluence with higher and lower time frames.