XLM Looks Super Bullish (1H)The price continues to form bullish swings nicely, while buy orders are being collected around the current structure. The recent price action also shows that a liquidity pool has been swept and collected, which can support the continuation of the bullish move if the structure remains intact.
As lon
Compare with XLM/UST
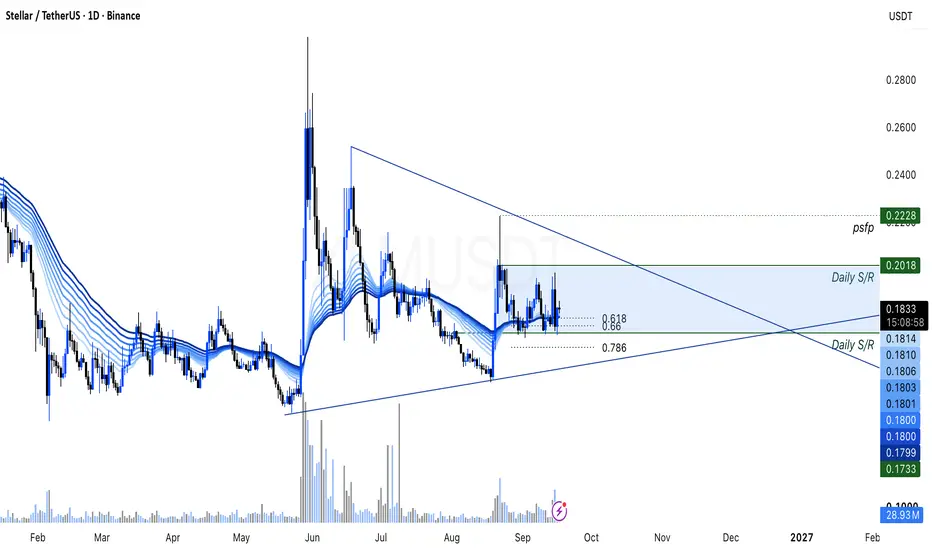
XLM Price Equilibrium, Breakout Incoming ?XLM price action continues to trade within a high-time-frame equilibrium, with neither buyers nor sellers establishing a clear directional breakout. While price remains inside this equilibrium, the current structure suggests that further consolidation may continue before a more decisive move develop
XLMUSDT - BEARISH DIVERGENCE - SHORT POSITIONAnalysis completed on the 1 hour timeframe, with execution on the 15 minute timeframe.
The 1H chart shows bearish RSI divergence, with price making a higher high while RSI makes a lower high, suggesting weakening bullish momentum.
I used a combined indicator incorporating Bill Williams’ Alligator,
XLM LONG — 4H ALMA Setup (WR 75% · avg RR 1.6)BYBIT:XLMUSDT.P · 4H · long only.
(Context: Stellar — cross-border payments / remittance and RWA rails beta on the 4H ALMA Averaging strategy.)
═
█ RESEARCH HUB
Category: Crypto sentiment 68.6 (Greed) — built from 270 locked notes (136 constructive / 42 risk-off / 64 mixed); ticker verdict
Stellar (XLM): Easy 165% followed by 300%+ at $0.80This is the same chart setup that we've been tracking for months—nothing changes. This is a powerful setup with extremely high bullish potential.
XLMUSDT (Stellar) has been sideways within the same price range for 11 months. More like 7 months since February 2026, but the main low and activation of
XLM Looks Bullish (1H)A double combination appears to have completed on the XLM chart. It looks like a Diametric and a Triangle have both been completed.
From the green zone, the price could move toward the targets marked on the chart.
A 4-hour candle close below the invalidation level would invalidate this analysis.
xlmusdt longInstructions:
Entry point: yellow
Stop loss: red
Take profit: green
👉Leverage x 5-10-20 for crypto
👉Leverage x 20-50-100 for commodities, stocks, indices, and forex
👉Margin 1-5% max.
Always practice risk and money management.
Invest a maximum of 5% on any trade or across all your trades.
Invest on
See all ideas
Summarizing what the indicators are suggesting.
Oscillators
Neutral
Oscillators
Neutral
Summary
Neutral
Summary
Neutral
Summary
Neutral
Moving Averages
Neutral
Moving Averages
Neutral
Displays a symbol's price movements over previous years to identify recurring trends.
Frequently asked questions
The current price of XLM / UST (XLM) is 0.21635000 USDT — it has fallen −4.60% in the past 24 hours. Try placing this info into the context by checking out what coins are also gaining and losing at the moment and seeing XLM price chart.
XLM / UST price has risen by 17.34% over the last week, its month performance shows a 3.42% increase, and as for the last year, XLM / UST has decreased by −41.39%. See more dynamics on XLM price chart.
Keep track of coins' changes with our Crypto Coins Heatmap.
XLM / UST (XLM) reached its highest price on May 16, 2021 — it amounted to 0.79729000 USDT. Find more insights on the XLM price chart.
See the list of crypto gainers and choose what best fits your strategy.
XLM / UST (XLM) reached the lowest price of 0.07022500 USDT on Dec 29, 2022. View more XLM / UST dynamics on the price chart.
See the list of crypto losers to find unexpected opportunities.
The safest choice when buying XLM is to go to a well-known crypto exchange. Some of the popular names are Binance, Coinbase, Kraken. But you'll have to find a reliable broker and create an account first. You can trade XLM right from TradingView charts — just choose a broker and connect to your account.
Crypto markets are famous for their volatility, so one should study all the available stats before adding crypto assets to their portfolio. Very often it's technical analysis that comes in handy. We prepared technical ratings for XLM / UST (XLM): today its technical analysis shows the buy signal, and according to the 1 week rating XLM shows the buy signal. And you'd better dig deeper and study 1 month rating too — it's neutral. Find inspiration in XLM / UST trading ideas and keep track of what's moving crypto markets with our crypto news feed.
XLM / UST (XLM) is just as reliable as any other crypto asset — this corner of the world market is highly volatile. Today, for instance, XLM / UST is estimated as 4.40% volatile. The only thing it means is that you must prepare and examine all available information before making a decision.
You can discuss XLM / UST (XLM) with other users in our public chats, Minds or in the comments to Ideas.