Zulfiqar and the slay of the dragonAnd here is the double-edged sword—
The one that, if gripped poorly, cuts the very person wielding it.
There is no better tool for dealing with the beast of this world.
They claim to desire freedom, yet fail to account for the weight that comes with it.
If you take up the sword Zulfiqar, ensure you never waver.
Maintain the distance between yourself, evil, and good.
And remember these words on the battlefield:
"In the light of duality, all truths are gray."
In-depth trading ideas
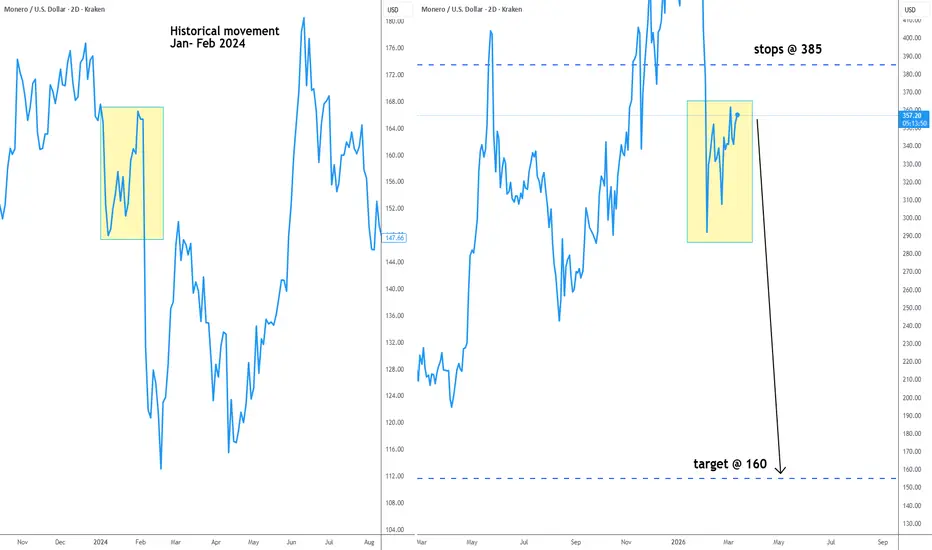
Wednesday Journal Session: Monero ideaThis is actually very interesting after our stop losses were getting hit, I immediately started thinking about this different and how Monero could actually drop back down to the $300 level
Through certain fundamentals I realized XMR was going through some sort of lawsuit phase and they could start receiving rejection back down to the $300 level.
I realize as well sometimes we feel way too early for things and can feel even unprepared.
The market does what it does best, but it can be measured through patterns and human psychology.
Sometimes we can be looking at the chart so technical that we forget to realize. About the fundamentals.
Buy the rumor and sell the news.
See buying the rumor and selling the news is all about knowing that when the rumor first drops we need to realize . . . that there may be a relief rally coming BEFORE the fall.
That's almost every great hero movie by the way!
As a trader when we pay little attention to these things we realized that we could be trading in euphoria and not from a logical standpoint. On how The big money actually moves.
One thing my mentors taught, results ALWAYS tell the story, and a major advantage to your success is knowing your market intimately.
So whatever you're trading make sure. You're looking at both sides and knowing that there are three parts to every situation. Their side, your side, and the truth.
Oh and what people say are the facts are all just speculation and opinion anyways.
Weak Altcoin Choices: Should You Buy $XMR and $ALGO Right Now?Next, we'll check some coins that are showing weak signs. Yesterday, XMR and ALGO were quite good candidates. But today, their chart situation has changed completely.
XMR dropped hard to 385 dollars. It lost an important support level at 400 dollars. Worse, it also fell below the MA200 line.
Monero to go back to lower bullish trend lineBearish now on Monero
The Point & Figure chart shows a vertical count going back to $205
Replaying the bar pattern from the early 2018-->2021 pattern shown in black gives this potential roadmap if history rhymes
This is triggered / activated if price breaks below $327 otherwise this could become an upside target which I will specify later if it happens
XMR | Day Chart** T.A explained **
Multiple Time-Frame Analysis; Color Code:
Strength favors the higher timeframe.
Yearly timeframe = black
Monthly timeframe = pink
weekly = grey
daily = red
4hr = orange
1hr = yellow
15min = blue
5min = green if they are shown. (Level visibility on intervals is set to timeframe the level was found on and below to keep chart view organized.)
Ranges defined
A Range = two or more consecutive color candles (2+ in a row, same color creates a range)
There are two types of ranges - Accumulation Ranges &
Distribution Ranges.
*A single candle is a range on a lower timeframe. Mark the candle and then find the range / level on a lower timeframe aka "Range Finding".
Some people use boxes and call this boxing finding the zone - supply & demand zones - and marking the entire range top to bottom. This is acceptable but introduces risk by increasing probability of orders getting filled.
Candle Science further defines the zone / range into levels. So. after finding a range, identify and label the first and last candle of the range.
This is Candle Science. Everything has a default expectation and users thinking is guided by IF/THEN statements.
Below are the default expectations for each range and the first and last candle within the range.
DISTRIBUTION RANGES:
When price is above a distribution range its default expectation is to support price accumulation.
The first distribution candle in a distribution range is labeled as the BackSide Candle (BS).
Expectation = strong reaction to price. Look for price action to create long wicks reaching to or away from level. A steep angle trend is expected to form so Fair Value Gaps are expected to form on the timeframe of the level and lower timeframes.
If a steep angle trend is not forming, and long wicks are not being created then the idea is that liquidity is not there, confidence in the level is low. Price Action may then be looking for more liquidity to and seek it out at the FrontSide Candle.
FrontSide (FS) Candle = The last distribution candle in a distribution range.
Expectation = create a low angle accumulation trend reversal.
3 bar reversal patterns laddering up
like the distribution candles are the rungs of an accumulation ladder. price uses the top side of the BackSide Candle or the top side of the FrontSide Candle as support. They are used in bull flags to break distribution trends.
IF price fails to gain a BackSide or FrontSide level THEN they act as RESISTANCE. But we will then train our eyes to look at the bottom side of Accumulation Ranges because they have a default expectation as Resistance.
When Price is below an accumulation candle, the bottom side of the accumulation candle is the level of resistance.
ACCUMULATION RANGES DEFINED:
Inverse BackSide Candle (Inv.BS) = the first accumulation candle in an accumulation range.
Expectation. = strong reaction to price. long wicks reaching to or away from level. Creates a steep angle distribution trend. Usually create F.V.G's and impulsive, volatile moves like the BackSide Candle.
Inverse FrontSide Candle (Inv.FS) = The last accumulation candle in an accumulation range.
Expectation = reversal, create a low angle distribution trend. The bottom side of the accumulation candles are used as resistance levels.
TOOLS USED:
Boxes - used to define a zone by marking the entire range (if its small) or just one entire candle or just the wick of the candle to define the zone.
Horizontal Ray tool - used to define the level.
levels when dashed lines are untested, active level where buyers or sellers are waiting to create a level of interest.
Tested levels are dotted lines. If used, they reference the range and could become Origin levels or R.a.t.s in the future (levels where new trends originate or where traders are using Rejection as A Target to scalp and reverse position - aka stoploss hunters; like the rats they are.
Again the color code:
Yearly timeframe color is Black
Monthly timeframe is color pink
weekly grey
daily is red
4hr is orange
1hr is yellow
15min is blue
5min is green if they are shown.
strength favors the higher timeframe.
Monero testing $320 support as buyers step back in:Current Price: 329.69 (Analysis was generated on Monday Morning)
Direction: LONG
Confidence level: 45%(Very limited YouTube, X, and Reddit sentiment data available. Decision based primarily on technical context showing price near $320 support with bullish web sentiment and resistance at $350.)
Targets
Target 1: 345
Target 2: 360
Stop Levels
Stop 1: 320
Stop 2: 312
Key Insights:
Here's what's driving this setup right now. Monero is trading around $329, sitting just above a clear technical support zone near $320. Several market analyses highlight that level as the key area where buyers tend to step in. When a crypto asset repeatedly holds a support like this, it often signals that accumulation is happening quietly underneath.
What's interesting is the nearby resistance around $350. That's the level traders seem to be watching for a breakout. If XMR pushes through that zone, short‑term momentum traders typically jump in quickly, which could accelerate a move toward the mid‑$350s or even $360 this week.
Another factor worth mentioning is Monero's unique positioning in the crypto market. Privacy‑focused assets often move independently from the broader altcoin crowd, especially when traders rotate into niche sectors during market consolidation.
Recent Performance:
XMR has been moving steadily higher over the past year and remains up more than 50% on a yearly basis. In the short term, price has been consolidating between roughly $320 and $350. The past few sessions showed small upward pushes from the lower end of that range, which suggests buyers are defending that support area.
This type of tight range often precedes a breakout move. The key question this week is whether buyers can push price toward the upper boundary.
Expert Analysis:
When I look at the broader trader consensus, many market experts highlight the $320 area as the critical support. That's where price has repeatedly stabilized after pullbacks. Several traders also point to the $350 region as the next technical hurdle, which lines up with previous highs and psychological resistance.
Because the current price is much closer to support than resistance, the risk‑reward favors a bullish setup. Entering near support gives traders a relatively tight stop while leaving room for a meaningful bounce toward resistance.
That’s the core reason I’m leaning LONG here despite the limited sentiment data.
News Impact:
The broader crypto market has recently seen renewed momentum across major assets like Bitcoin and Ethereum. When large‑cap crypto starts trending higher, liquidity tends to rotate into established altcoins like Monero shortly afterward.
On top of that, the Monero community remains active and the asset continues to maintain strong trading volume across exchanges. That stability often attracts swing traders looking for technically clean setups.
Trading Recommendation:
Here's my take. With XMR trading just above $320 support, the setup favors a LONG position targeting a move back toward resistance. I'd consider entries in the $328–$332 area with an initial target around $345 and an extended push toward $360 if momentum picks up.
Risk management is key here. A break below $320 would weaken the structure, so stops should sit just below that level. If price holds support, the upside toward resistance offers a solid short‑term risk‑reward profile for this week.
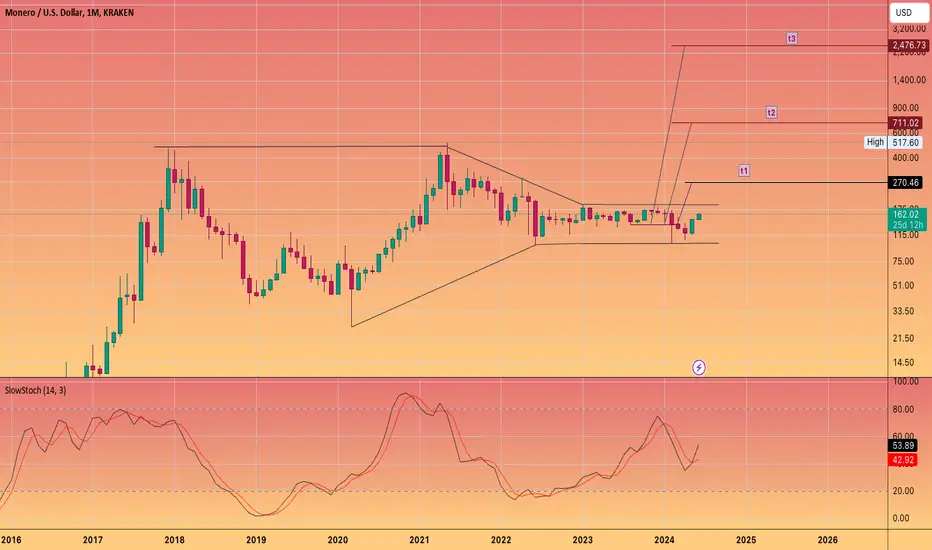
Could Monero make new high?I am wondering and i am sure alot of holders are wondering too!
I believe it has Bullish structure
$187 is the breakout level
That we must monitor very carefully.
The privacy sector in #crypto is abosilutely miniscule compared to #memecoins which totally dwarfs them
Yet privacy is one of the few unique use cases that is very much .. as a system backup..
Fungibility / Privacy is not coming to #Bitcoin anytime soon or ever.
#HVF
@TheCryptoSniper
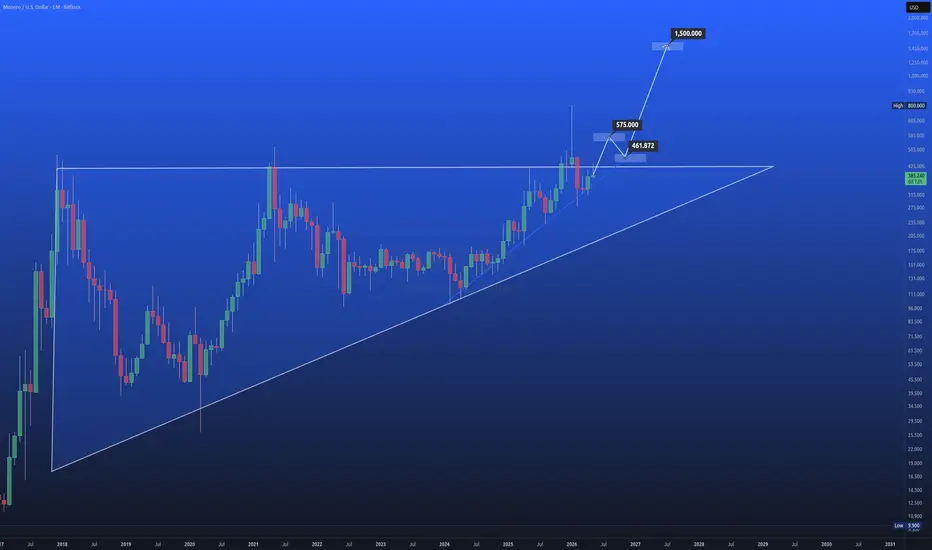
XMR – Mirroring BTC 2017 Structure?🚀
XMR is currently showing a structure very similar to Bitcoin’s price action back in 2017, just before its explosive move.
The market has gone through a long period of consolidation followed by a corrective phase, and is now holding a key support zone — a pattern that closely resembles BTC’s accumulation before its parabolic run.
If this fractal continues to play out, XMR could be positioning for a strong expansion phase in the coming sessions.
📈 Possible scenario:
• Slow grind up → breakout
• Acceleration once resistance is cleared
• Potential for a sharp, momentum-driven move
⚠️ Risk:
• Breakdown below current support invalidates the structure
This is the kind of setup that builds quietly — until it doesn’t.
#XMR #Crypto #Bitcoin2017 #Breakout #TradingView
Monero: "flight to privacy" tradeThe recent Iran war has many thesis HODLers racing to explain, bend, and rewrite their "safe haven asset" theses about Gold, Bitcoin, and stocks.
But what does the actual data tell us about how Monero KRAKEN:XMRUSD performs during market stress events over the last half decade?
Monero has outperformed Bitcoin during every market stress event since the COVID crash.
2025 Tariff War: XMR to 340% of its starting value, tracking Gold's run to ~190%. BTC fell to 65%.
2022 Bear: Gold flat (-1%), XMR fell but outperformed BTC (-41% vs -65%).
XMR behaves like crypto-native gold during stress.
BTC behaves like leveraged NASDAQ.
What happens after fear?
30-day recovery after fear. When VIX > 25, XMR's avg 30-day forward return is +12.1% — nearly double BTC (+7.5%) and 9x Gold (+1.3%). XMR doesn't just survive stress, it snaps back harder than anything else.
"Monero chart looks like Gold"
Correlations actually shift during periods of market stress. XMR = more like gold/BTC = more like stocks.
Takeaways:
-BTC trades like a leveraged stock during stress. XMR doesn't.
-XMR isn't a risk-on coin. It's crypto's flight-to-privacy trade.
-Gold is getting wrecked this time while XMR holds.
XMR - Consolidation Wedge at $348! U.S. Treasury Softens Privacy
What's up traders! 👋
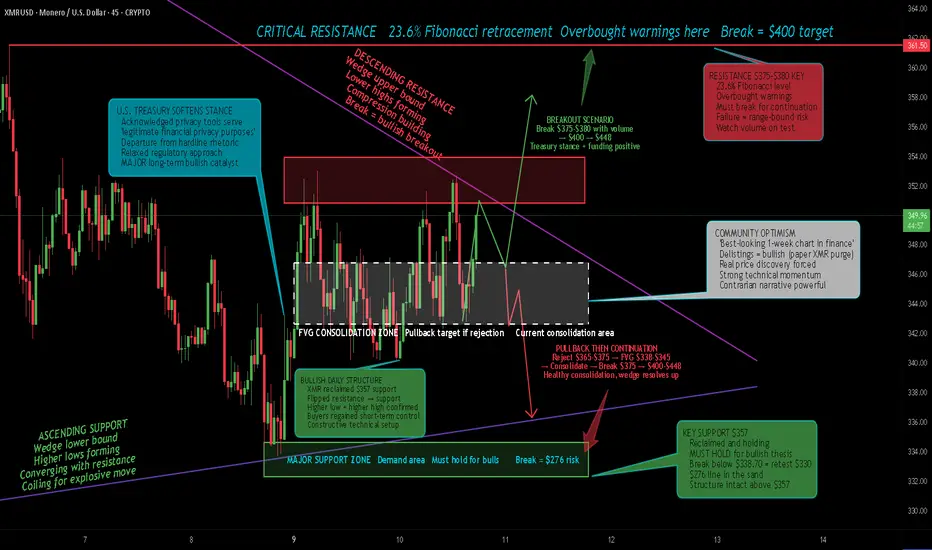
Monero consolidating at $348.81 (+2.34%) in converging wedge pattern. Testing descending resistance (purple) vs ascending support (blue). U.S. Treasury softened stance on privacy (acknowledged legitimate uses for mixers), XMR reclaimed $357 support (bullish daily structure), funding rates positive (traders positioning long). Resistance $365-$375. Two scenarios: breakout above $375 to $400+ OR rejection, retest FVG $338-$345 then continuation. Bullish structure, coiling for move.
The Setup
XMR at $348.81 in converging wedge (purple descending resistance, blue ascending support). Consolidating between resistance $365-$375 (red zone) and support $330-$338 (green zone). FVG zones: $345-$355 (gray). Compression = breakout imminent. Two scenarios: break $375 to $400+ OR reject, pullback to FVG $338-$345, then push to $375-$400.
Key Levels
Resistance: $365-$375 (critical / 23.6% Fib), $380 (confirmation), $400 (psychological), $448 (major)
Support: $357 (reclaimed / bullish structure), $345-$355 (FVG), $338.70 (50% Fib / key), $330 (demand), $276 (line in sand)
News - March 10, 2026 (BULLISH DOMINANT)
BULLISH (DOMINANT):
• U.S. TREASURY SOFTENS STANCE: Acknowledged privacy tools (mixers) serve "legitimate financial privacy purposes" (departure from hardline rhetoric, aligns with relaxed regulatory approach)
• XMR reclaimed $357 support (flipped resistance to support = bullish daily structure confirmed)
• Funding rates POSITIVE (+0.0073%) = traders positioning long, rising bullish sentiment
• Money Flow Index rebounded from oversold (25 → 50) = capital inflows returning
• Awesome Oscillator shrinking negative bars = weakening bearish momentum
• Selling pressure fading (February dump exhausted)
• Community: "Best-looking 1-week chart in finance" (strong technical momentum)
• Delistings seen as BULLISH (purge of "paper XMR", forces real price discovery)
• Network Upgrade 19 (mid-2026) = protocol improvements, efficiency
• Jamtis integration research (long-term) = scalability, user experience upgrade
• Community funding active (CCS) = sustainable ecosystem growth
• XMR +2.34% today, outperforming BTC +1.12% (higher-beta asset)
• Broad market rally (Iran tensions easing, oil crash $119 → $86)
• Strong correlation with S&P 500 (macro-driven move, risk-on sentiment)
BEARISH/RISK:
• Resistance $375-$380 CRITICAL (must break for bullish continuation)
• Volume down -17.62% (price rise lacks conviction, no fresh capital surge)
• No coin-specific catalyst (move driven by macro, not XMR news)
• Social sentiment mildly bullish (5.2/10, not extreme)
• Overbought warnings (technical caution at resistance)
• EU ban on privacy coin listings by 2027 (regulatory risk persists)
• Chaikin Money Flow slightly negative (-0.03) = limited capital inflows
• Directional Movement Index weakening (bullish momentum fading)
• Failed January peak $802 (steep correction, now consolidating)
• Range-bound $276-$380 (sideways structure, waiting for catalyst)
• U.S. CPI data upcoming (macro trigger, volatility risk)
Two Scenarios
BREAKOUT TO $400+: Break $375-$380 with volume → Target $400 → $448. Triggers: U.S. Treasury stance attracts capital, reclaimed $357 holds, funding rates stay positive, CPI data benign, broad market rally continues, community optimism drives momentum, breakout above wedge resistance.
REJECTION THEN CONTINUATION: Reject $365-$375 → Pullback to FVG $338-$345 → Consolidate → Break $375 → Target $400-$448. Triggers: Profit-taking at resistance, volume weakness, healthy consolidation, then Treasury stance validates privacy narrative, macro rally resumes, wedge compression resolves up.
My Take
NEUTRAL/BULLISH. XMR consolidating at $348.81 in converging wedge (compression = move imminent). U.S. Treasury SOFTENED stance on privacy (acknowledged legitimate uses = MAJOR long-term bullish). XMR reclaimed $357 support (bullish daily structure). Funding rates positive (traders positioning long). MFI rebounded (capital returning). Selling pressure fading. Community: "Best chart in finance". Testing $365-$375 resistance. TRUE 50/50: Break $375 = $400+ target OR reject, pullback to FVG $338-$345, then continuation. Key: $357 support must hold. Wedge coiling for explosive move. Watch volume on breakout.
What do you think? Breakout or pullback first? Drop your take! 👇
🚀 Boost if this helped!
Not financial advice. DYOR.