XMRUSDT —Trendline & Support Zone Converge at 510-520,Eyeing 620Hook:
BINANCE:XMRUSDT.P just spiked to 637 and got rejected instantly — and the pullback zone it's heading into is where a rising trendline and a horizontal support box happen to overlap almost exactly.
Market Context:
XMRUSDT broke out of a multi-week base (~460–570) with a vertical impulse to 637, then reversed hard. Price is now consolidating just under that old range ceiling near 570, with a defined pullback zone below.
Reasoning:
Blow-off spike defines the supply — the wick to 637 was rejected on the same candle, marking near-term overextension rather than sustainable strength.
Dynamic meets static support — the ascending trendline cuts directly through the 510–521 support box, so a pullback into this zone tests two independent support signals at once, not one.
Old range-high retest — current price (570.72) sits almost exactly on the ceiling of the base that preceded the whole rally, a natural area for two-way interest before any deeper move.
Higher-low structure holds — the entry zone sits comfortably above the last swing low near 495.5, so defending 510–520 keeps the broader uptrend's higher-low sequence intact.
Trade Setup:
Entry : 510–520
Target : 620
Stop Loss : 484
Risk-to-Reward : >1:2.5
Invalidation:
A break and close below 484 would undercut the trendline, the support box, and the prior swing low all at once — structure fails together, not one piece at a time.
Question:
Does the trendline lining up with the support box make you more confident buying the dip here, or would you rather wait for a confirmed reaction candle inside the zone first?
In-depth trading ideas
Monero (XMR) Bearish Chart Setup (5X SHORT)Trading volume has been dropping since April 2025 on XRMUSDT. The all-time high happened January 2026. This week, 21-Sep, XMR is doing a lower high as it is facing resistance. This is a mixed chart setup based on what the rest of the market is doing.
Crypto is bullish, the altcoins are bullish and Bitcoin continues to trade above $80,000. But, Monero moved very differently compared to the rest of the market. As everything was moving down, XMRUSDT was moving up. If everything is now to move up, XMR can easily move down.
This chart setup shows very strong bearish potential. This bearish potential can be negated (invalidated) easily. Right now, it is still active. Sell at resistance or when the market is trading high.
The lower high opens a SHORT opportunity—experts only. Market conditions can change fast and the whole of Cryptocurrency is bullish right now. Instead of going for a simple short, to my bulls, we can always buy those pairs trading at support with a nice LONG.
"Some will go down while others go up."
The MACD and RSI are showing bearish potential as well. Monero's weekly RSI peaked May 2025 with a lower high around Nov 2025 and Jan 2026. The most recent peak is a double-top compared to last high and lower high compared to May 2025. The RSI reading has strong bearish potential.
Here is the daily MACD:
The weekly MACD isn't very bad but looking at the daily, the early bearish potential shown on this oscillator can be better appreciated.
Even if Monero keeps on rising, this isn't a buy. Buying should happen at support, in this case, long ago, around March - May 2024. Now that the action is happening at resistance, pretty high, we can search for a different project to trade, short or look from a distance. We never buy at the end of a bullish wave.
Opportunities are endless. We can find better stuff.
Trade at your own risk. This is a complex chart.
Namaste.
could XMR be the hidden gem of the top 20?Honestly, this chart is INSANE. 🤯
How have we never seen a setup this beautiful from a top 20 coin?
It has already delivered 90% gains, but I still see another 25% upside ahead, with a target of $645.
The crazy part? This coin has been slowly climbing inside a clean rising channel for almost 1,000 days. No crazy pumps. No random moves. Just slow, steady growth like a snail for $XMR.
If you're looking for a strong setup with steady upside XMR is the gem, 🐋📈
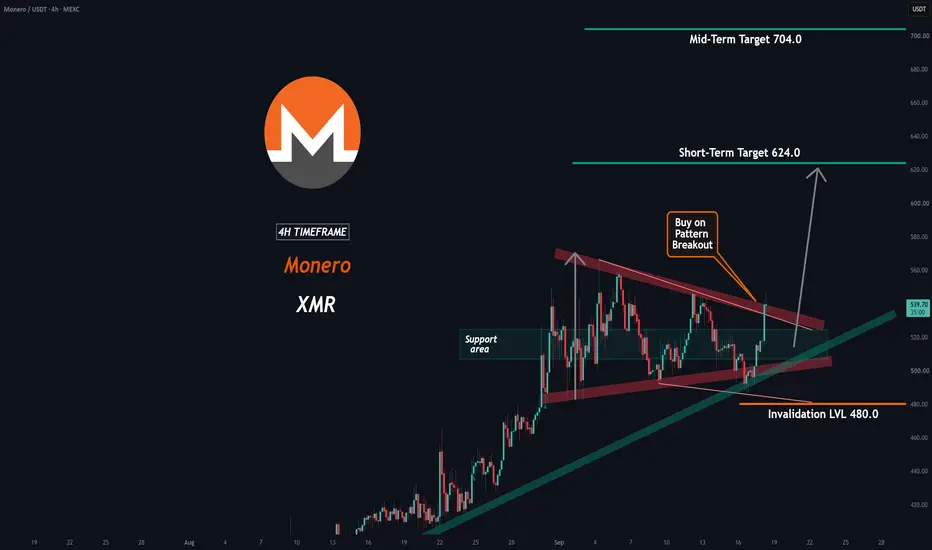
XMR: Two Patterns, One Key BreakoutMonero has been correcting after a strong bullish move, but the bigger structure has not been damaged yet.
What makes the current chart interesting is that the correction is taking shape inside two different structures.
The first view shows a corrective wedge developing within the broader bullish trend. Price has been compressing between descending resistance and rising support, while the larger trend underneath remains positive.
The second chart gives us another perspective: a triangle formation. Here again, price is approaching the upper boundary of the pattern, and a confirmed breakout could open the way for another expansion higher.
I don't think the right approach here is to chase the current candle.
The plan is simpler:
Wait for the pattern to break.
Then wait for confirmation.
Ideally, I want to see a convincing 4H breakout above the pattern resistance, followed by either a successful retest or clear bullish price action around the breakout area.
If that happens, the setup becomes much cleaner.
Setup
Entry:
Wait for a confirmed breakout of the pattern resistance and confirmation/retest.
Short-term target: 624
Mid-term target: 704
Invalidation: 480
The 480 area is important because a move below it would significantly damage the current bullish structure and invalidate this continuation idea.
Why XMR deserves attention
Monero doesn't always behave like the rest of the crypto market.
Its main value proposition is different from most large-cap cryptocurrencies. Monero was designed around private, fungible digital cash, with privacy built into the protocol through technologies including stealth addresses, ring signatures and RingCT. Unlike transparent blockchains, transaction details are not publicly exposed in the same way.
That gives XMR its own fundamental narrative, but it also comes with a different risk profile.
Privacy-focused assets can face exchange-access and regulatory challenges, which can affect liquidity and market structure. At the same time, privacy has remained an active sector narrative recently, with CoinMarketCap reporting continued momentum across privacy coins in September 2026.
From a network perspective, Monero also uses tail emission rather than allowing mining rewards to fall permanently to zero. The current design maintains a small block reward to keep miners economically incentivized and support long-term network security.
Development is also active. A September 2026 development report recorded continued work across the Monero core codebase, wallet software and related infrastructure.
So there is a fundamental story behind XMR — but for this particular setup, I would still let the chart confirm it.
The pattern is there.
Now we wait for the market to prove the breakout.
No breakout, no trade.
No confirmation, no chase.
Risk Warning: This is market analysis for educational purposes, not financial advice. XMR can be highly volatile, and cryptocurrency trading — especially with leverage — can result in significant losses. Always define your invalidation and position size before entering a trade.
Monero: Price Compresses — Which Side Breaks First?Lower Highs Show Weakness
XMR has failed to capitalise on its previous highs and has now produced three consecutive lower highs. The latest at $526.43 keeps short-term pressure on the bulls.
But Higher Lows Remain
Despite those lower highs, XMR continues to form higher lows underneath. This is compressing price towards the middle of its recent range and suggests a larger move could be developing.
EMAs Continue to Support Price
Price is currently sitting between the bullishly crossed 100/50-period EMAs. The 50-period EMA continues to provide underlying support, keeping the broader structure constructive for now.
Momentum Offers Few Clues
Volume remains neutral and RSI continues to chop around the 50 level, reinforcing the current sideways bias. StochRSI is oversold, but that alone is not enough to confirm a reversal.
The Levels That Matter
A break below $488.75 would confirm a bearish change of character and put the broader $480 support zone under pressure. To the upside, reclaiming $526.43 would be the first sign that bulls are beginning to regain control.
In Summary
Monero is becoming increasingly compressed, with three lower highs meeting a series of higher lows. The bullishly crossed 100/50-period EMAs continue to offer support, but neutral volume and an RSI hovering around 50 show neither side has taken control. A break above $526.43 would favour the bulls, while losing $488.75 would confirm a bearish change of character and put the important $480 support zone firmly back in focus.
XMR ForecastKUCOIN:XMRUSDT The logic behind this trade is based on the higher-timeframe bearish trend. The bearish impulses remain strong, while the bullish corrective moves are relatively slow and weak.
On the lower timeframe, we can also see a strong bearish move followed by a slow bullish correction, which increases the probability of another bearish leg.
⚠️ Risk Disclaimer
All analyses, market views, and scenarios presented on this page are provided for informational and educational purposes only and should not be considered financial advice or a recommendation to buy or sell any financial instrument.
Financial markets involve substantial risk, and none of the scenarios presented here are guaranteed to occur. Each trader is solely responsible for their own trading decisions, risk management, and any profits or losses resulting from their trades.
Please consider your own financial situation, risk tolerance, and trading strategy before making any trading decision. Do not rely solely on the information provided on this page when making investment or trading decisions.ll risk. Controlled trade. 🎯
XMR LONG vs SHORT A pretty solid liquidity block has formed. It would be interesting to see it get swept and then have the price continue moving lower.
For now, I want to see $532. From there, we’ll watch the reaction. If we get a close above it, we’ll assess the next move; otherwise, sellers could continue to push the price lower.
xmrusdt longInstructions:
Entry point: yellow
Stop loss: red
Take profit: green
👉Leverage x 5-10-20 for crypto
👉Leverage x 20-50-100 for commodities, stocks, indices, and forex
👉Margin 1-5% max.
Always practice risk and money management.
Invest a maximum of 5% on any trade or across all your trades.
Invest only what you can afford to lose, as no one is in control of the market.
👉Our analyses are primarily based on:
breakouts: two trend lines (ascending and descending) and a line indicating a horizontal breakout.
chart patterns: shoulders and head, triangle parttern, elliott impulse, etc etc.
We don't always have the time to track them at all times or to represent them visibly, given the numerous signals, the number of channels to manage, and especially because of the often rapid pace of market movements.
indicators: We associate at least two indicators with this technique.
👉Depending on the circumstances, we use specific indicators, often setting 3 or more take profit levels.
👉Indeed, there are good days in trading and also bad days. No one can promise to win every trade, and like all traders worldwide, we also experience stop-loss orders. However, we win more than we lose and remain positive.
👉You can close the position before or after the take profit orders indicated by the green lines if you are personally satisfied; the same applies to stop loss orders.
👉We must stay positive, clear-headed, and humble.
we cannot provide all instructions or all trades here on this channel.
Good luck to us all, and may God guide us. Amen.
XMR USDT SHORT SIGNAL111. XMR/USDT – Trade Setup (SHORT)
📈 Position Type: SHORT
🕒 Timeframe: 1H
📊 Market: Futures
💰 Entry Zone:
500.10
518.68
🛑 Stop-Loss:
526.78
🎯 Take-Profit Targets:
• TP1: 482.82
• TP2: 461.92
• TP3: 438.78
• TP4. 419.20
Tp5.
⚙️ Leverage:
5*10
▫️ After TP1, move SL to Entry + 0.2%.
▪️ Exit Plan:
• 40% at TP1
• 20% at TP2
• 20% at TP3
20% at TP4
📌 Risk Management:
Risk only 1–2% of your capital per trade.
⚠️ Always check and confirm the setup on your chart before entering the trade.
Monero Weekly Breakout: The 2021 Ceiling Just Became the Floor$Monero is attempting something it has failed to do for four and a half years. KUCOIN:XMRUSDT on Binance Perpetual is trading at $540.72, up 10.8% on the week, above the $500 to $517 zone that marked the 2021 all-time high. That zone rejected price in May 2021, capped every rally in 2022, and even the violent January 2026 spike that wicked to $800 could not hold a weekly close above it. Price is above the level as I write this, but the candle has not closed. With roughly a day and a half left in the week, this is a setup to watch, not a confirmed breakout.
The structure behind the move is what makes it worth watching. Since the Feb 2024 low near $105, CRYPTOCAP:XMR has printed a clean series of higher lows, and each pullback in 2025 landed on a rising trendline drawn from that bottom. The 50-week moving average has been climbing since mid-2024 and now sits near $360, well below price, which says the trend is mature but not yet extended. The $185 to $190 band, which acted as resistance from 2022 through 2024, flipped to support in early 2025 and has not been revisited since. That same resistance-to-support flip is now being attempted at the 2021 high.
What I want to see at the close is simple: a weekly candle that finishes above $517, ideally above $540, with the wick staying short relative to the body. That would be the first weekly close above the 2021 high in Monero's history. If it prints, the first target is $720, the body of the January 2026 rejection candle, where the last breakout attempt lost momentum. Above that sits the $800 wick, which remains the true all-time high. A weekly close through $800 would put Monero into price discovery with no overhead supply, and the Fibonacci 1.0 extension of the 2024 low to the 2026 high, projected from the mid-2026 low, points to roughly $995 as a stretch target.
The bear case is just as clear, and the January 2026 spike shows exactly how it looks: a fast push above $517 followed by a full retrace within two weeks. If this week's candle closes back below $517, the breakout has failed before it started and I treat the move as a wick into resistance. A close below $500 confirms rejection, and a close below $480 in the following weeks invalidates the thesis entirely. In that case the next supports are the $420 swing high from late 2025 and the rising 50-week average near $360.
Key levels to watch: resistance at $570 (this week's high), $720 and $800; support at $517, $500, $420 and $360. Confirmation is a weekly close above $517. Invalidation is a weekly close below $480.
Follow Our Tradingview Account for More Technical Analysis Updates, | Like, Share and Comment Your thoughts
XMR The $577 Barrier — Breakout or Rejection?📊 Technical Analysis — XMR/USDT
Time Frame: 1W (Weekly)
Pair: XMR/USDT
Pattern: 🔺 Ascending Triangle
Key Resistance: $577
Current Price: Around $528
Major Trendline Support: Ascending trendline
Major Historical High: Around $800
---
🔺 Pattern: Ascending Triangle
On the Weekly timeframe, XMR is showing the characteristics of an Ascending Triangle pattern.
This pattern consists of two main components:
🔸 Horizontal resistance around $577 — price has repeatedly attempted to break above this area but continues to face selling pressure.
🔸 Ascending support / higher lows — each major correction tends to form a higher low, indicating that buyers are becoming increasingly aggressive and are willing to buy at higher prices.
📈 The combination of horizontal resistance + rising support suggests that buying pressure is gradually increasing.
As price approaches the apex of the triangle, XMR's reaction around $577 becomes increasingly important.
---
🟢 BULLISH SCENARIO — BREAKOUT ABOVE $577
The bullish scenario becomes increasingly valid if XMR manages to:
1️⃣ Break above the $577 resistance
2️⃣ Close a daily/weekly candle above $577
3️⃣ Retest the $577 area and successfully hold it as support
If these conditions occur, the major resistance that has been capping price could turn into a new support level.
🚀 Following a confirmed breakout, bullish momentum could potentially push XMR toward:
🎯 $630 — First upside area
🎯 $750 — Major resistance zone
🎯 $800 — Previous major high
If $800 is successfully broken with strong momentum, the long-term bullish structure could potentially open the way toward the $1,000–$1,100 region.
📈 The $1,100 level shown on the chart represents a long-term bullish projection following a breakout from the consolidation structure.
> ⚠️ The $1,100 target does not mean price will necessarily reach it. Breakout confirmation, volume, and momentum remain important factors.
---
🔴 BEARISH SCENARIO — REJECTION FROM $577
The bearish scenario should still be considered because $577 is the key resistance level.
If XMR is rejected strongly around this area:
🔻 Price could enter another pullback/consolidation phase.
Important support levels to watch:
🟡 $528 — Current price / short-term support
🟡 $435 — Next important support
🟡 $355 — Lower structural support
🟡 Ascending trendline — Major support of the bullish structure
If price experiences a rejection from $577 but continues to hold above the ascending trendline, the bullish structure remains intact.
However, if XMR experiences a weekly breakdown below the ascending trendline, the Ascending Triangle could potentially fail, increasing the probability of a deeper correction.
---
⚔️ KEY LEVELS TO WATCH
Level Significance
🔥 $1,100 Long-term bullish projection
🚀 $800 Major historical resistance/high
🟠 $750–$630 Potential breakout targets
🔴 $577 Critical breakout resistance
🟡 $528 Current price / near-term level
🟡 $435 Important support
🟡 $355 Major structural support
📉 Ascending Trendline Bullish structure invalidation area
---
🎯 CONCLUSION
XMR is currently in a very interesting position on the Weekly timeframe.
🔺 The Ascending Triangle structure shows that buyers are gradually increasing their pressure through a series of higher lows, while $577 remains the key barrier preventing further upside.
🚀 A breakout and weekly close above $577 would be the most important bullish confirmation and could potentially open the path toward $630 → $750 → $800, with further upside expansion toward $1,000–$1,100.
🔻 On the other hand, a rejection from $577 could send price back toward its support levels for another retest. A breakdown below the ascending trendline would be a warning sign that the bullish structure is beginning to lose strength.
🔑 KEY LEVELS:
$577 = Breakout Trigger
$435 = Major Support
$800 = Major Resistance / Previous High
$1,100 = Long-Term Bullish Projection
📌 As long as the ascending trendline holds, XMR's long-term bullish structure remains valid.
⚠️ This analysis is for educational purposes only. Always DYOR and manage your risk.
#XMR #Monero #XMRUSDT #Crypto #CryptoAnalysis #TechnicalAnalysis #Altcoins #CryptoTrading #PriceAction #AscendingTriangle #Breakout #Bullish #Bearish #MoneroXMR #CryptoMarket
$XMR | 4 H | BUY SETUP |Hey traders 👋
What are your thoughts on KUCOIN:XMRUSDT right now — do you think buyers can keep defending this zone?
Monero is showing a classic demand-zone reaction after a sharp correction. Price dropped from the $550 swing high all the way down to $466.48, a pullback of over 15%, before buyers stepped in and pushed a 5.34% rebound. That kind of reaction off a marked demand area typically signals sellers are losing steam and buyers are stepping back in with intent.
The level that matters most here is $466.48, which lines up with the broader $465.99 to $461.24 buying order block. This zone has already proven it can hold, and as long as price stays above it, the broader structure remains constructive.
In the short term, this looks like a retracement setup where price could either consolidate around current levels or attempt another push higher toward the next resistance zone, using $466.48 as its base.
On the bullish side, holding above $466.48 keeps the path open toward $489.93 first, with the bigger target at $526.48, which sits right inside the $524.26 to $531.30 selling order block. A clean break and reaction through that supply zone would confirm strength continuing off this demand base.
On the bearish side, a confirmed break below $466.48 invalidates this long-side structure and opens the door toward $454.48. That would flip the near-term bias and suggest sellers have regained control of the range.
If you're watching XMR too, drop a like and let me know your take in the comments.
Good luck with your trades ❤️
XMR/USDT | H1 | PRESSURE BELOW THE ICHIMOKU CLOUD🎯 TP1: $493.85 (+1.72%) │ TP2: $485.20 (+3.44%)
🛑 SL: $518.23 (-3.13%) │ R/R: 1 : 1.1
⚠️ SL placed beyond the nearest candle wicks to reduce the risk of accidental stop-out
FUNDAMENTAL BACKGROUND
In the absence of a fresh project catalyst, XMR moves in line with the broader market and technicals: rising Bitcoin dominance and a declining altcoin season index are putting pressure on the broad alt-rally. Market sentiment indicates extreme greed, increasing vulnerability to sharp pullbacks at the slightest negative news. The macro backdrop is neutral: the US ISM Manufacturing PMI released on 01.09.2026 provided no new impulses to the market, and until the US unemployment rate data on 04.09.2026 (forecast 4.1%, unchanged), the asset remains a hostage to the technical picture.
TECHNICAL PICTURE
The price has settled below the Ichimoku cloud: tenkan-sen (516.08) and kijun-sen (519.84) remain above the price, while senkou-span A (517.96) and B (515.29) form dense resistance in the $515–520 zone. The Average Directional Index (ADX) at 17.8 indicates a weak but confident seller advantage, confirming pressure from current levels. The CCI (20) indicator at -174.9 signals oversold conditions, but the CMF (0.017) flow indicator shows no significant capital inflow for a reversal. The nearest support lies at the lower boundary of the $458–465 range, a break of which would open the path to the lows.
PROBABILITY MODEL
The model records a 49% probability of a continued bullish scenario versus 31% for a bearish reversal, but the technical structure and weak flow favor the seller. Model confidence 75%: the price at the cloud resistance with a weak trend and no catalysts creates conditions for a pullback to the lower boundary of the range.
DIRECTION
🔴 SELL — price below the Ichimoku cloud with a seller advantage on ADX, a pullback to the lower boundary of the range is most likely.
XMR $571 Resistance Region in FocusMonero (XMR) has experienced a strong bullish expansion from its weekly support region around $300 and is now approaching an important technical area near $571. This resistance level also aligns with the 0.618 Fibonacci retracement, creating a region of technical confluence that may be relevant to the market's next directional move.
How price reacts around the $571 region could provide further insight into XMR's near-term market structure. If price faces rejection and is unable to establish sustained trading above this level, the market may continue to trade within the broader range between approximately $300 and $571. This would suggest that the current bullish expansion has encountered resistance without yet confirming a broader breakout.
Alternatively, if XMR consolidates around the current region and establishes acceptance above the $571 resistance level, the possibility of further upside towards higher technical levels, including the $800 region, may increase. Such a scenario would depend on continued bullish momentum and sustained price action above resistance.
Overall, the $571 region represents an important technical reference point for XMR. The market's response around this area may help determine whether price remains range-bound or develops further directional momentum.
-----------------------------------------------------------------------------------------------
Don't invest unless you're prepared to lose all the money you invest. This is a high-risk investment and you should not expect to be protected if something goes wrong. Take 2 mins to learn more: coinjar.com/uk/risk-summary
The article is an opinion expressed by the author at a point in time and does not represent the views of CoinJar UK Limited or CoinJar Australia Pty Ltd. Take care to consider the date of this article and be aware that this opinion is based on circumstances at the time of publishing. No responsibility or liability is accepted for any errors of fact or omission expressed therein. Past performance is not a reliable indicator of future results.
This above article is not to be read as investment, legal or tax advice and it takes no account of particular personal or market circumstances; all readers should seek independent investment advice before investing in cryptocurrencies.
We recommend you obtain financial advice before making a decision to use your credit card to purchase cryptoassets or to invest in cryptoassets.In the UK, it's legal to buy, hold, and trade crypto, however cryptocurrency is not regulated in the UK. It's vital to understand that once your money is in the crypto ecosystem, there are no rules to protect it, unlike with regular investments.
You should not expect to be protected if something goes wrong. So, if you make any crypto-related investments, you're unlikely to have recourse to the Financial Services Compensation Scheme (FSCS) or the Financial Ombudsman Service (FOS) if something goes wrong.
----------------------------------------------------------------------------------------------
XMRAlways use 2x–3x leverage. We build positions in stages, both long and short.
Max 4% of your account as margin per position. Split that 4% into 3–6 entries.
Example: $100 account → max $4 margin per position. Split it as $0.5, then $1, then $1.5. So $0.5 × 3x = $1.5 position size.
Don't get greedy.
Only add when your ROI is above -100%. Better: wait a few days between add-ons. Sleep on it — you might end up adding from higher.
Keep half your account in cash as a reserve. Balanced.
In a short market: 1 long for every 3 shorts.
In a long market: 1 short for every 3 longs.
Every position's liq level should be at least 10x away.
Doubling your account in a day isn't hard — losing all of it isn't hard either. Play carefully. The market is waiting for you to gamble so it can take your money.
$XMR: Whales building shortsBYBIT:XMRUSDT.P
After a strong rally, the broader market has been drifting in limbo for days waiting for CRYPTOCAP:BTC to pick a direction, but CRYPTOCAP:XMR is clearly standing out. 🧩IMA data shows 🐋WhaleMAX is aggressively building shorts at the monthly 📊M-Levels. A short entry opens up after a second sweep of retail stops.
🟡 Short trade plan:
Enter after price returns below the $427-$446 📊M-Levels zone and consolidates under 📊D-Levels.
🟢 Entry 1: $424
🟢 Entry 2: $435
🛑 Stop: $466 behind liquidity
Analysis from me — execution from you 🚀
📊M-Levels — Institutional Interest Levels (IIL)
📊D-Levels — Daily trading levels
🐋WhaleMAX — large players
Analysis powered by 🧩IMA (Integrated Market Analysis)
⚠️ Platform restrictions limit the publication of closed indicators. I display only the output of the 📊Levels algorithm - Institutional Interest Levels (IIL).
#XMR #XMRWhale #InstitutionalLevels #Crypto
XMR TRAP IS HERE — SMART MONEY MAY BE EXITING...!Yello Paradisers! Are you prepared for a potential sharp downside move on #XMR, or are you still calling this “just a healthy pullback” while smart money quietly distributes above you? At first glance, the structure may look harmless. But when we remove emotions and read the chart objectively, the story changes completely. This is not a random retracement. This is a high-risk zone where discipline matters more than opinions.
💎#XMR has formed a clear buying climax followed by a climactic action bar. This combination is a classic sign of distribution. In simple terms, institutions use these aggressive upward spikes to offload positions into retail excitement. When the majority feels confident, that is often when smart money is exiting quietly.
💎#XMR sweeping above the Buying Climax through an Automatic Rally formation and followed it immediately printed a strong bearish momentum candle and broke below the lower boundary of the Automatic Rally channel. This is not random market noise. This is a very important sign of weakness.
💎#XMR buy-side liquidity was swept through an Upthrust test, adding even more bearish confluence to the current structure. Whenever liquidity above key highs gets taken but price fails to sustain higher levels, it usually confirms that sellers remain in control of the market. If bearish momentum continues within the supply zone, the next major downside target sits around the 416, and price could move there much faster than the majority currently expects.
💎#XMR has respected the order block zone of 8-hour time frame. Further we have seen a clear divergence on RSI as well. As long as prices continues bearish momentum, the probability continues to favour further downside. The immediate minor support sits around 430.80, making it the first downside magnet if selling pressure persists.
💎If #XMR manages to break above the key resistance at 483.35 with a strong momentum candle, this whole bearish probability would be invalidated, and we could instead see a bullish continuation. As always, we let price confirm our bias.
Discipline is key, Paradisers! The charts may look volatile, but this is where professionals thrive and amateurs panic. Don’t let emotions guide your trades. Wait for clear confirmation and manage risk like a pro. Strive for consistency, not quick profits. Treat the market as a businessman, not as a gambler.
MyCryptoParadise
iFeel the success🌴
XMR USDT SHORT SIGNAL88. XMR/USDT – Trade Setup (SHORT)
📈 Position Type: SHORT
🕒 Timeframe: 1H
📊 Market: Futures
💰 Entry Zone:
453.36
462
🛑 Stop-Loss:
470.70
🎯 Take-Profit Targets:
• TP1: 444
• TP2: 427.67
• TP3: 414
• TP4. 397.50
Tp5. 382.50
⚙️ Leverage:
5*10
▫️ After TP1, move SL to Entry + 0.2%.
▪️ Exit Plan:
• 40% at TP1
• 20% at TP2
• 20% at TP3
20% at TP4
📌 Risk Management:
Risk only 1–2% of your capital per trade.
⚠️ Always check and confirm the setup on your chart before entering the trade.
Monero Eyes Support Continuation Monero (XMR) has faced rejection from a significant multi-timeframe resistance zone, prompting a corrective move after its recent rally. The rejection suggests buyers are taking profits near resistance, increasing the probability of a deeper retracement before the next directional move develops. While short-term momentum has weakened, the broader market structure remains constructive provided key support levels continue to hold.
The primary area to monitor is the 0.618 Fibonacci retracement, which represents a strong zone of technical confluence where buyers are likely to re-enter the market. This Fibonacci level has historically acted as an important support during healthy uptrends, making it a logical location for price to establish a higher low before attempting another advance.
If Monero successfully holds above the 0.618 Fibonacci support, the probability favours a renewed bullish rotation towards the $372 weekly resistance. A strong reaction from this level, particularly if accompanied by increasing bullish volume, would confirm that the pullback is simply a corrective phase rather than the beginning of a larger trend reversal.
From a technical perspective, the current decline appears to be a healthy retracement within a broader bullish structure. As long as the 0.618 Fibonacci remains intact, buyers continue to hold the advantage, with the potential for Monero to resume its uptrend and challenge the $372 weekly resistance in the coming sessions.
XMR USDT SHORT SIGNAL64. XMR/USDT – Trade Setup (SHORT)
📈 Position Type: SHORT
🕒 Timeframe: 1H
📊 Market: Futures
💰 Entry Zone:
412.49
423.
🛑 Stop-Loss:
434.75
🎯 Take-Profit Targets:
• TP1: 403.16
• TP2: 393.96
• TP3: 384.68
• TP4. 372.67
Tp5.
⚙️ Leverage:
5*10
▫️ After TP1, move SL to Entry + 0.2%.
▪️ Exit Plan:
• 40% at TP1
• 20% at TP2
• 20% at TP3
20% at TP4
📌 Risk Management:
Risk only 1–2% of your capital per trade.
⚠️ Always check and confirm the setup on your chart before entering the trade.
Monero XMR — A Technical Setup With Its Own StructureMonero is one of those assets I prefer to analyze on its own rather than simply following Bitcoin .
Its direction and momentum do not always move in direct correlation with BINANCE:BTCUSDT BTC. MEXC:XMRUSDT XMR often develops its own structure, its own momentum, and its own technical behavior.
That is exactly why this setup is interesting.
After the strong move higher, price has been consolidating around the 394–398 area, with the 396 zone acting as the key pullback area.
For now, I remain bearish in the short term.
🔴 Bearish Scenario
Price is currently trading below the pullback zone, and if sellers maintain control, I would expect another move toward:
🎯 376 — Short-Term Target
This area is important because it was previously defended strongly and represents a significant support area on the chart.
I am not treating 376 as a guaranteed target. The reaction there will matter.
🟢 Bullish Scenario
The bearish view has a clear invalidation.
406 is the key invalidation level.
If price breaks and holds above 406, I would no longer want to fight the bullish momentum.
At that point, the setup changes completely.
Instead of looking for shorts, I would start watching for a long opportunity toward the next major resistance area around $430.
So the structure is relatively simple:
Below 406 → bearish bias → 376 in focus
Above 406 → bearish idea invalidated → bullish setup → ~$430
This is also why I like setups with clearly defined invalidation.
We don't need to know what XMR will do next.
We only need to know what price action would make us change our mind.
For now, I remain bearish — but I will not force the short if the market proves otherwise.
⚠️ Risk Warning: Crypto trading, especially with leverage, involves significant risk and can result in substantial losses. XMR can move independently from Bitcoin and may experience sharp volatility. This analysis is for educational purposes only and is not financial advice. Use appropriate position sizing and risk management.