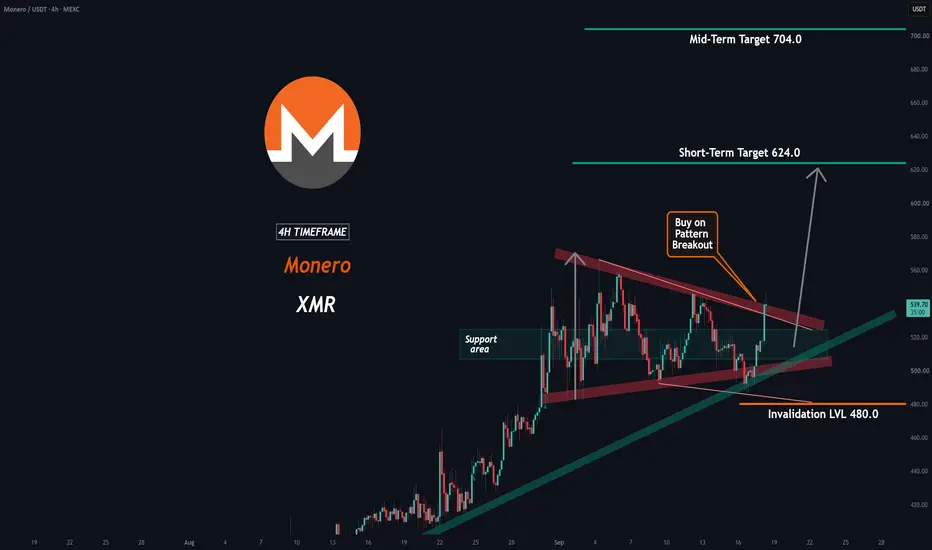
XMRUSDT —Trendline & Support Zone Converge at 510-520,Eyeing 620Hook:
BINANCE:XMRUSDT.P just spiked to 637 and got rejected instantly — and the pullback zone it's heading into is where a rising trendline and a horizontal support box happen to overlap almost exactly.
Market Context:
XMRUSDT broke out of a multi-week base (~460–570) with a vertical impuls
XMRX vs Tether USD PERPETUAL CONTRACT
No trades
No trades
Monero (XMR) Bearish Chart Setup (5X SHORT)Trading volume has been dropping since April 2025 on XRMUSDT. The all-time high happened January 2026. This week, 21-Sep, XMR is doing a lower high as it is facing resistance. This is a mixed chart setup based on what the rest of the market is doing.
Crypto is bullish, the altcoins are bullish and
could XMR be the hidden gem of the top 20?Honestly, this chart is INSANE. 🤯
How have we never seen a setup this beautiful from a top 20 coin?
It has already delivered 90% gains, but I still see another 25% upside ahead, with a target of $645.
The crazy part? This coin has been slowly climbing inside a clean rising channel for almost 1,00
XMR: Two Patterns, One Key BreakoutMonero has been correcting after a strong bullish move, but the bigger structure has not been damaged yet.
What makes the current chart interesting is that the correction is taking shape inside two different structures.
The first view shows a corrective wedge developing within the broader bullish
Monero: Price Compresses — Which Side Breaks First?Lower Highs Show Weakness
XMR has failed to capitalise on its previous highs and has now produced three consecutive lower highs. The latest at $526.43 keeps short-term pressure on the bulls.
But Higher Lows Remain
Despite those lower highs, XMR continues to form higher lows underneath. This is c
XMR ForecastKUCOIN:XMRUSDT The logic behind this trade is based on the higher-timeframe bearish trend. The bearish impulses remain strong, while the bullish corrective moves are relatively slow and weak.
On the lower timeframe, we can also see a strong bearish move followed by a slow bullish correction, which
XMR LONG vs SHORT A pretty solid liquidity block has formed. It would be interesting to see it get swept and then have the price continue moving lower.
For now, I want to see $532. From there, we’ll watch the reaction. If we get a close above it, we’ll assess the next move; otherwise, sellers could continue to push
xmrusdt longInstructions:
Entry point: yellow
Stop loss: red
Take profit: green
👉Leverage x 5-10-20 for crypto
👉Leverage x 20-50-100 for commodities, stocks, indices, and forex
👉Margin 1-5% max.
Always practice risk and money management.
Invest a maximum of 5% on any trade or across all your trades.
Invest on
See all ideas
Summarizing what the indicators are suggesting.
Oscillators
Neutral
Oscillators
Neutral
Summary
Neutral
Summary
Neutral
Summary
Neutral
Moving Averages
Neutral
Moving Averages
Neutral