Natural Gas (NGAS)Hello everyone.
according to the elliot waves which are indicated in the chart:
1. Implusive Wave 1 has been completed in 2022 June.
2. Correction of Wave 1 has been completed in 2024 February.
And after that Completeion of Wave 1 and 2, there was a 5 waves in the form of Leading Diagonal which indi
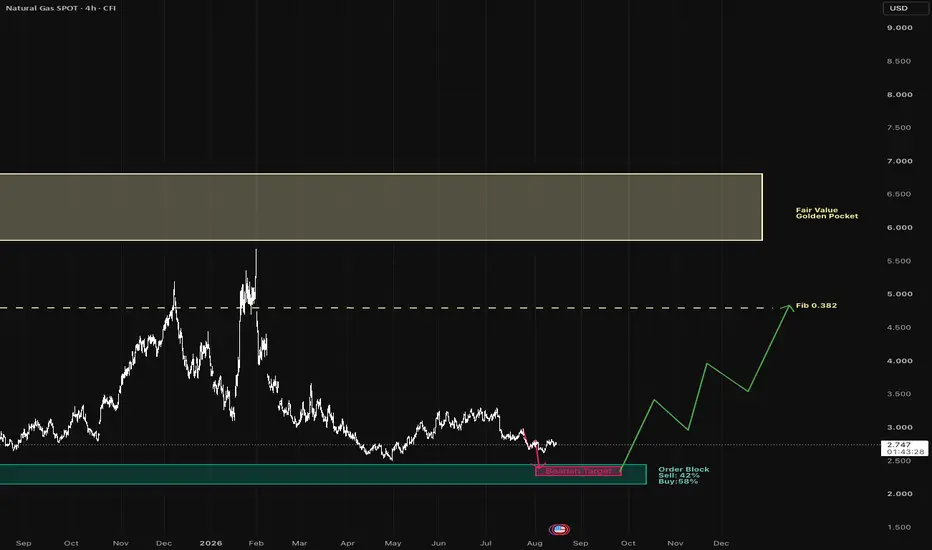
Natural Gas: Final Liquidity Sweep Before Autumn Rally?Natural Gas is currently setting up a potential macro reversal structure on the 4-hour timeframe. We expect a short-term continuation down into our key demand zone to complete the bearish target, followed by a seasonal bullish push heading into autumn toward higher Fibonacci retracement levels.
Te
Natural gas might be ready for the breakoutNatural gas is getting to the end of the withdrawal season showing extremely low volatility compared with Crude oil. Usually, such low volatility might translate into the a volatile price swing, especially in case of testing the lower band of the Bollinger Bands, as shown on the chart.
The pullback
XNGUSD: sellers still control the bigger structureThe latest natural gas backdrop is still mixed, but short-term pressure remains visible.
According to WSJ, U.S. natural gas futures started the week lower as updated weather forecasts showed less immediate heat, which reduces near-term cooling demand. That is bearish for gas because summer power bur
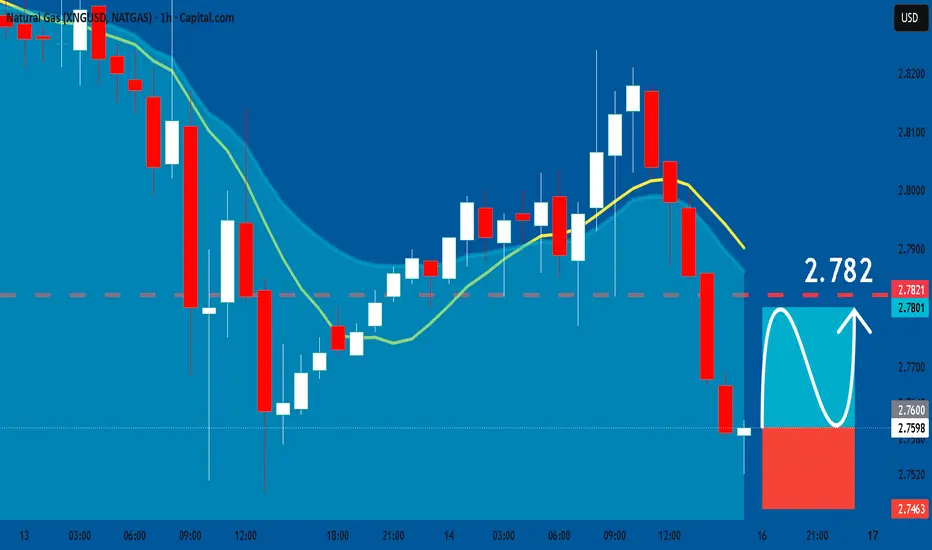
NATGAS The Target Is UP! BUY!
My dear followers,
I analysed this chart on NATGAS and concluded the following:
The market is trading on 2.759 pivot level.
Bias - Bullish
Technical Indicators: Both Super Trend & Pivot HL indicate a highly probable Bullish continuation.
Target - 2.810
Safe Stop Loss - 2.728
About Used Indica
Natural Gas: Buyers are pressing the Wedge top again📊 Natural Gas: Buyers are pressing the Wedge top again
Natural Gas is pushing back toward the upper boundary of the rising wedge, with price trading near 2.84-2.85 after holding the lower trendline.
The structure is still constructive: price remains above EMA9, EMA20 and SMA50, while the 200 SMA is
Natural Gas: real breakdown or stop hunt?Natural Gas: real breakdown or stop hunt?
Natural gas is trading near $2.76, testing the key support zone at $2.74–$2.76. This area is important because price is sitting close to the SMA 200 near $2.756, while sellers have already pushed gas below the short-term structure.
Seven of Futures warns
XNGUSD: Can buyers defend the 2.80 zone?🎯 Trade Setup:
Direction: Long from support confirmation
🔺 Entry: $2.805-$2.812
🛑 Stop Loss: $2.785
🎯 Take Profit 1: $2.820
🎯 Take Profit 2: $2.834
📰 News:
The fundamental backdrop is mixed. The latest EIA storage report showed a larger-than-expected build, which is bearish because it signals that
NATGAS: Long Trade Explained
NATGAS
- Classic bullish setup
- Our team expects bullish continuation
SUGGESTED TRADE:
Swing Trade
Long NATGAS
Entry Point - 2.760
Stop Loss - 2.746
Take Profit - 2.782
Our Risk - 1%
Start protection of your profits from lower levels
Disclosure: I am part of Trade Nation's Influencer
Natural Gas Broke the Trendline. Now It Has to Prove the BreakNatural gas has finally disrupted the bearish structure that controlled price through most of July.
The move above the major descending trendline is meaningful because previous rebounds repeatedly failed before reaching this point. Buyers are now producing a stronger recovery and the latest pullbac
See all ideas
Displays a symbol's price movements over previous years to identify recurring trends.