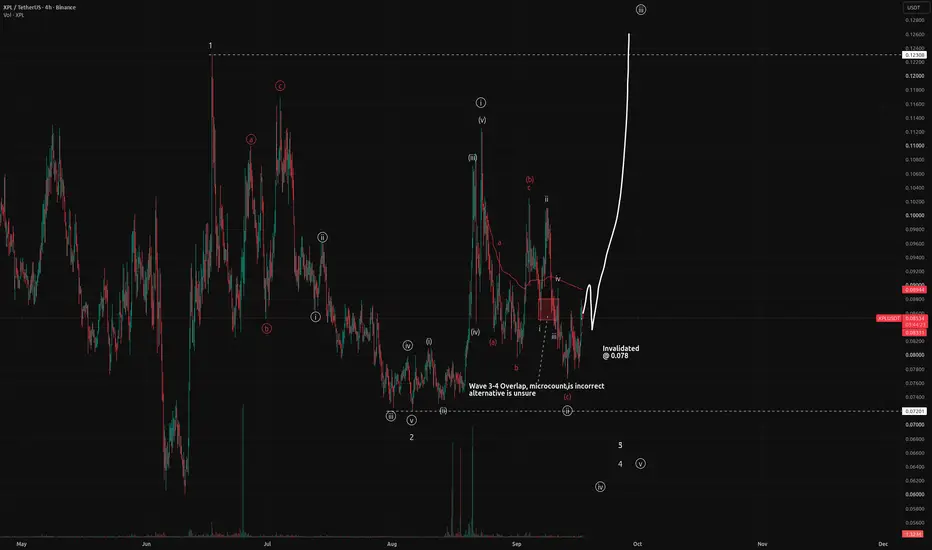
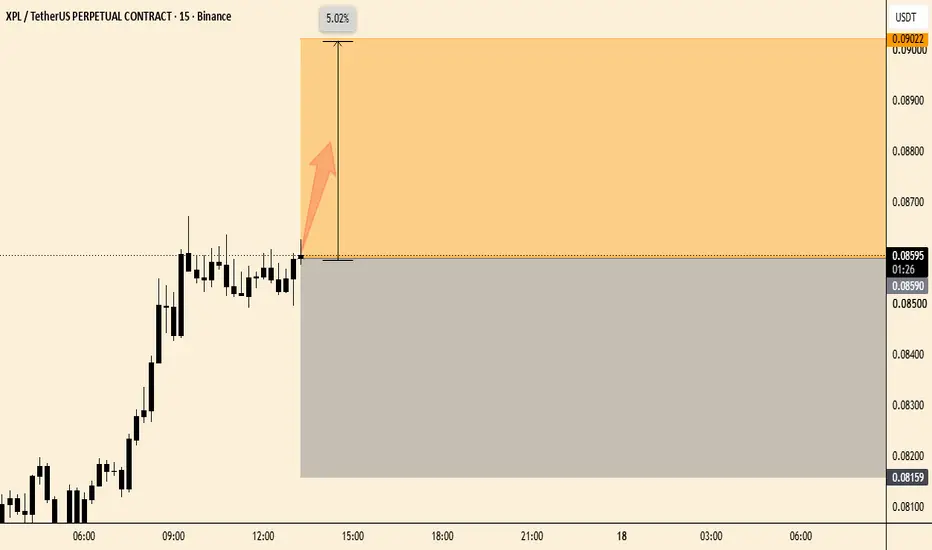
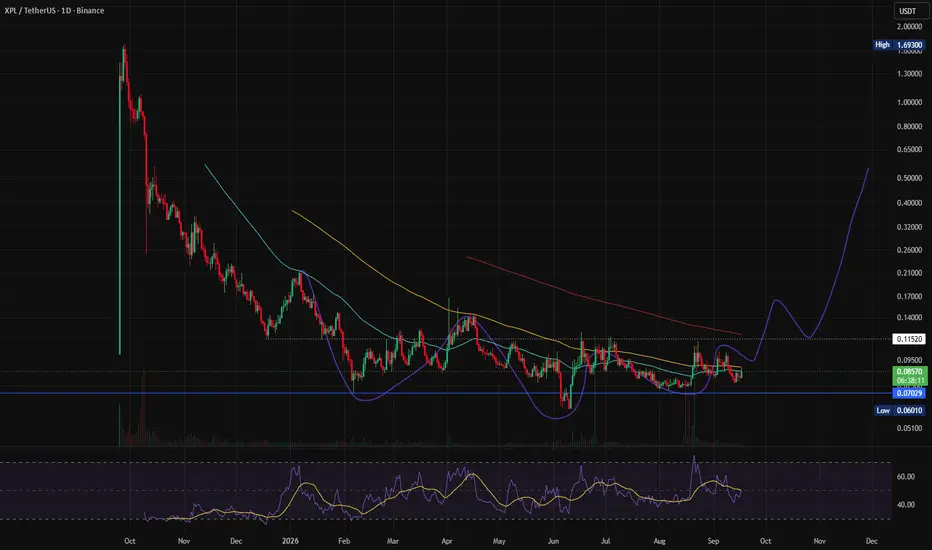
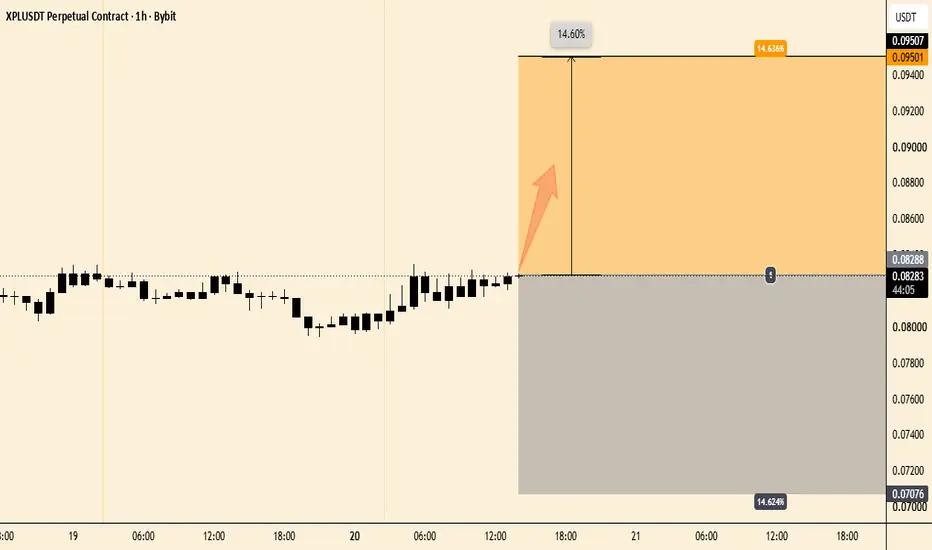
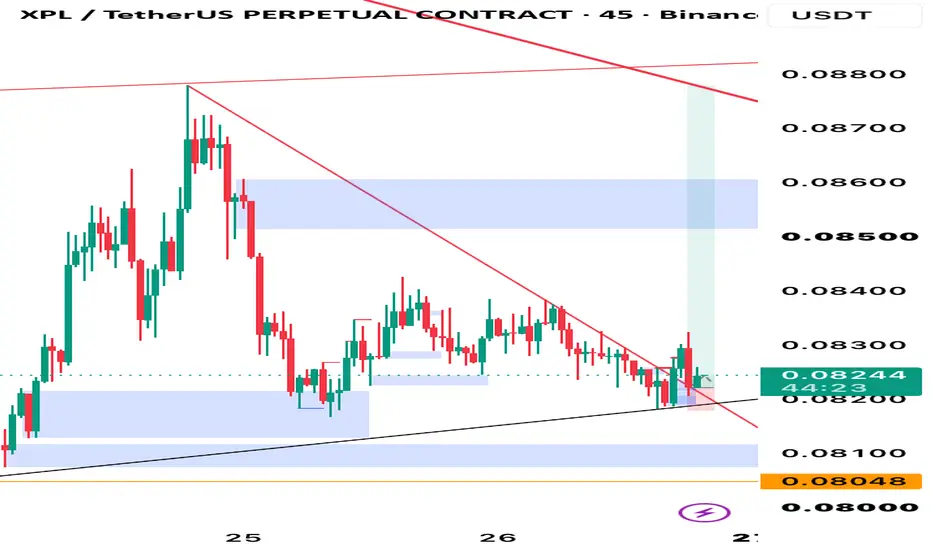
XPLUSDT Forming Bullish MomentumXPLUSDT is forming a clear bullish momentum pattern, a classic bullish reversal signal that often indicates an upcoming breakout. The price has been consolidating within a narrowing range, suggesting that selling pressure is weakening while buyers are beginning to regain control. With consistent volume confirming accumulation at lower levels, the setup hints at a potential bullish breakout soon. The projected move could lead to an impressive gain of around 50% to 60% once the price breaks above
In-depth trading ideas
๏ปฟXPL: Re-accumulation. Model still in play. $0.165 TARGETWhat is good boys, so my last post covered my position on XPL.
Price action has been pretty choppy recently but it locally re-accumulated showing good Market maker involvement.
Expectational Orderflow is still the same, $0.165
Be prepared for the upcoming expansion ;)
XPL / Plasma: Model 2 Accumulation โ +100% on the table?What is good in the hood,
XPL is currently developing a super clean Model 2 Accumulation, and the confirmation I'm watching is extremely simple:
I want an 18H candle close above the red line.
If we get that close, I'll be looking for the bullish expansion toward the $0.17 technical target โ roughly a +100% move from this region.
But $0.17 isn't necessarily where the entire position gets closed.
If this structure confirms, there's a strong possibility we're looking at a macro bottom. That m
XPL - My Bottom Cope CountI have been tracking XPL for awhile now, and the wave-count's I've had for it has been ever-changing and so painful. Anyone who's been holding XPL I'm sure knows, but the only thing I hold spot is Zcash everything else I just try to get a cheeky leverage trade on here and there. And this one has burned me in the past, badly.
Selling pressure has been unrelenting, no thanks to their token unlocks that have happened at massive intervals. However, when things have swept to the 0.07 range buyers ha
XPL/PLASMA: Confirmed model 2 accumulation ($0.165 TARGET) What is good,
Last post I talked about XPL being close to confirmation, well that confirmation has taken place and I am positioned at the 18H BOS for higher.
5RR on this trade, with heavier risk since it is a TWT Model 2 accumulation which has the added Void in Volume at the upper half of the range.
Keep an eye on it, really high probability ranging environment ;)
XPL - Key Technical Structure and Breakout Levels to WatchPlasma (XPL) is the native asset of Plasma, an EVM-compatible Layer 1 blockchain designed specifically for stablecoin payments and settlement. The network focuses on efficient stablecoin infrastructure, including zero-fee USDโฎ transfers, while XPL plays a core role in network security, transaction execution and validator incentives.
From a fundamental perspective, Plasma launched with an initial supply of 10 billion XPL. The token allocation includes 40% for ecosystem and growth, 25% for the te
XPL Breakout Setup โ Fibonacci Expansion Targets at $0.1567, $0.If the current breakout structure remains valid, the Fibonacci expansion levels can be used as potential upside targets.
The main levels Iโm watching are:
0.75 extension: $0.1567
1.00 extension: $0.1835
1.25 extension: $0.2102
These levels provide a reasonable framework for taking profits progressively rather than relying on a single target.
As long as price holds above the breakout structure, I would consider these Fibonacci expansion levels as the primary upside objectives.
XPL โ Descending Triangle: Breakout or Breakdown Next?๐โก Technical Analysis โ XPL/USDT
๐ต Coin: AMEX:XPL
โ Time Frame: 2D
๐ Structure: Descending Triangle / Descending Resistance Structure
๐ฏ Major Support: $0.072 โ $0.082 ๐จ
๐ Current Price Area: ~$0.086
๐ป Major Trendline Resistance: Around $0.095โ$0.100 and gradually declining over time
---
๐ป๐ 1. Descending Trendline โ Major Resistance
The descending yellow trendline represents the main dynamic resistance ๐๐ป on the chart.
Since the rejection from around $0.21, XPL has continued forming a low
XPLUSDT Forming Falling WedgeXPLUSDT is forming a clear falling wedge pattern, a classic bullish reversal signal that often indicates an upcoming breakout. The price has been consolidating within a narrowing range, suggesting that selling pressure is weakening while buyers are beginning to regain control. With consistent volume confirming accumulation at lower levels, the setup hints at a potential bullish breakout soon. The projected move could lead to an impressive gain of around 70% to 80% once the price breaks above the
#XPL Potential Bullish Head and Shoulders Pattern๐#XPL Potential Bullish Head and Shoulders Pattern๐
๐ง From a structural perspective, the price has stabilized above the S/R range and is currently approaching the downtrend line. If we can successfully break through this downtrend line resistance, we will open up further upside potential. Here, we have the opportunity to form a bullish head and shoulders pattern, making it well worth our attention.
โ ๏ธNote that we can look for bullish signals on smaller timeframes. DCA trading methods can be us
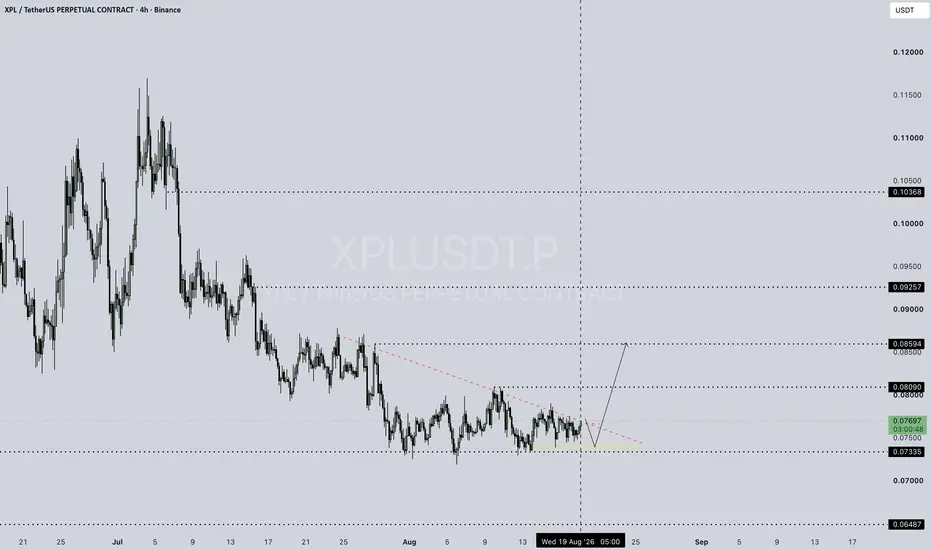
XPLBINANCE:XPLUSDT.P
**Analysis:** ๐
- Current price: **~0.07634 USDT** ๐
- Resistance: **0.09000 โ 0.09257** ๐ง
- Major resistance: **0.10000 โ 0.10368** โฐ๏ธ
- Support: **0.08000 โ 0.07335** ๐ก๏ธ
- Major support: **0.07000 โ 0.06487** โ
**Bounce Zone:** ๐
- Price is sitting near support around **0.08000 โ 0.07335** ๐
- Bounce possible from current area if support holds โ
Disclaimer: Not Financial Advice. Low Cap. โ ๏ธ
Plasma XPL price analysis to the end of 2026๐ CRYPTOCAP:XPL is starting to look very interesting.
According to market trackers, the daily trading volume of #Plasma is now running at roughly 3x the project's market capitalization.
By itself, that doesn't guarantee anything.
But it definitely gets our attention.
What's even more interesting is the chart.
๐ Despite the unusually high trading activity, OKX:XPLUSDT isn't showing signs of panic or distribution.
Instead, price continues to consolidate in a relatively tight range.
And whil
XPL: Macro Lower High Sequence ConfirmedXPL: Macro Lower High Sequence Confirmed โ A Strategic Short Playbook Awaiting Dynamic Barrier Confirmations
XPL is officially entering a highly decisive downward cycle on its macro timeframe, unlocking a high-confirmation trend-following sell (Short) entry for the community in 2026. Consistent overhead supply has maintained intense downward pressure, successfully driving price candles to lock in a third consecutive lower high. The textbook formation of this lower high sequence serves as clear v
XPL/USDT โ Long After Pullback [Quantum Algo]XPLUSDT Perpetual
Context:
XPL has been on a remarkable run this month. The previous Buy signal at 0.063 launched a parabolic rally up to 0.108 โ a clean 70%+ move in less than two weeks. After the rally peaked, price corrected back to 0.094. Now a fresh Buy signal has fired at 0.0946 as price retests the breakout structure.
Why this setup works โ three confluences:
Signal history โ proven asset โ the first Buy on this exact chart delivered a 70%+ rally. When an asset responds cleanly to signa
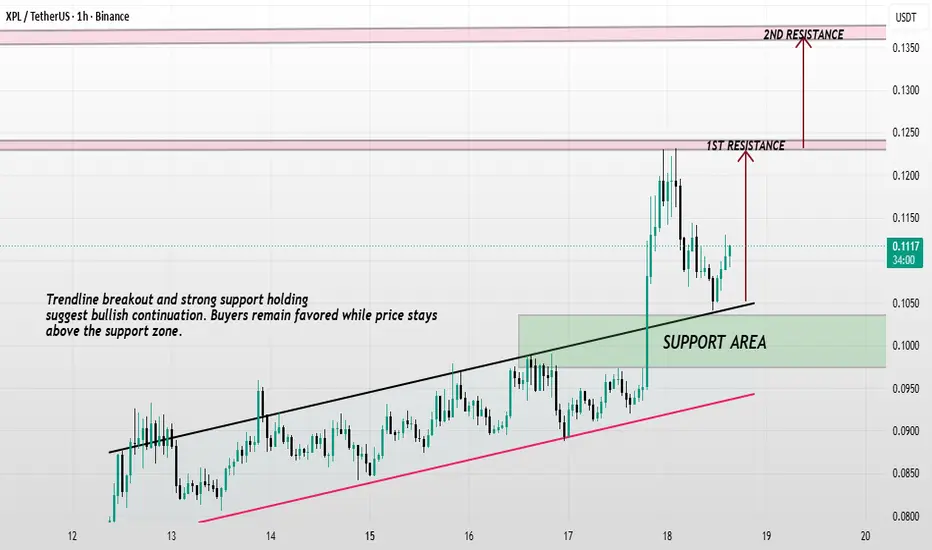
XPLUSDT Bullish Continuation | Strong Support Area & Trendline BXPLUSDT Bullish Continuation | Strong Support Area & Trendline Bounce ๐
Description:
XPL / TetherUS (XPLUSDT) is demonstrating a textbook bullish structural continuation setup on the 1H timeframe. Following a strong upward displacement that cleared internal liquidity pools, price underwent a corrective pullback to mitigate key local demand. This pullback perfectly tapped into the designated green "SUPPORT AREA" block, which confluxes beautifully with a well-respected ascending trendline support
XPL/USDT - Major Breakout or Another Rejection?XPL/USDT is currently showing signs of recovery after experiencing a sharp decline that formed a low around $0.0601. Price has successfully rebounded from a strong demand zone and is now testing a key resistance level represented by a ๐ Descending Trendline that has been suppressing price action for several months.
โก This area is critical, as a breakout above the trendline could potentially shift the market structure from bearish to bullish.
---
๐ Current Technical Structure
๐ Descending Tre
PLASMA (XPL) โ Accumulation Within a Descending TrianglePLASMA has been consolidating for several months inside a long-term descending triangle while showing signs of an accumulation phase above the $0.075 support zone.
Repeated tests of support with diminishing downside momentum suggest sellers may be losing control as buyers gradually absorb supply. Price is now approaching the descending trendline resistance, where a breakout could trigger a move toward the $0.12โ$0.15 range.
A daily close below $0.075 would invalidate this bullish scenario.
Ke