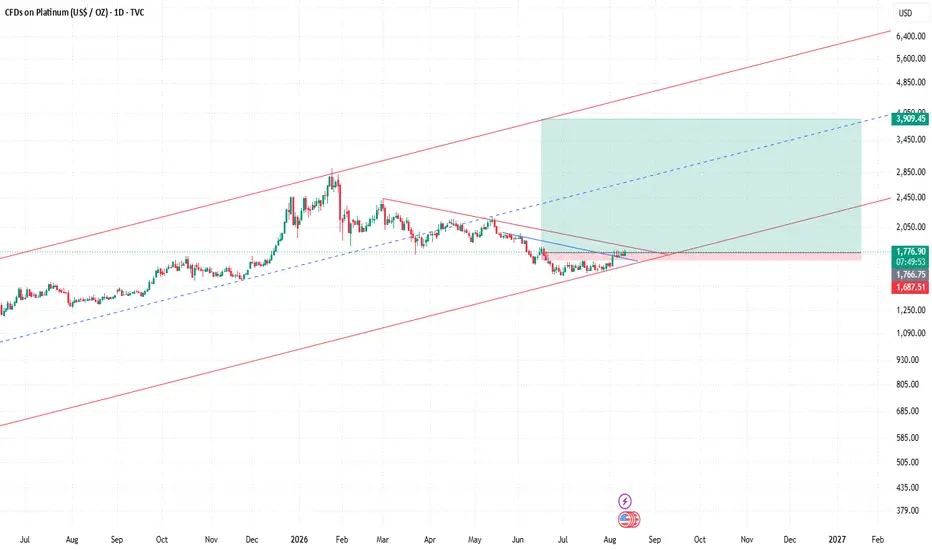
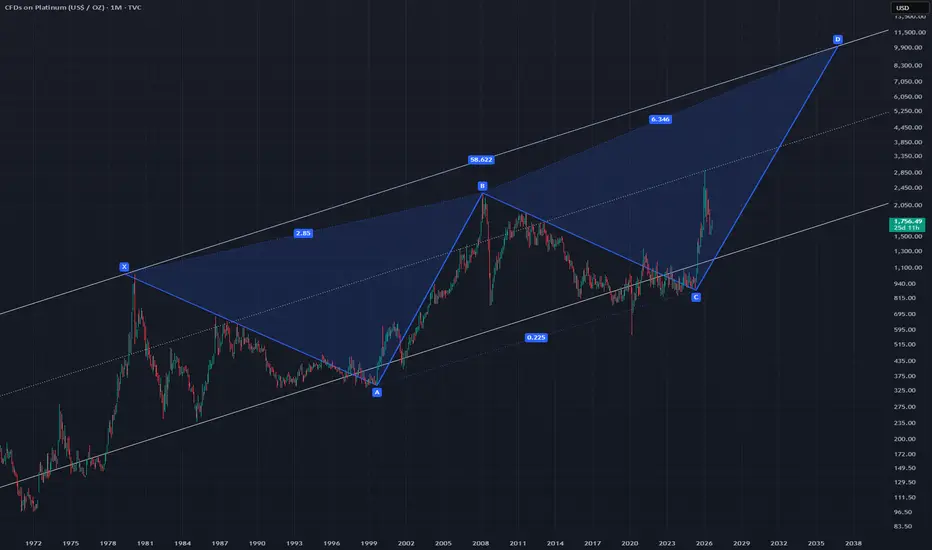
XPTUSD (Platinum) BUY Setup | Bullish RSI Divergence & Trend RevXPTUSD (Platinum) is showing a potential bullish reversal on the 4H timeframe after forming a clear bullish RSI divergence at a strong support zone, indicating that bearish momentum may be fading. Price has started to form a higher low, increasing the probability of an upside continuation if buyers maintain control above the entry level. My trade plan is Buy at 1643.80, with a Stop Loss at 1529.19, Take Profit 1 at 1745.41, and Take Profit 2 at 1862.12. As always, this is my personal technical a
In-depth trading ideas
Platinum – Daily Timeframe AnalysisOn the daily timeframe, platinum has successfully broken above the major resistance zone between $1,500 and $1,600 and is now trading within a higher price range.
Following this breakout, the $1,700 area can be considered an important support zone within the new trading range. As long as price remains above this level and the bullish structure is maintained, the next potential upside targets are around $1,900 and $2,000.
This bullish outlook is also supported by broader fundamental factors, in
XPT/USD: Platinum Outlook — EMA50, Momentum & Key ResistanceTHIEF TRADER | XPT/USD — THE PLATINUM HEIST 💎
📅 Date: 07 September 2026 | 🕐 London Time (BST)
━━━━━━━━━━━━━━━━━━
🎯 TRADE SETUP AT A GLANCE
━━━━━━━━━━━━━━━━━━
🏷️ Asset : XPT/USD — Platinum Spot vs US Dollar
📆 Trade Style : Day Trade / Swing Trade
📈 Direction : LONG (Bullish)
🕯️ Confirmation TF : Daily Chart — EMA 50 Bullish Alignment
💰 Live Spot Price : ~$1,836 per troy ounce (CFD, BST 07 Sep 2026)
📊 Today's Range : $1,708 – $1,907 (intraday reference, CFD data)
🏆 52-
PLATINUM: Bull-Flag Formation, Decisive Breakout Incoming!Hello Community,
welcome to my new analysis about PLATINUM (XPTUSD). With this symbol, I have detected interesting signs that have the potential to lead to a major trading opportunity in the upcoming times. Therefore, I have identified all the pivotal factors to consider with XPTUSD.
When looking at my chart, we can see how XPTUSD is forming this gigantic bull-flag formation. XPTUSD has also already bounced within the ascending trendline support, matching the 200-MA support marked in blue. Fr
PLATINUM Strong Sell Signal within the 2026 Channel Down.Last time we looked at Platinum (XPTUSD) was almost 5 months ago (April 17, see chart below) giving a Sell Signal on the 0.618 Fibonacci retracement level that eventually hit our $1750 Target:
The price hit the 0.618 Fib yet again recently (August 21), which also happened to be on the 1D MA200 (orange trend-line) and got rejected. The 1D MA50 (blue trend-line) is the only Support standing (breaking below confirms the Signal) before a 1W MA100 (red trend-line).
If the break-out does happen,
Platinum (XPTUSD) LONG — 1D ALMA Setup (WR 75% · avg RR 1.6)CAPITALCOM:XPTUSD · 1D · long only.
(Context: platinum spot CFD — precious + industrial / auto-catalyst hybrid via USD, growth, and metals risk appetite — not a discretionary “buy the platinum dip” call.)
═
█ RESEARCH HUB
Category: Commodities sentiment 47.8 (Neutral) — built from 67 locked notes (26 constructive / 14 risk-off / 23 mixed); ticker verdicts +7 / −20. Drivers skew energy / softs two-way, not a platinum-only dossier.
Sector: Commodities · Metals 41.9 (Fear) — thin slee
Platinum | Strong Buy ICI Strategy
Platinum is looking like a strong buy.
Strong inpulse, followed by a retracement to the 38% fib.
Confluence, bounced off the support level which is aligned with the moving everage. Alongside this all three moving averages point upwards which is very bullish.
Targets:
1st Target: 1940
2nd Target: 1985
Platinum Wave Analysis – 21 August 2026
Platinum: ⬆️ Buy
– Platinum broke resistance zone
– Likely to rise to resistance level 2000.00
Platinum recently broke the resistance zone between the resistance level 1835.00 (which has been reversing the price from June), resistance trendline from March and the 61.8% Fibonacci correction of the downward impulse from June.
The breakout of this resistance zone accelerated the active intermediate impulse wave (3).
Platinum can be expected to rise further to the next round resistance level
Platinum (XPTUSD): wedge breakout — the real test starts now🇬🇧 English
On the daily, Platinum found support at the old Monthly Close and prior low and bounced. The falling wedge broke to the upside, the old monthly close is reclaimed and price is back above the EMA50, with RSI over 50. It's now testing the EMA200 together with the upper Bollinger band and the OB- 1D zone — the area where the move up could stall. As long as the reclaimed levels hold, the structure looks healthier; a drop below brings the old monthly close back into play.
On the 4H we s
Platinum (XPTUSD): wedge breakout — the real test starts now🇬🇧 English
On the daily, Platinum found support at the old Monthly Close and prior low and bounced. The falling wedge broke to the upside, the old monthly close is reclaimed and price is back above the EMA50, with RSI over 50. It's now testing the EMA200 together with the upper Bollinger band and the OB- 1D zone — the area where the move up could stall. As long as the reclaimed levels hold, the structure looks healthier; a drop below brings the old monthly close back into play.
On the 4H we s
Platinum: The Most Atrractive Metal Setup Right NowAs for platinum, I currently see an interesting buying opportunity in this metal.
The stop-loss can be kept relatively tight (1737), which makes the setup attractive from a risk-management perspective. I also like the fact that today platinum managed to break above the previous highs. The price had been trading within a range for quite some time, and today we finally saw a breakout.
The price has pulled back since then, but I still believe platinum has upside potential. It has also been consol
Platinum Wave Analysis – 4 August 2026
– Platinum broke resistance level 1680.00
– Likely to rise to resistance level 1835.00
Platinum recently broke the resistance level 1680.00 (which is the upper border of the narrow sideways price range inside which the price has been moving from the end of June).
The breakout of the resistance level 1680.00 coincided with the breakout of the 38.2% Fibonacci correction of the downward impulse from the start of June.
Platinum can be expected to rise further to the next resistance level 1835.0
Platinum Price Analysis: Potential Bottom Formation Inside a DowPlatinum (XPT/USD) | 4H Technical & Fundamental Analysis
Hello everyone, and welcome back to all my fellow TradingView followers! 🌹📊
I hope your trading journey is going well and your decisions are always backed by proper risk management.
Today, we’re taking a closer look at Platinum (XPT/USD) on the 4-hour timeframe. 🔎
🏦 Fundamental Perspective
Platinum is both a precious metal and an important industrial commodity. 🪙⚙️
Beyond its value as a precious metal, platinum has a wide range of ind
Platinum — the record is behind it, now a long stallPlatinum spent 2025 in one of its strongest runs in years, and 2026 has been about digesting it.
Late 2024 into January 2026 : a sustained climb to a record above $2,900 an ounce — the bundle runs beneath price the whole way up, structure and direction agreeing.
January to May 2026 : the unwind. Price gives back a large share of the rally, breaking down through the same structure that had carried it.
Since May : a long stall, holding in the $1,600 area. Whether this is the base the next le
Platinum update....Short played out well !!!Platinum Significant move — spot dropped from 1649.92 to 1567.30, a break of every level I flagged. Rejection at the PWH/PDH shelf played out (scenario #1 from last update), and it didn't just fade to PWPOC — it drove straight through PWPOC 1623.65, through PDL 1607.82, through PWL 1553.50 is not yet touched but 1567.30 is now below the entire prior weekly range and inside the discount zone toward PML 1537.95. Note also the Weekly POC has shifted to 1623.65 (merging with the prior week's POC — t
XPTUSD Range Trap: 29-Retest Ceiling in Play, Stacked Liquidity▪️ XPTUSD H1 SNAPSHOT — EXECUTIVE SUMMARY
▪️Platinum is trading near 1,568.44, pressing into the lower demand cluster after leaking away from resistance. Structure is consolidating just above stacked support.
▪️ Primary outlook is cautious — the reaction at 1,554.00 is the key tell. A hold sets up a mean-reversion bounce; a loss opens the liquidity pocket below.
▪️ Key resistance zone: 1,584.50, where sellers have defended 12 times. Above that, 1,608.50 and 1,653.50 stack as the extended ceil