XPTUSD — H1 Intraday: Bearish Pullback Short at 1,446.51. Market Overview
XPTUSD (OANDA) is trading at 1,441.2 on the H1 chart at 08:04 (UTC+7), 17 Nov 2026, bouncing off the session low near 1,433.4. The market is open and the data is live. The bias is bearish, but there is no live entry at the current price — this is a conditional pullback-short plan only.
2. Multi-timeframe picture
D1: price 1,433.84, below EMA20 1,512.89 and EMA50 1,592.01, RSI 35.67, ATR 49.57. Downtrend from the ~1,562.8 swing high (10 Nov), after the ~1,372 low (4 Nov).
H4:
In-depth trading ideas
XPTUSD | 4H rebound into daily supply — wait for rejectionOANDA:XPTUSD • 4H execution / D1 context. Snapshot: 1,520.956 USD (+1.17%), last update Fri Nov 6, 16:59 GMT-5; the CFD market is closed, so this is a stale weekend reference, not a live quote.
Structure: the daily sequence still shows lower swing highs. The sharp 4H rebound from an early-November low near 1,380–1,400 has reached the prior 1,535–1,555 reaction area; that is a countertrend recovery, not a confirmed daily reversal. These are approximate visual zones, not precise order-book levels
XPTUSD 30m: Approaching Key Reversal Point – Potential RejectionPlatinum has made a strong impulsive rally and is now approaching a major resistance zone on the 30-minute timeframe.
Key Observations:
Price has broken higher from a previous consolidation structure (points A, B, D).
A clear supply/resistance zone is marked as Reversal Point around 1516 – 1527.
A large downside imbalance is visible below.
Trade Idea (Bearish Bias):
Looking for rejection from the Reversal Point.
As long as price stays below this zone, a pullback is expected.
Target:
Downside Tar
XPTUSD 30m: Breakout Continuation – Holding Above Reversal PointPlatinum has made a strong move and is currently showing a clear breakout structure on the 30-minute timeframe.
Key Observations:
Price has broken out of the recent consolidation zone (highlighted in red and labeled “Breakout”).
A strong demand zone is marked as Reversal Point around 1485 – 1495.
Structure remains bullish with higher highs.
Trade Idea (Bullish Bias):
As long as price holds above the Reversal Point, the bias remains bullish.
Continuation to the upside is favored after the breakou
Platinum (XPTUSD) – Bullish Reversal from Triangle, Targets 1450Walk us through what you're seeing, why it matters, and what you expect next:
Price formed a clear descending triangle after the drop into point A.
Strong rejection from the low at A and recovery through B shows buyers stepping in.
The triangle is now breaking to the upside. The marked Reversal point (horizontal resistance zone around 1455–1460) is the key level.
Targets:
First target near the previous swing high / measured move
Second target around the 1455–1460 resistance zone
As long as price
Platinum 4hr Bullish Divergence – Potential Trend ReversalPlatinum has been consecutively forming Lower Lows and Lower Highs on the 4hr timeframe, maintaining a clear bearish structure. However, while price is forming another Lower Low, the RSI is holding a Higher Low, creating a bullish divergence. This suggests that bearish momentum may be weakening despite continued downside price action, potentially signaling a recovery or a possible bullish reversal if confirmed by price action.
Platinum Under Heavy Selling Pressure — Can Key Support Trigger Hello everyone, and welcome back to all my TradingView followers! 👋📊
Today, we are taking a closer look at **Platinum / XPTUSD** — a market that has experienced a significant correction after a powerful previous rally, with selling pressure now clearly visible on the daily chart.
## ⚪ Fundamentals | Platinum
Platinum is not only a precious metal; it is also an important industrial commodity used in **automotive catalysts, chemicals, glass manufacturing, electrical applications, medical techno
Platinum Stalled in Its S0.184 Zone. 65% Odds of 1,495 FirstTuesday, Wednesday, today. Three days on platinum's weekly grid.
The grid
Last week ran from 1,650.53 to 1,526.33 and closed at 1,537.50:
PP 1,571.45 · S0.184 zone 1,542.14 – 1,553.32 · S0.382 1,524.01 · S0.618 1,494.70 · S0.702 1,484.26 · S1 1,447.25
Tuesday: a flush to 1,474.64. That tagged 1,485, the target of my Q4 platinum short from the same morning.
Wednesday: the bounce reached 1,543.53, inside the S0.184 zone, and stalled there.
Today: back under S0.382 and trading near 1,503.
What t
Platinum Got Rejected at Its Q4 Pivot. Is 1,485 Next?Platinum got exactly one look at its Q4 pivot this quarter. It lasted one week.
The Q4 map comes from the Q3 range on weekly bars: high 1,926.18, low 1,547.69, close 1,682.27. That puts the quarterly pivot at 1,718.71, S 0.382 at 1,574.13, the S 0.702 zone at 1,421 to 1,485, and S 1 at 1,340.22.
In the first week of October platinum reached 1,729.15, ten dollars above the pivot, and closed back at 1,673. Since then every weekly close has been lower: 1,673, 1,619, 1,537.50, and around 1,508 so
Strategy Overview: XPTUSD Long CFDs with 1400 / 1200 Long Putshis configuration couples a leveraged directional long exposure via Contracts for Difference (CFDs) executed through ACY Securities ( acy.com/en?affiliate=LTD149986 ) with a defined-risk downside protective collar utilizing long put options anywhere in the 1400 / 1200 range. With my underlying spot platinum benchmark tracking near the 1,552.31 region, this layout captures upside continuation while establishing a structured macroeconomic risk floor.
Key Structural Components
Underlying Asset: Sp
Platinum – The Shine Slips as Bears Eye $1,290.64Platinum remains in a downtrend, with rallies struggling beneath descending resistance. Sellers still hold the upper hand.
📊 Technical analysis
Classic Triple Top formation, with price testing the neckline around $1,700.
Now that it's broken below the 20MA and 200MA and tested and rejected the major downtrend since JAN 2026 - We have a potential next target
🎯 Target: $1,290.64 per ounce
⚙️ Fundamental analysis – What is Platinum?
Platinum is a precious metal used in vehicle catalytic con
XPTUSD (Platinum) BUY Setup | Bullish RSI Divergence & Trend RevXPTUSD (Platinum) is showing a potential bullish reversal on the 4H timeframe after forming a clear bullish RSI divergence at a strong support zone, indicating that bearish momentum may be fading. Price has started to form a higher low, increasing the probability of an upside continuation if buyers maintain control above the entry level. My trade plan is Buy at 1643.80, with a Stop Loss at 1529.19, Take Profit 1 at 1745.41, and Take Profit 2 at 1862.12. As always, this is my personal technical a
Platinum – Daily Timeframe AnalysisOn the daily timeframe, platinum has successfully broken above the major resistance zone between $1,500 and $1,600 and is now trading within a higher price range.
Following this breakout, the $1,700 area can be considered an important support zone within the new trading range. As long as price remains above this level and the bullish structure is maintained, the next potential upside targets are around $1,900 and $2,000.
This bullish outlook is also supported by broader fundamental factors, in
XPT/USD: Platinum Outlook — EMA50, Momentum & Key ResistanceTHIEF TRADER | XPT/USD — THE PLATINUM HEIST 💎
📅 Date: 07 September 2026 | 🕐 London Time (BST)
━━━━━━━━━━━━━━━━━━
🎯 TRADE SETUP AT A GLANCE
━━━━━━━━━━━━━━━━━━
🏷️ Asset : XPT/USD — Platinum Spot vs US Dollar
📆 Trade Style : Day Trade / Swing Trade
📈 Direction : LONG (Bullish)
🕯️ Confirmation TF : Daily Chart — EMA 50 Bullish Alignment
💰 Live Spot Price : ~$1,836 per troy ounce (CFD, BST 07 Sep 2026)
📊 Today's Range : $1,708 – $1,907 (intraday reference, CFD data)
🏆 52-
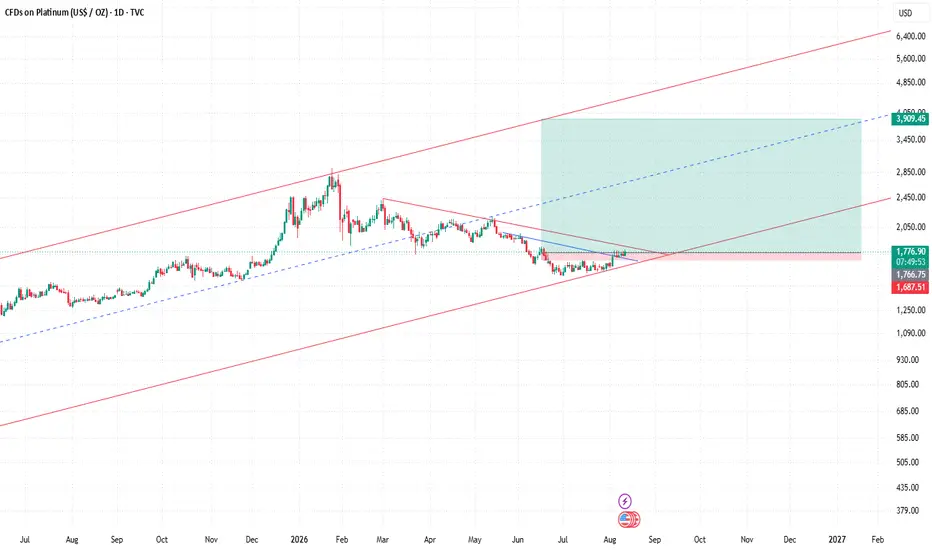
PLATINUM: Bull-Flag Formation, Decisive Breakout Incoming!Hello Community,
welcome to my new analysis about PLATINUM (XPTUSD). With this symbol, I have detected interesting signs that have the potential to lead to a major trading opportunity in the upcoming times. Therefore, I have identified all the pivotal factors to consider with XPTUSD.
When looking at my chart, we can see how XPTUSD is forming this gigantic bull-flag formation. XPTUSD has also already bounced within the ascending trendline support, matching the 200-MA support marked in blue. Fr
PLATINUM Strong Sell Signal within the 2026 Channel Down.Last time we looked at Platinum (XPTUSD) was almost 5 months ago (April 17, see chart below) giving a Sell Signal on the 0.618 Fibonacci retracement level that eventually hit our $1750 Target:
The price hit the 0.618 Fib yet again recently (August 21), which also happened to be on the 1D MA200 (orange trend-line) and got rejected. The 1D MA50 (blue trend-line) is the only Support standing (breaking below confirms the Signal) before a 1W MA100 (red trend-line).
If the break-out does happen,
Platinum (XPTUSD) LONG — 1D ALMA Setup (WR 75% · avg RR 1.6)CAPITALCOM:XPTUSD · 1D · long only.
(Context: platinum spot CFD — precious + industrial / auto-catalyst hybrid via USD, growth, and metals risk appetite — not a discretionary “buy the platinum dip” call.)
═
█ RESEARCH HUB
Category: Commodities sentiment 47.8 (Neutral) — built from 67 locked notes (26 constructive / 14 risk-off / 23 mixed); ticker verdicts +7 / −20. Drivers skew energy / softs two-way, not a platinum-only dossier.
Sector: Commodities · Metals 41.9 (Fear) — thin slee
Platinum | Strong Buy ICI Strategy
Platinum is looking like a strong buy.
Strong inpulse, followed by a retracement to the 38% fib.
Confluence, bounced off the support level which is aligned with the moving everage. Alongside this all three moving averages point upwards which is very bullish.
Targets:
1st Target: 1940
2nd Target: 1985
Platinum Wave Analysis – 21 August 2026
Platinum: ⬆️ Buy
– Platinum broke resistance zone
– Likely to rise to resistance level 2000.00
Platinum recently broke the resistance zone between the resistance level 1835.00 (which has been reversing the price from June), resistance trendline from March and the 61.8% Fibonacci correction of the downward impulse from June.
The breakout of this resistance zone accelerated the active intermediate impulse wave (3).
Platinum can be expected to rise further to the next round resistance level
Platinum (XPTUSD): wedge breakout — the real test starts now🇬🇧 English
On the daily, Platinum found support at the old Monthly Close and prior low and bounced. The falling wedge broke to the upside, the old monthly close is reclaimed and price is back above the EMA50, with RSI over 50. It's now testing the EMA200 together with the upper Bollinger band and the OB- 1D zone — the area where the move up could stall. As long as the reclaimed levels hold, the structure looks healthier; a drop below brings the old monthly close back into play.
On the 4H we s
Platinum (XPTUSD): wedge breakout — the real test starts now🇬🇧 English
On the daily, Platinum found support at the old Monthly Close and prior low and bounced. The falling wedge broke to the upside, the old monthly close is reclaimed and price is back above the EMA50, with RSI over 50. It's now testing the EMA200 together with the upper Bollinger band and the OB- 1D zone — the area where the move up could stall. As long as the reclaimed levels hold, the structure looks healthier; a drop below brings the old monthly close back into play.
On the 4H we s
Platinum: The Most Atrractive Metal Setup Right NowAs for platinum, I currently see an interesting buying opportunity in this metal.
The stop-loss can be kept relatively tight (1737), which makes the setup attractive from a risk-management perspective. I also like the fact that today platinum managed to break above the previous highs. The price had been trading within a range for quite some time, and today we finally saw a breakout.
The price has pulled back since then, but I still believe platinum has upside potential. It has also been consol