Trading Decoded | #4: Signal vs. Noise One of the biggest turning points in my trading journey wasn't finding a better strategy—it was learning to ignore more of what I was seeing.
Early on, every candle looked important. Every breakout demanded attention. Every headline felt like it could change the market. The more information I consumed, the more confident I thought I was becoming. In reality, I was reacting to noise instead of reading the market.
Financial markets produce an endless stream of price movements, news, opinions, indicators, and social media commentary. The challenge isn't finding more information—it's identifying what actually matters. Professional traders understand that not every move deserves a reaction. Sometimes the highest-quality decision is to simply wait.
The difference between signal and noise isn't always obvious. Noise is the random fluctuation that distracts you from your plan. Signal is the information that aligns with your strategy, your market context, and your risk management. Confusing the two often leads to overtrading, emotional decisions, and inconsistent results.
Experience has taught me that profitable trading isn't about reacting faster than everyone else. It's about filtering better than everyone else. The less unnecessary information you allow into your decision-making process, the clearer the market becomes.
In this fourth chapter of "Trading Decoded", we'll explore how to separate meaningful market signals from everyday noise, why information overload can quietly damage your performance, and how developing a strong filtering process can lead to calmer, more consistent trading.
The market will always be noisy.
Your edge comes from knowing what deserves your attention—and having the discipline to ignore everything else.
In-depth trading ideas
XRP: Be Realistic. Demand The Impossible RP spent years compressing inside a large structural triangle. The first version of this pattern ended with the 2017 expansion. The current structure is larger, longer and built across an entire market cycle.
The major resistance line has already been broken. What followed was not immediate continuation, but a deep retracement back toward the former breakout region and rising macro support. This is where long term structures are tested.
The 10 day RSI has now fallen into oversold territory near levels previously associated with major XRP accumulation zones. Price is weak, sentiment is exhausted and most of the expansion has been erased, but the larger breakout has not yet been structurally invalidated.
The realistic expectation is volatility, further testing and a difficult recovery. The impossible expectation is that this entire multi year structure eventually resolves into a move far beyond the previous cycle highs.
XRP does not need to look strong here. It needs to survive the retest. A recovery from this region would turn the current decline into a post breakout reset rather than the beginning of structural failure.
XRP/NVIDIA Ratio
OVERSOLD !
XRPUSD: Failed to recover the 1W MA200, targets a $0.8500 bottomXRP remains heavily bearish on its 1W technical outlook (RSI = 34.670, MACD = -0.231, ADX = 23.487) as not only is its 1 year Channel Down (since its Cycle Top) holding, but has failed to recover and close above its 1W MA200 for the past 2 months. This is a similar bearish development as the second half of 2019 and 2022. It was the 1W MA450 that held, turned into a macro-Support and priced the Cycle bottoms. Right now that range is between 0.8500-0.8000. That is technically a strong long term buy entry for the upcoming Bull Cycle in 2027 - 2029.
## If you like our free content follow our profile to get more daily ideas. ##
## Comments and likes are greatly appreciated. ##
XRP PERPETUAL TRADE SELL SETUP Short from $1.1450XRP PERPETUAL TRADE
SELL SETUP
Short from $1.1450
Currently $1.1450
Targeting $1.0920 or Down
(Trading plan IF XRP go up to $1.18
will add more shorts)
Follow the notes for updates
In the event of an early exit,
this analysis will be updated.
Its not a Financial advice
XRP/USD: Below Lower Band in Downtrend, 1.0831 Swing Is the LineXRP's trading at 1.0882 on the 4H and it's sitting below the lower volatility band (1.0910), with EMA21 at 1.1091 and EMA55 at 1.1103 stacked overhead. Trend bias flipped to Downtrend and price is pressing right into the last swing low at 1.0831 — that line has held for 30 bars and it's the only thing between here and the window low at 1.0092. The old bullish BoS at 1.1302 from 24 bars ago is stale now; the tape has since drifted back through both EMAs and out the underside of the band, which is textbook exhaustion of that earlier break. Two paths worth watching. First, a mean-reversion attempt: with price extended below the band, a snap back toward EMA21 near 1.1091 is the natural first move if 1.0831 holds on a 4H close. The setup activates on a reclaim of 1.0910 (band lower) with follow-through into the EMAs. Invalidation is a clean 4H close below 1.0831 — lose the swing low and the structure opens up toward 1.0092. Targets: 1.1091 (EMA21 magnet), 1.1103 (EMA55 backbone, the real test), and 1.1272 (band upper, where any bounce likely runs out of room). Downside continuation targets 1.0092 if the swing gives way.
Setup: Watching the 1.0831 swing low — a hold and reclaim of 1.0910 sets up a mean-reversion push into the EMAs; a 4H close below 1.0831 opens 1.0092.
Invalidation: 4H close below 1.0831 flips the structure toward the window low at 1.0092.
Targets: 1.1091 — EMA21 magnet after band-extension snap-back · 1.1103 — EMA55 trend backbone, the real test on any bounce · 1.1272 — band upper, where extended moves typically stall
eXRP/USD Bullish Breakout Eyes 1.1566 Resistanc
XRP/USD has broken out of its recent consolidation range and is showing strong bullish momentum above the Ichimoku Cloud, signaling that buyers are firmly in control. After spending several sessions ranging within a defined accumulation zone, price has pushed higher with increasing strength and is now approaching the next major resistance area. As long as price holds above the breakout region and the Ichimoku Cloud continues to provide support, the bullish structure remains intact. A successful continuation could drive XRP toward the highlighted supply zone.
🎯 Target: 1.1566
XRP/USD: Bearish BoS Under 1.0850 Keeps Pressure on EMA55XRP is doing its best to look green on the day, but the 4H structure tells a different story. Trend bias on the STC panel reads Downtrend, price at 1.0884 is squeezed between EMA21 at 1.0820 and EMA55 at 1.0948, and the last confirmed event on the chart is a bearish BoS 8 bars ago through the 1.0850 swing low. That swing has flipped from support to overhead friction, which is why every bounce this week has stalled inside the upper half of the band.
What makes this interesting is the location. EMA55 sits just above at 1.0948 and the band upper caps price near 1.1021, so the reaction into that zone is the tell. The prior swing high at 1.1167 is still open and still drawn on the chart 14 bars back — sellers haven't been challenged there yet. As long as EMA55 keeps rejecting closes, the bearish BoS remains the working narrative and the path of least resistance points back toward the band lower.
The setup activates on a clean 4H rejection at EMA55 / 1.0948 or a failed retest of the 1.0850 broken swing. If price instead closes above 1.1021 with follow-through, the bearish read is done — that's the line in the sand. Downside levels to watch: 1.0619 as the first magnet at band lower, 1.0092 as the window low, with 1.0850 acting as the pivot on the way down. Reclaim of EMA55 flips the tone.
Setup: Rejection at EMA55 (1.0948) or failed retest of the broken 1.0850 swing keeps the bearish BoS in play.
Invalidation: 4H close above 1.1021 (band upper) invalidates the bearish structure.
Targets: 1.0619 — band lower, first magnet · 1.0092 — window low, extended objective · 1.0850 — pivot flip, intraday reference
XRP Monthly SupportXRP price action is currently trading at a significant high-timeframe technical region, with the monthly support located around $1.09 acting as the key level to watch. This area has historically attracted buying interest, and the current reaction suggests the market may be entering an accumulation phase after an extended period of selling pressure. As long as buyers continue to defend this support, the broader market structure remains constructive despite the recent volatility.
The $1.09 level now represents the line in the sand for bulls. Holding above this support would reinforce the idea that the recent weakness is simply a correction within a larger trading range rather than the beginning of a sustained downtrend. Continued consolidation above this region would also allow momentum to rebuild before the next directional move develops, with buyers gradually absorbing supply at this key monthly level.
If XRP can maintain acceptance above monthly support, attention shifts toward the upper boundary of the range near $1.33. This monthly resistance represents the next major objective and could provide a rotational move higher as buyers regain confidence. A successful test of this resistance would confirm the continuation of the established trading range and strengthen the medium-term bullish outlook.
Until either support or resistance is decisively broken, XRP is likely to remain range-bound. Traders should closely monitor price action around $1.09, as continued acceptance above this region keeps the probability of a move toward $1.33 firmly in focus.
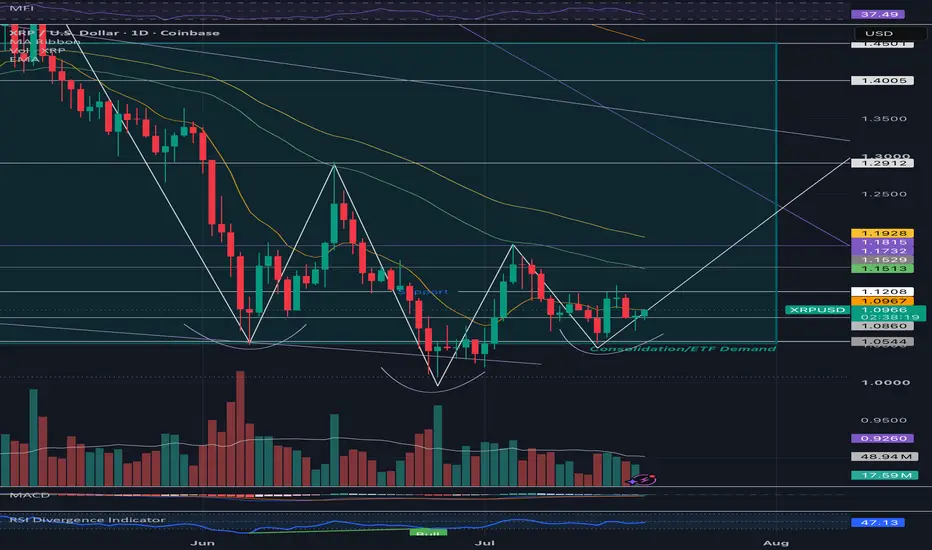
Xrp breaking out from its falling wedge forming inverse H&S XRP Technical Summary (Daily Chart – ~$1.09)
XRP is infalling wedge consolidation around the $1.08–$1.10 zone, with price coiling between converging downward-sloping trendlines. This bullish pattern shows narrowing volatility after the longer-term decline, with the green “Consolidation/ETF Demand” box highlighting strong institutional support near $1.05–$1.15.
Overlaying this is a potential inverse head & shoulders forming:
• Head at the recent low (~$1.05–$1.07).
• Shoulders on either side with higher lows.
• Neckline at ~$1.10–$1.12.
Key Levels:
• Support: $1.05–$1.07 (wedge bottom + demand zone).
• Breakout trigger: Close above $1.10–$1.12 (confirms inverse H&S + wedge breakout).
• Resistance: $1.15 → $1.18–$1.20.
• Targets (measured moves): $1.25–$1.35 (initial), $1.45–$1.55+ on full wedge expansion.
XRP/USD: Break Below 1.0253 Could Extend the Decline to 0.8789XRP has failed several times to break above the key resistance at 1.1718 and is now resuming its decline within the broader bearish trend.
A confirmed breakdown below 1.0253 could strengthen selling pressure and open the way toward 0.9277 and 0.8789. The developing flag pattern and weakening MACD support the bearish scenario, although the oversold Stochastic oscillator suggests that a short-term rebound remains possible.
The bullish scenario would become relevant only if XRP breaks and consolidates above 1.1718. In this case, the next targets would be 1.2695, 1.3671 and 1.4648.
Support: 1.0253, 0.9277, 0.8789
Resistance: 1.1718, 1.2695, 1.3671, 1.4648
XRP BREAKS OUT ⚡Hope everyone's doing alright today, as I write this we're getting hit with a flash flood so gonna go ahead with the lightning emoji for today in significance of today's storm.
⚡ I've attached our previous ideas for reference should anyone like to check them out for context. Following up from the last idea we we're watching this horizontal channel outlined in the yellow after we'd regained the 200 EMA.
⚡ Unfortunately we were unable to hold our position above $1.11 before retracing and reversing to test $1.07 though can identify the switch when those 20, 50 EMA's managed to converge and bulls were ultimately able to lay claim to the 200 EMA after bears failed to keep price action down, below the 200 EMA with bulls and purchase power far surpassing sellers as we broke out.
⚡ We've already noted the significance of the horizontal channel in the last ideas and here it's clear the role, contribution that played and made to our chart today as we broke out after exiting our horizontal channel, leaving bears and sellers in the dust.
⚡ As I write this we're sitting perched up at $1.15 though I would expect to see some retracement as we often experience following a breakout. I'll be watching the horizontal channel to see whether or not we enter the channel and resume this volatile game of tug and war or if we'll continue to hold the line above and establish support for a higher climb up.
⚡ Another potential factor is Ripple officially secured its full Crypto-Asset Service Provider (CASP) license from Luxembourg's Commission de Surveillance du Secteur Financier (CSSF) on July 6, 2026. Combined with its existing Electronic Money Institution (EMI) license, this definitive approval allows Ripple to offer regulated crypto payment, custody, and treasury services to financial institutions across all 30 countries of the European Economic Area (EEA) significantly broadening the companies deeper integration into the financial world by the day. That's hard to ignore alongside everything ongoing with the Clarity Act not to mention.
⚡ As things stand, I would watch $1.10 for support and keep an eye on the horizontal channel should we reenter the channel for a break up or below as we can see of past price action.
⚡ Have to go but thanks for tuning in, as I approach my Birthday this week I give thanks to many things including those that support and believe in me, and those that have stuck by my side through thick and thin. Grateful to everybody and may you have a blessed day.
Best regards,
~ Rock '
XRP/USD | Price Analysis Outlook | July 15, 2026
XRP is approaching a key decision zone where the next directional move is likely to be driven by volume confirmation rather than speculation. Price action remains highly sensitive to the broader crypto market, particularly Bitcoin's trend, institutional capital flows, and overall risk sentiment.
Bullish Scenario : A sustained breakout above immediate resistance could trigger momentum buying toward the next liquidity zone.
Bearish Scenario: Failure to hold support may invite fresh selling pressure, targeting lower demand levels.
🔑 Key Catalysts
₿ Bitcoin's price action and market dominance.
🏦 Institutional crypto inflows and ETF-related sentiment.
⚖️ Regulatory developments surrounding digital assets.
🌍 Global macroeconomic events, U.S. Dollar strength, and geopolitical tensions.
💸 Cross-border payment adoption and Ripple ecosystem developments.
Trade confirmations—not predictions. Let price lead, and manage risk with discipline.
Educational analysis only. Not financial advice.
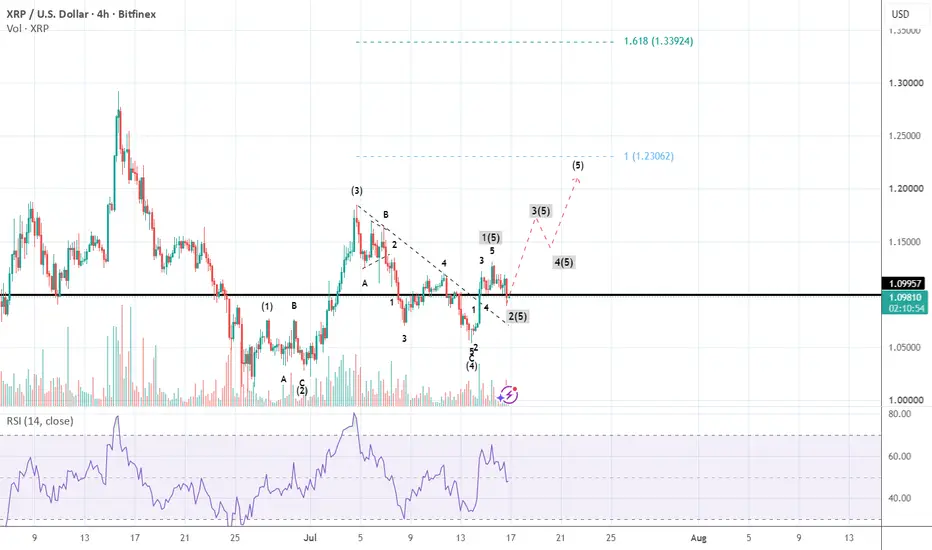
Ripple Elliott Wave AnalysisHello friends
In the Ripple cryptocurrency, we are witnessing the formation of a clear Elliott wave pattern.
In this pattern, waves 1 to 4, 1 of 5, and 2 of 5 have been completed, and now wave 5 has started.
So we will expect growth to the $1.23 range and a maximum of $1.4.
But an interesting point in this chart is that it is possible to count waves in such a way that the result is the opposite! And the price decreases without violating Elliott's rules!
But our opinion is in the price growth.
Be successful and profitable.
XRP/USD: Extended Above the Band, Swing High at 1.1302 Is the LiXRP's pushed itself above the upper volatility band on the 4H, printing 1.1316 with EMA21 at 1.1050 and EMA55 at 1.1005 sitting well below. Trend bias is up and price has crept just above the 1.1302 swing high that's been intact for 34 bars — but this is happening from an already-stretched position, band_upper sits at 1.1246 and we're trading outside it.
That matters because a clean break of a swing high that's held for that long usually needs a proper close through with ATR buffer, not a wick-tag while price is already extended. ATR14 is only 0.013, so the band is tight and reversion pressure is real. The healthier version of this move is a pullback to EMA21 near 1.1050 that holds, then a second attempt at 1.1302 — that's the setup worth waiting for.
The activation zone is a 4H close back above 1.1302 after price has cooled to EMA21 or at minimum drifted back inside the band under 1.1246. Chasing here into the band extension is where traders get shaken out.
Invalidation is a 4H close back below EMA55 at 1.1005 — that flips the trend backbone and puts the 1.0698 swing low in play.
Targets: 1.1500 as a round-number magnet once 1.1302 is reclaimed with structure, then 1.1923 which is the window high and the last real supply shelf before price would need fresh fuel.
Setup: 4H close above 1.1302 after a pullback to EMA21 at 1.1050 confirms the break of structure
Invalidation: 4H close below EMA55 at 1.1005 kills the setup and opens 1.0698
Targets: 1.1500 — round-number magnet once 1.1302 flips to support · 1.1923 — window high, the last supply shelf overhead
XRP/USD 1D — My Current Bullish BiasI'm currently leaning bullish on XRP/USD, but I'm still looking for confirmation from the price action.
The key level I'm watching is the yellow descending trendline. Price is currently testing this area, and if we get a clean breakout and close above this resistance, I believe we could see a continuation toward the upside.
The 0.236 Fibonacci level around 1.1376 has already been broken, which gives me more confidence in the bullish scenario.
My idea:
Break & close above the yellow trendline
⬇️
Potential push toward 0.382 Fib — around 1.2168 (TP1)
⬇️
If momentum remains strong, 0.618 Fib — around 1.3448 (TP2) becomes the next major target.
I'm also watching the recent price structure closely because it looks like a potential bottoming formation. If the breakout is confirmed, this could be the start of a larger reversal—but I want to see the trendline break and preferably a successful retest before getting too aggressive.
My bias: 🟢 Bullish above the yellow trendline
TP1: 0.382 Fib — 1.2168
TP2: 0.618 Fib — 1.3448
Invalidation: Failed breakout / rejection back below the breakout area
Let's see how XRP reacts at the yellow trendline. Breakout + confirmation could be the trigger I'm waiting for.
This is my personal market bias and not financial advice. Always manage your own risk. Follow me and share your ideas in the comment :)
Xrp - Preparing for a +200% bullrun!🔮Xrp ( CRYPTO:XRPUSD ) is testing a massive support:
🔎Analysis summary:
For the past couple of months, Xrp has been trading in a massive extended downtrend. But right now, Xrp is also about to retest a major confluence of support. If Xrp creates bullish confirmation at this area quite soon, we could witness a strong parabolic bullrun.
📝Levels to watch:
$1.0
Keep your #LONGTERMVISION🙏
— Phil (@TheTraderPhil)
XRP 4H Summary: Inverse head & shoulders forming on 4H Inverse Head & Shoulders forming in the falling wedge consolidation.
Neckline: $1.12–$1.15
Support: $1.05–$1.08 (ETF demand zone)
Confirmation: Close above $1.12 on volume
Targets: $1.18–$1.20 → $1.25+
Bullish setup aligns with daily chart. Watch $1.12 closely for breakout. RSI divergence supportive.
XRP PERPETUAL TRADE SELL SETUP Short from $1.1050XRP PERPETUAL TRADE
SELL SETUP
Short from $1.1050
Currently $1.1050
Targeting $1.0860 or Down
(Trading plan IF XRP go up to $1.15
will add more shorts)
Follow the notes for updates
In the event of an early exit,
this analysis will be updated.
Its not a Financial advice
XRP Coverage, on NC HAMMER CRYPTO multiple platformsIf you’ve been following along for the past year and a half, I’ve been covering XRP, XCN and XLM almost daily while referencing BTC for movements. Follow me on all platforms for up to date TA on many different cryptocurrencies.
Become a MEMBER get new coins before they take off, as well as coin requests covered. Many members have joined and profited over $700 within 4 days of being a MEMBER— keeping in mind 50% of all MEMBERSHIPS go to save animals lives. Invest $10 in your education, no $3000 courses, no BS or hype just TA day after day on where this market is going
Project XRP:The Global Financial Infrastructure Race AcceleratesLogan Ventures Research Executive Update
The Global Financial Infrastructure Race Accelerates: U.S. Policy Momentum, European Execution, and the Evolving XRP Thesis
Date: July 13, 2026
Executive Summary
The latest developments strengthen the core **Logan Ventures Research** thesis: the world has entered a **Global Financial Infrastructure Race** in which nations are competing to define the next generation of payment systems, capital markets, digital currencies, tokenized assets, and financial technology.
President Donald Trump's renewed public call for Congress to pass the CLARITY Act elevates digital asset legislation from a regulatory issue to a matter of national economic competitiveness. By linking digital assets and artificial intelligence to America's strategic competition with China, the Administration is signaling that financial infrastructure is increasingly viewed as an element of national power. Although Congress has yet to deliver comprehensive market-structure legislation, executive prioritization alone increases the probability that digital asset policy will remain a central U.S. strategic objective.
At the same time, Ripple's full authorization under the European Union's Markets in Crypto-Assets (MiCA) framework demonstrates that while the United States debates regulation, other jurisdictions are executing. Ripple now possesses one of the world's most comprehensive regulated operating platforms for institutional digital asset services across the European Economic Area.
Together, these developments reinforce—not weaken—the Logan Ventures Research outlook. The center of gravity for digital finance is becoming increasingly multipolar, with Europe, the Gulf States, Asia, and selected African economies advancing alongside the United States.
Strategic Assessment
1. The Global Financial Infrastructure Race Has Replaced the "Crypto Race"
Digital assets should no longer be viewed in isolation.
Instead, governments are competing across several interconnected domains:
* Digital currencies (CBDCs, stablecoins, tokenized deposits)
* Cross-border payment infrastructure
* Tokenized securities and real-world assets
* Institutional blockchain infrastructure
* Artificial intelligence integrated into financial systems
* Digital identity and programmable finance
XRP should therefore be evaluated not as a speculative cryptocurrency alone, but as a potential component within a broader global financial infrastructure transition.
2. President Trump's Push Changes the Strategic Narrative
The Administration's public support for the CLARITY Act has strategic implications beyond the legislation itself.
Even if congressional passage is delayed, executive support:
* Signals continued federal prioritization of digital assets.
* Encourages institutional planning and investment.
* Increases expectations for future regulatory clarity.
* Frames digital finance as part of America's long-term competition with China.
Markets frequently price expectations before legislation becomes law. While executive advocacy cannot replace congressional action, it reduces the probability that digital assets become a declining policy priority.
3. Europe Moves From Follower to Leader
Ripple's MiCA authorization represents one of the most significant regulatory developments in the company's history.
Benefits include:
* Immediate access across the European Economic Area.
* Regulatory certainty for institutional customers.
* Expansion of payments, custody, liquidity, and tokenization services.
* Greater confidence among banks and financial institutions seeking compliant digital asset infrastructure.
Europe has effectively become Ripple's largest regulated growth platform while U.S. legislation remains unresolved.
4. The Digital Currency War Continues to Expand
The competitive landscape now includes multiple strategic blocs:
United States
* Pursuing market-structure legislation.
* Expanding institutional participation.
* Positioning digital assets as a strategic technology.
European Union
* Implementing MiCA.
* Providing regulatory certainty.
* Attracting institutional capital.
China
* Expanding the digital yuan.
* Building alternative payment infrastructure.
* Reducing dependence on Western financial networks.
Middle East
* Accelerating tokenized finance.
* Investing heavily in blockchain infrastructure.
* Positioning regional financial centers for global capital.
Africa
* Continuing rapid digital payment adoption.
* Expanding fintech ecosystems.
* Presenting long-term opportunities for cross-border settlement and financial inclusion.
Rather than a single country leading the transition, the future financial system is likely to emerge from multiple competing regional ecosystems connected by interoperable settlement infrastructure.
Updated XRP Outlook
Near-Term (6–12 Months)
**Constructive but Moderately Cautious**
Positive factors:
* Continued ETF demand.
* Ripple's European expansion.
* Increasing institutional awareness.
* Growing global tokenization.
Negative factors:
* Delayed U.S. regulatory clarity.
* Slower participation from some American financial institutions.
* Continued market volatility surrounding legislative developments.
Overall assessment:
The absence of immediate U.S. legislation delays, but does not invalidate, institutional adoption.
Medium-Term (12–24 Months)
**Bullish**
Growth drivers include:
* Expansion of Ripple Payments.
* Higher XRP liquidity utilization.
* Continued tokenization of financial assets.
* Stablecoin ecosystem growth.
* Increasing cross-border payment demand.
* Expansion across Europe, Asia, the Middle East, and Africa.
Long-Term (2027–2031)
**Highly Constructive**
The long-term investment thesis increasingly depends on global adoption rather than any single legislative event.
Critical variables include:
* XRP liquidity demand.
* Institutional payment volumes.
* Tokenized asset settlement.
* Cross-border interoperability.
* Central bank and sovereign financial infrastructure modernization.
Updated Probability Assessment
| Scenario | Previous | Updated |
| ------------------------------------------------------ | -------: | ------: |
| CLARITY Act enacted during current Congress | 70% | 55% |
| Executive branch continues prioritizing digital assets | 80% | 95% |
| Europe remains Ripple's leading regulated market | 75% | 95% |
| Global tokenization continues accelerating | 90% | 95% |
| Long-term XRP utility thesis remains intact | 95% | 95% |
Logan Ventures Research Bottom Line
The market continues to overemphasize the importance of a single piece of U.S. legislation while underestimating the scale of the global transformation already underway.
President Trump's renewed advocacy demonstrates that digital assets have become part of America's broader strategic and economic agenda. Even so, Ripple is not waiting for Washington. Its expansion under Europe's MiCA framework illustrates how global financial infrastructure is evolving across multiple jurisdictions simultaneously.
For Logan Ventures Research, the defining trend is no longer simply a "Digital Currency War." It is a **Global Financial Infrastructure Race**—a decades-long competition to shape the architecture of digital money, tokenized assets, payment rails, and institutional settlement.
Within that broader race, XRP remains one of the few digital assets specifically designed to facilitate liquidity and cross-border value transfer. While delays in U.S. legislation may postpone portions of institutional adoption, they do not materially alter the long-term thesis. The investment question is shifting from **whether** digital financial infrastructure will emerge to **which platforms, jurisdictions, and interoperability networks will become foundational to the next generation of global finance.**
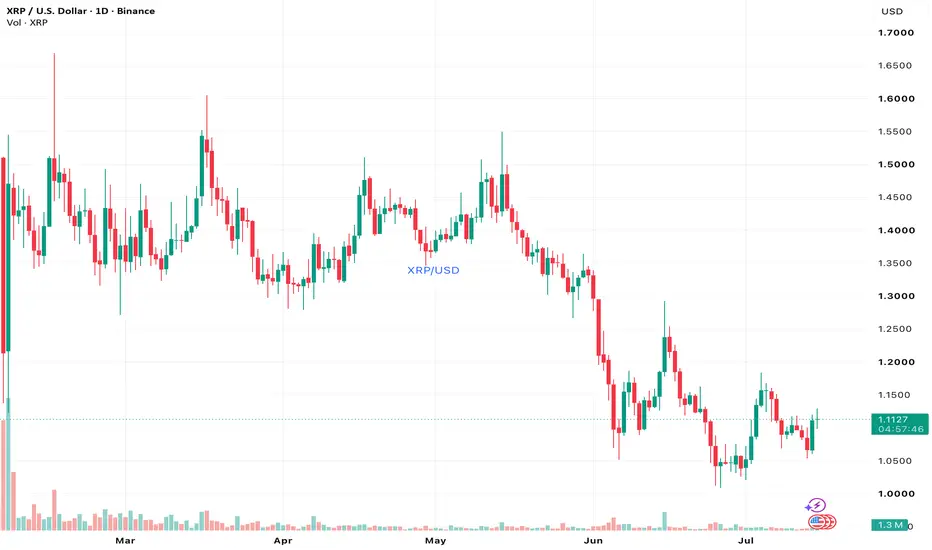
XRP/USD: Key Range Between $1.0200 and $1.1718XRP recovered toward $1.1200 after softer US inflation data supported demand for risk assets, but the broader outlook remains uncertain.
A confirmed break below $1.0200 could open the way toward $0.8789, $0.7812 and $0.6835. The bullish scenario requires a breakout above $1.1718, with targets at $1.3671 and $1.4648.
Until either boundary is broken, XRP is likely to remain inside the current sideways range.
Support: $1.0200, $0.8789, $0.7812, $0.6835
Resistance: $1.1718, $1.3671, $1.4648