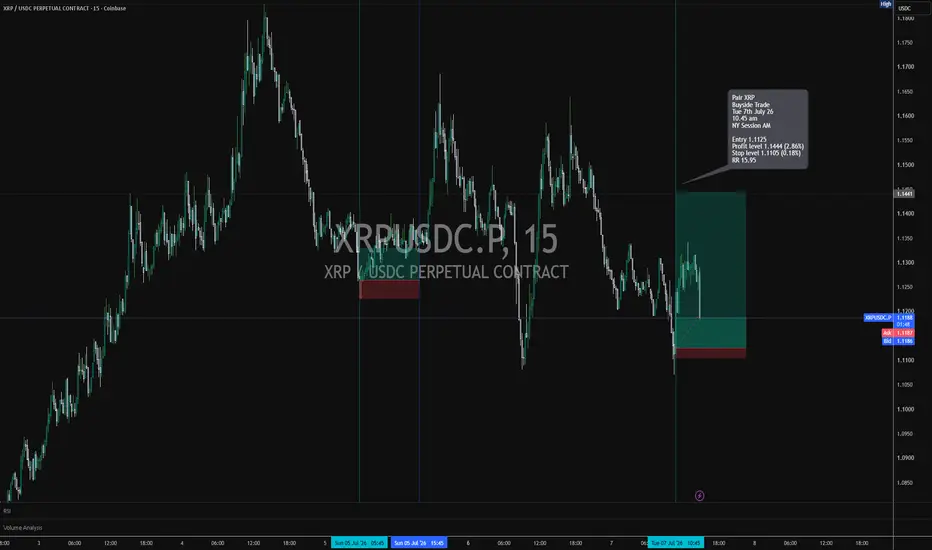
XRP/USDC: Institutional Accumulation Pattern📊 Strategy Overview: Volume-Driven Breakout Setup
This setup is based on on-chain order-flow divergence and volume profile analysis, not retail sentiment. The price action between $1.09–$1.10 shows signs of stealth accumulation, with sell-side imbalance noted at -11.8%. Declining volume suggests the
Compare with XRP / USDC Spot Trading Pair
The Market Is Showing Its HandMost traders wait for the move.
Professionals watch where the move is likely headed.
This asset continues to defend demand while repeatedly targeting the same liquidity pool above. That's not random—it's how markets seek liquidity.
✅ Demand remains respected.
✅ Liquidity remains untouched.
✅ Suppl
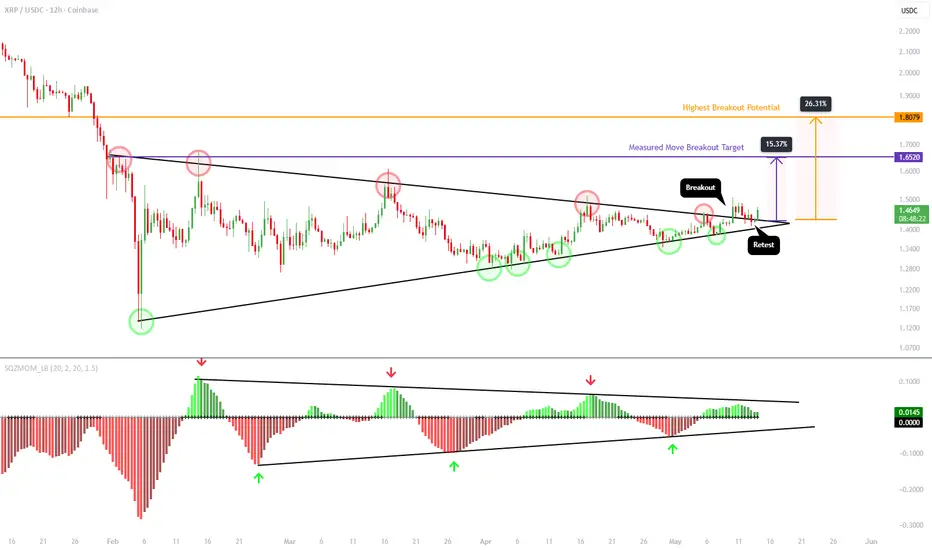
XRP - Breakout + RetestThis is an update to my last idea:
On May 5th I published that idea pointing out XRP was preparing for a massive breakout or breakdown from its symmetrical triangle. On May 9th the breakout occurred, followed by a bullish retest on May 11th-12th. XRP did close one 12H candle below the upper black
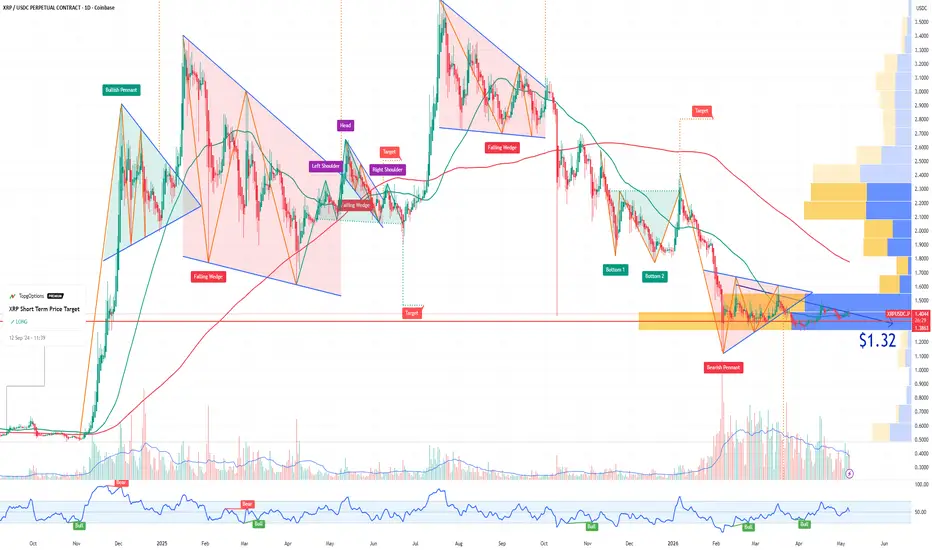
XRP Price TargetIf you haven`t bought XRP before the rally:
Technical vulnerability at key support: $1.32 has been the major bounce zone since February 2026, but XRP is showing repeated failure to break above $1.45–$1.50 resistance. A descending pattern and loss of $1.40 support could quickly send price back to t
XRP - Preparing for a Big MoveXRP is preparing for a massive breakout or breakdown from a symmetrical triangle that has been forming since early February.
There have been a clear series of lower highs (red circles) and a clear series of higher lows (green circles), with price now nearing the apex of the triangle where a decisiv
MA indicating strong buy on the 4hr chartMulti-Timeframe Breakout and Recovery Analysis
Analysis window: 3 Apr 2026, 20:00 - 16 Apr 2026, 08:48
Analysis of the provided chronological data indicates a transition from a macro downtrend into a firm consolidation phase, followed by a recent bullish breakout. The daily timeframe shows strong b
Flat Bottom in a Disjointed Channel within a Bear Marketwww.tradingview.com
Flat Bottom in a Disjointed Channel within a Bear Market
Introduction
In the realm of technical analysis, recognizing price patterns is essential for navigating the complexities of financial markets. One particular formation that traders may encounter in a bear market is the
Reverse Positionwww.tradingview.com
Reverse Position
The Reverse Position feature instantly closes your current position and opens an opposite one of the same size. For example, if you are long 2 contracts, reversing will place a sell order of 4 — 2 to close the long position and 2 to open a new short position.
XRP Has Yet to Find Its Bottomwww.tradingview.com
BINANCE:XRPUSDC
XRP has yet to find its bottom. While XRP whales are offloading their holdings in favor of Bitcoin - capitalizing on BTC's current price momentum - XRP remains firmly entrenched in a controlled bear market, leaving many long-term investors feeling trapped an
See all ideas
Summarizing what the indicators are suggesting.
Oscillators
Neutral
SellBuy
Strong sellStrong buy
Strong sellSellNeutralBuyStrong buy
Oscillators
Neutral
SellBuy
Strong sellStrong buy
Strong sellSellNeutralBuyStrong buy
Summary
Neutral
SellBuy
Strong sellStrong buy
Strong sellSellNeutralBuyStrong buy
Summary
Neutral
SellBuy
Strong sellStrong buy
Strong sellSellNeutralBuyStrong buy
Summary
Neutral
SellBuy
Strong sellStrong buy
Strong sellSellNeutralBuyStrong buy
Moving Averages
Neutral
SellBuy
Strong sellStrong buy
Strong sellSellNeutralBuyStrong buy
Moving Averages
Neutral
SellBuy
Strong sellStrong buy
Strong sellSellNeutralBuyStrong buy
Displays a symbol's price movements over previous years to identify recurring trends.