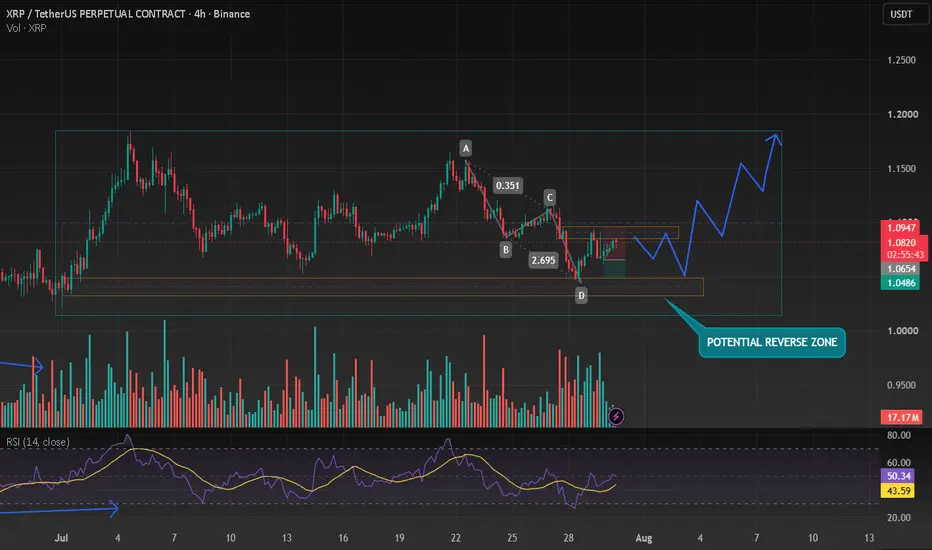
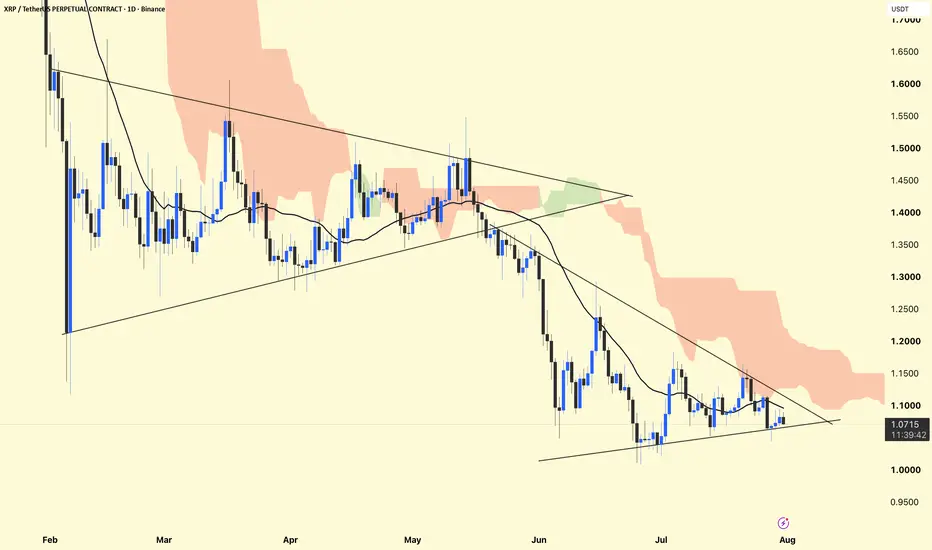
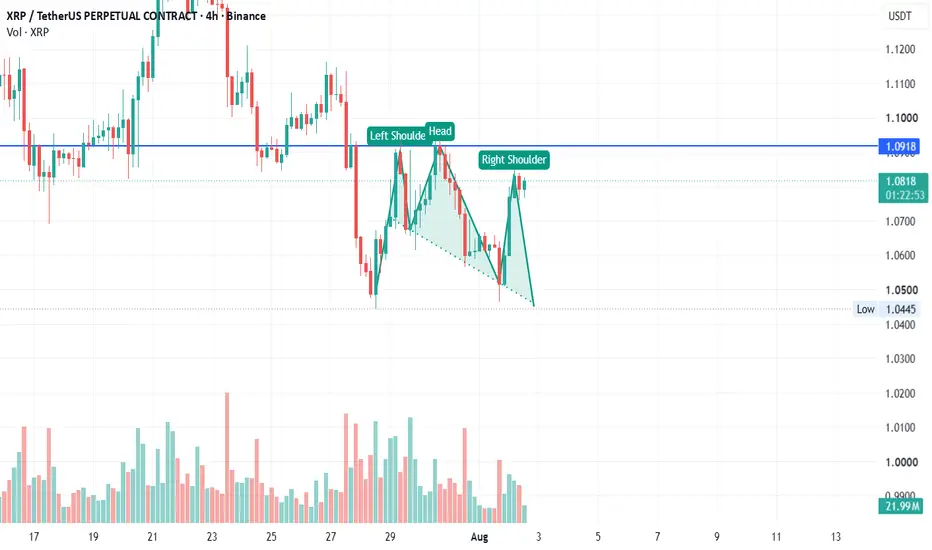
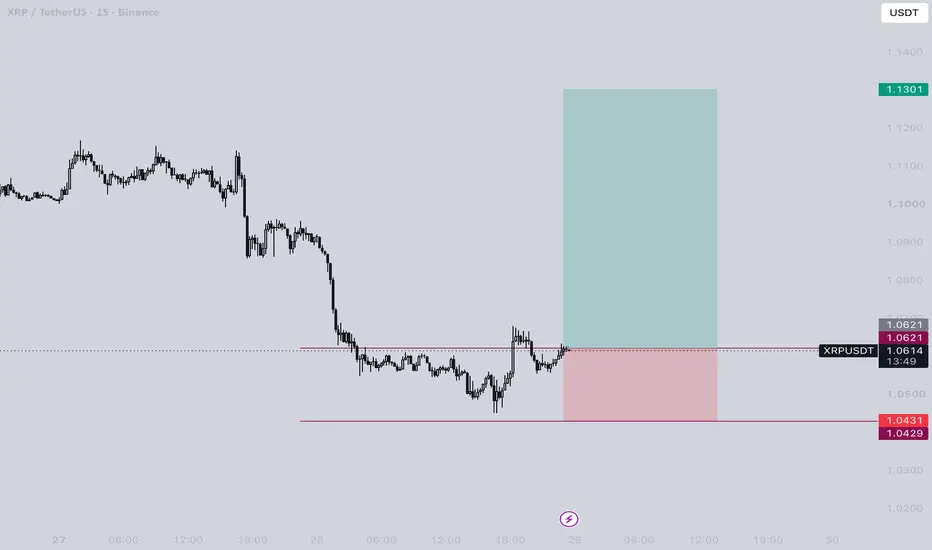
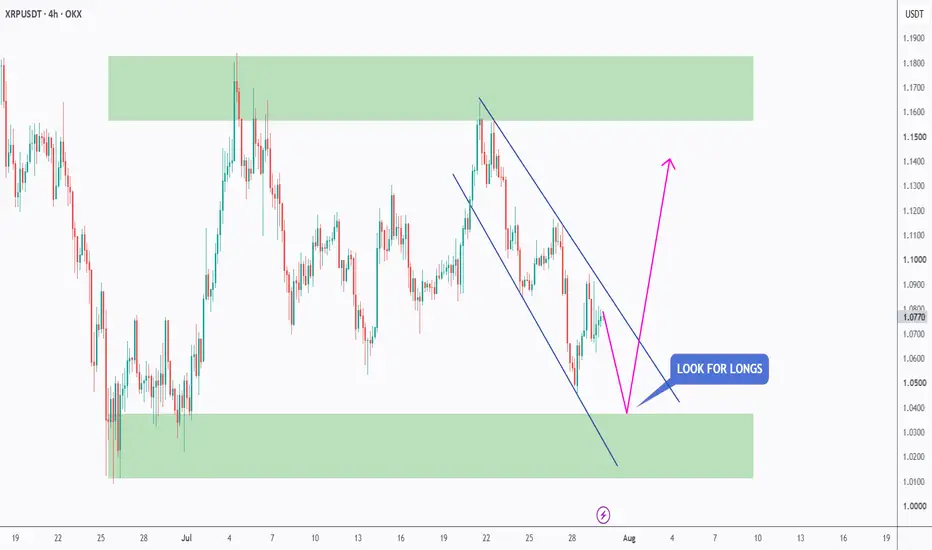
XRP - Oversold Zone Ahead!XRP is approaching a strong oversold area, where the psychological $1 round number aligns with the lower boundary of the falling channel. 📊
📌 As long as this confluence continues to hold, we will be looking for buy setups, anticipating a bullish rebound toward the upper boundary of the red channel.
The combination of a major round number and channel support makes this a high-probability area to monitor. Rather than buying blindly, we will wait for bullish price action confirmation before considering long positions.
Will buyers step in and defend the $1 level, or will sellers force a breakdown below this key support? 🤔
⚠️ Disclaimer: This is not financial advice. Always do your own research and manage risk properly.
📚 Stick to your trading plan regarding entries, risk, and management.
Good luck! 🍀
All Strategies Are Good; If Managed Properly!
~Richard Nasr
In-depth trading ideas
20X XRPUSDT Long trade-numbers—huge 4,400% profits potentialThis will be the riskiest trade ever public on XRPUSDT. It will also be the best ever—guaranteed. Why? Because we have great timing.
Good morning my fellow Cryptocurrency trader, I hope you are having a wonderful day.
When was the last time...
When was the last time that XRP traded at a market bottom? Were you able to spot and catch this bottom? No?
This is your chance.
Technical analysis
Here we have a double-bottom between June and August 2026. A double-bottom is a bullish reversal signal.
After this signal, we will see a very strong bullish wave. Knowing that we are coming out of a bear market, this bullish wave will extend after the next correction and transform into a long-term growth.
The numbers that you will see below are based on the mid-term. Trust the boss. We are going up.
_____
LONG XRPUSDT
Leverage: 20X
Potential: 4400%
Allocation: 3%
Entry zone: $0.98 - $1.04
Targets:
1) $1.25
2) $1.37
3) $1.57
4) $1.89
5) $2.12
6) $2.42
7) $2.74
8) $2.94
9) $3.26
Stop: Close daily below $0.98
_____
Thank you for reading. I am always wishing you the best.
Namaste.
XRPUSDT | 1H Technical Analysis...XRPUSDT | 1H Technical Analysis
The chart shows XRP trading inside a symmetrical triangle, with price compressing between a descending resistance trendline and a rising support trendline. This pattern suggests that volatility is decreasing and a breakout may determine the next directional move. The nearby support zone around 1.058–1.060 continues to attract buyers, while the descending trendline and horizontal resistance remain key obstacles for bulls.
📈 Bullish Scenario (Breakout Confirmation)
A confirmed breakout and close above the descending trendline could expose the following upside objectives:
🎯 Target 1: 1.090 – 1.092
Immediate resistance and first breakout objective.
🎯 Target 2: 1.115 – 1.118
Higher-timeframe resistance/supply zone.
Strong profit-taking area if bullish momentum continues.
📉 Bearish Scenario (Invalidation)
If price loses the triangle support and closes below 1.058, the bullish setup would weaken. In that case, the next downside levels to monitor are:
Support 1: 1.050
Support 2: 1.040
XRPUSDT | 1H | Technical Outlook
XRP is currently consolidating within a symmetrical triangle after a sharp decline, reflecting a temporary balance between buyers and sellers. Price continues to respect both the descending resistance trendline and the rising support trendline, indicating that a breakout from this structure may define the next short-term direction.
From a technical perspective, a confirmed move above the upper trendline would strengthen bullish momentum and shift attention toward the resistance region near 1.09. If buyers maintain control beyond that level, the next technical objective is located around 1.115–1.118, where previous selling activity may reappear.
On the downside, the lower boundary of the triangle and the nearby demand zone remain important support areas. A decisive break below this support would weaken the bullish structure and increase the probability of a move toward lower support levels.
Traders may consider waiting for a confirmed breakout or breakdown before forming a directional bias, while monitoring volume and price action around the key technical zones.
Key Levels
Resistance 1: 1.090–1.092
Resistance 2: 1.115–1.118
Support: 1.058–1.060
Bearish Invalidation: Below 1.058
XRP Incredible 10X LONG opportunity with 2020% profits potentialYou might not be reading this. If you are like most people, you already quit the market. If you are like most people, you will only see this, with great FOMO, once XRP reaches $3 or $4. At that time, there will be an incredible rush and impulse to buy. At that time, it will be wrong. Right now is the best timing possible.
XRPUSDT has the higher low within the current, local bottom structure. XRPUSDT is still trading within the extreme opportunity buy-zone, and this is happening as Ethereum reaches almost 2K.
What's up? Good! Nice! Great!
Some projects are already moving and momentum is starting to build up, it is only day one. Truly, this is the start—5-August 2026. Can be before or it can be after it makes no change. Give or take a few days, Crypto is set to grow for months. After the summer, during the fall.
Watch out! This is high risk.
Go all-in. You can win.
Would you like more details on the chart and market? It is the same setup since the start of the year, that is all I need to say.
When the market was bearish, we saw a bearish wave. As the market turned neutral, we are seeing months of sideways. The next logical step is a change of course... The market goes down, the market reverses then grows.
The down period only last several months, a year at the most. The bullish cycle tends to go for years with higher highs and higher lows. A bear market can easily last 1-2 years, a bull market can last 2-4. If it all starts now, how far up can XRP go by 2029 or 2030?
These are easy targets on the trade-numbers below:
_____
LONG XRPUSDT
Leverage: 10X
Potential: 2020%
Allocation: 5%
Entry zone: $1.0 - $1.09
Targets:
1) $1.25
2) $1.37
3) $1.57
4) $1.89
5) $2.12
6) $2.42
7) $2.74
8) $2.94
9) $3.23
Stop: Close weekly below $0.98
_____
Enjoy.
Your time, attention and energy is highly appreciated.
If you have anything to say, we have a comment section and direct messages.
If you want to show your support, you can do this easily by hitting follow.
Namaste.
XRP/USDT Technical Analysis (2H)📊 XRP/USDT Technical Analysis (2H) ⚡
🧠 Market Overview
XRP/USDT remains inside a well-defined descending channel, confirming that the broader market structure is still bearish. Price is currently hovering above a key support zone after rejecting from the marked Order Block (OB) and the channel's upper trendline.
The recent price action suggests that sellers are still in control, but buyers are defending the lower boundary of the channel, creating the possibility of a short-term liquidity sweep before the next directional move.
📉 Bearish Structure
✅ Downtrend remains intact with lower highs and lower lows.
📌 Strong rejection from the bearish Order Block.
🔻 Price continues respecting the descending trendline.
⚠️ Momentum remains weak below channel resistance.
🟢 Bullish Scenario
If the support around 1.045–1.050 holds, XRP could:
🔄 Sweep liquidity below support.
🚀 Reverse from the demand zone.
🎯 Target 1.08, followed by 1.10–1.12 (Order Block resistance).
🔴 Bearish Scenario
If support fails with a strong candle close:
📉 Sellers may extend the downtrend.
🎯 Lower support levels could become the next downside target.
⚠️ Any recovery is likely to remain limited unless the descending trendline is broken.
🎯 Key Levels
🟢 Support: 1.045
🔴 Resistance: 1.10–1.12 (Order Block)
📈 Major Resistance: 1.164
📉 Trend Bias: Bearish until a confirmed breakout above the descending channel.
💡 Trading Outlook
Patience is key here. The chart favors waiting for confirmation at support rather than chasing price inside the channel. A confirmed bounce could offer a high-probability long setup, while a breakdown below support would reinforce the existing bearish trend.
📌 Bias: 🟡 Short-term bearish, but watching for a bullish reversal from the support zone.
XRP PROPOSES NEW UPGRADECRYPTOCAP:XRP The U.S. Senate's path to passing the CLARITY Act, a major crypto market structure bill, hit a significant obstacle. Senate Majority Leader John Thune filed cloture on a different bill, consuming the limited floor time needed to advance the CLARITY Act before the August recess. The bill currently has 51 confirmed votes but needs 60 to proceed, with 7–10 Democrats potentially providing support. A key sticking point remains an ethics provision concerning state-level legal enforcement. Senator Cynthia Lummis warned that missing this window could delay comprehensive crypto regulation until 2030. This is bearish for XRP's near-term price sentiment because it prolongs the regulatory uncertainty in its largest market, potentially deferring institutional adoption decisions. However, the intense bipartisan negotiation highlights the growing political weight of the crypto industry. Developers submitted the "On-Chain Cosigner" proposal to the XRP Ledger Standards repository. It seeks to overhaul multi-signature transaction management by enabling native, on-chain coordination for collecting approvals. Currently, multisig participants must coordinate off-chain (e.g., via email), creating friction and risk. The proposal would allow a transaction payload to be stored immutably on-chain, with signers adding their signatures directly to the ledger until the threshold is met. This is bullish for XRP's long-term utility because it directly targets enterprise and institutional adoption barriers. By enhancing security and workflow efficiency for custody and treasury operations, it makes the XRPL more competitive for regulated financial use cases, which could drive sustained network demand. XRP's trajectory is being shaped by a stark contrast: while its underlying ledger is advancing with enterprise-ready features, its regulatory future in the U.S. is stuck in political limbo. Will on-chain innovation outpace the pace of legislation?
XRPUSDT Accumulation between levelsRipple is currently in one of its most interesting phases from an analytical perspective. The price is squeezed between daily resistance and weekly support, within which an accumulation has formed. This structure typically indicates a temporary balance between supply and demand, but such a situation typically cannot be maintained for long. The longer the market remains within a limited range, the higher the likelihood of a strong impulse move after breaking out of it.
Volumes are particularly noteworthy right now. Clusters indicate that both bulls and bears are gradually testing the market, assessing the other side's willingness to defend their levels. Neither side is yet ready to take the initiative, so activity is spreading within the accumulation without forming a stable trend. For this reason, any sufficiently large increase in volume could become a catalyst for a strong directional move, which could quickly develop into a full-fledged distribution.
Despite the ongoing balance, bulls still have a slight advantage. This is because the lower boundary of the range is weekly support, which has not yet been broken. Higher timeframe levels are traditionally stronger and more often attract major market participants, so holding this zone indicates continued demand and the bulls' willingness to defend their positions. As long as weekly support remains in place, the likelihood of an upside scenario appears somewhat higher, although it's still too early to talk about buyers gaining complete control.
Bears, meanwhile, continue to hold daily resistance and prevent the price from breaking out of accumulation upward. Their goal is to increase pressure, create an impulse breakout of support, and consolidate below it to change the current market structure in their favor. Bulls, on the other hand, need to take advantage of the higher timeframe level and confirm it with large volumes capable of breaking through the upper boundary of the range and shifting the market into an upward phase.
In such conditions, a sound risk assessment, rather than predicting the direction, is key. As long as the price remains within accumulation, the market maintains a neutral structure, and the likelihood of false moves remains elevated. Therefore, it is now crucial to closely monitor volumes and the nature of breakouts of key levels. A directional move, supported by large volumes, will be the main confirmation of which side has managed to take the initiative and is ready to set the next stage of XRP's movement.
$XRP: Situation Breakdown. 04/08 BYBIT:XRPUSDT.P
Friends, today's CRYPTOCAP:XRP breakdown is by subscriber request. Let me put it this way: the CRYPTOCAP:XRP setup is highly mixed right now. Price has been trading at 📊M-Levels (Institutional Interest Levels) monthly support for over a month. 🧩IMA shows that retail and 🐋WhalePOS (mid-tier players) are heavily long, while 🐋WhaleMAX (large players) are holding massive short orders. Meanwhile, price is consolidating in a tightening range. I see a slight lean to the long side here due to price sitting at support, but it is not enough for an entry.
Analysis from me — execution from you 🚀
⚠️ Platform restrictions limit the publication of closed indicators. I display only the output of the 📊Levels algorithm.
Analysis powered by IMA (Integrated Market Analysis)
📊M-Levels — Institutional Interest Levels | 🐋WhaleMAX — large players' positions | 🐋WhalePOS — mid-tier players' positions
Ripple (XRP). Ripple (XRP)
XRP fell by 3% this week and is back just above the $1 support level. This price action has also formed a pennant. That could highlight a continuation of the prevailing trend once the asset escapes it. In this case, that’s bearish.
The volume also continues to fall, forming clear lower lows. That’s not encouraging if buyers hope to reverse the ongoing downtrend. A break below $1 would settle the matter and see XRP make new lows, with $0.80 as a key target.
Looking ahead, best to wait for the pennant to break and then reassess. Until that happens, the price will compress at the apex of this formation before it escapes.
#XRPUSDT — Holding the Last Fortres, Recovery or Final Break#XRP
The price is moving within a descending channel on the 1-hour timeframe and has reached the lower boundary. It is now poised for a bounce and is expected to retest this boundary.
The Relative Strength Index (RSI) indicates a downward trend, which is likely to continue given the overbought conditions.
There is a key support zone in green at 1.03, and the price has bounced off this zone several times, making it a strong support level.
The price is trending towards the 100-period moving average, which we are approaching. This trend supports an upward move.
Entry Price: 1.060
Target 1: 1.071
Target 2: 1.082
Target 3: 1.092
Stop Loss: At the resistance zone in green
Remember this simple rule: Money management.
Any questions? Please leave a comment.
Thank you.
Possible Head & Shoulder for XRP, SELL after confirmationIt looks like XRP is forming head & shoulder and next bearish movement is coming.
Since the higher timeframe is downtrend and head & shoulder is also following the higher timeframe, i would take short from here and let's see.
In case of pattern failure, we followed higher timeframe and we can expect to wait a little bit more.
Right shoulder is not yet finished and is not completed, it can go more upward and being higher, manage your position and risk and ensure that you are not using big position, try to increase it as the pattern follows its ideal shape.
Hope money flows into your pocket everyday 💸💸💸
XRP: Short-Term Ascending Triangle BrokenXRP: Short-Term Ascending Triangle Broken – Dual Strategic Short Setups Around $1.00 Support Floor
XRP continues to unfold in exact alignment with our prior technical outlook as escalating sell orders cleanly sliced through the lower trendline of its short-term ascending triangle. However, this downward expansion temporarily paused, triggering a mild technical bounce directly ahead of the $1.00–$1.05 psychological round-number support floor. This reaction reflects localized dip-buying demand attempting to absorb immediate selling pressure.
Based on the visual data from the daily chart , the price action remains fully suppressed beneath the dynamic MA100 trendline resistance, confirming that bears maintain absolute macro control. The deceleration near the $1.00 handle renders chasing FOMO Short entries right here structurally sub-optimal from a risk perspective. This cooling-off phase is necessary to coil downward momentum for the next expansion leg.
Consequently, the safest trading strategy right now is to remain patient and await one of two tactical execution setups:
Scenario 1: Wait for a confirmed daily candle close decisively breaking below the $1.00 psychological support baseline to enter a trend-following Short position.
Scenario 2: Await a technical relief pullback retesting the newly broken triangle support boundary, executing a high-edge Short position with a tightly optimized stop-loss.
Disclaimer: This is not financial advice, DYOR.
XRP - Range Support Coming Into FocusXRP is approaching the lower bound of its trading range, an area where buyers have repeatedly stepped in to defend price. 📊
📌 As long as this lower boundary continues to hold, we will be looking for trend-following long setups.
This support zone represents an important decision area where the current correction could come to an end and the next bullish leg may begin. However, rather than anticipating the bounce, we will wait for price action to confirm that buyers are defending the support before considering any positions.
Will buyers defend the lower bound of the range once again, or will sellers finally force a breakdown? 🤔
⚠️ Disclaimer: This is not financial advice. Always do your own research and manage risk properly.
📚 Stick to your trading plan regarding entries, risk, and management.
Good luck! 🍀
All Strategies Are Good; If Managed Properly!
~Richard Nasr
XRPUSDT Analysis | Bullish OutlookHi
XRPUSDT appears overall bullish, although the current structure remains subject to the 1.0800 low and the reaction from the 1.1825 high, which keeps the present wave slightly bearish.
A higher low holding above 1.1015 could potentially shift the short-term tone back toward bullish continuation. Price is currently approaching a resistance area, where rejection remains possible.
If price loses the 1.1015 level, the move could extend toward the exposed lows below. A scenario like this is typically accompanied by sharp and volatile price action, i.e., spikey.
Happy Trading,
K
This analysis is for educational purposes only and does not constitute financial advice. Always conduct your own analysis and apply proper risk management
XRPUSD - Rank S Crypto to ShortI'm gonna tilt more than one maybe but right now ultra compressed candles 1h & 4H on a retest of a broken trendline
volume says a lot
Waterfall soon ? based on BTC behavior u can count on 22 days at least of dump
I dont have precise targets for now except the ultimate one : 0.7
purple lines on left were potential targets for this move up
My shorts are open from 1.39 to 1.46
invalid if 4H close above that line or new HH somehow will update
Cheers
xrpusdt longInstructions:
Entry point: yellow
Stop loss: red
Take profit: green
👉Leverage x 5-10-20 for crypto
👉Leverage x 20-50-100 for commodities, stocks, indices, and forex
👉Margin 1-5% max.
Always practice risk and money management.
Invest a maximum of 5% on any trade or across all your trades.
Invest only what you can afford to lose, as no one is in control of the market.
👉Our analyses are primarily based on:
breakouts: two trend lines (ascending and descending) and a line indicating a horizontal breakout.
chart patterns: shoulders and head, triangle parttern, elliott impulse, etc etc.
We don't always have the time to track them at all times or to represent them visibly, given the numerous signals, the number of channels to manage, and especially because of the often rapid pace of market movements.
indicators: We associate at least two indicators with this technique.
👉Depending on the circumstances, we use specific indicators, often setting 3 or more take profit levels.
👉Indeed, there are good days in trading and also bad days. No one can promise to win every trade, and like all traders worldwide, we also experience stop-loss orders. However, we win more than we lose and remain positive.
👉You can close the position before or after the take profit orders indicated by the green lines if you are personally satisfied; the same applies to stop loss orders.
👉We must stay positive, clear-headed, and humble.
we cannot provide all instructions or all trades here on this channel.
Good luck to us all, and may God guide us. Amen.
XRP - InvestmentplanMost people buy cryptocurrencies only after the major move has already started.
When the market is quiet, that is when you should develop a clear plan. The market structure shows us the key levels. Our job is to stay patient and wait for confirmation. 📊
🟢 Scenario 1 – Bullish Breakout
A breakout above the 1.18–1.20 USD area would be the first bullish confirmation.
After that, we wait for a pullback and look for a possible entry. 📈
The next important resistance is located between 1.25–1.31 USD.
If this zone is also broken and held, the key resistance area lies between 1.54–1.67 USD.
A breakout above this area would be very bullish. The next long-term target would then be the 2.10–2.40 USD area, where the long-term POC is also located. 🎯
🔄 Scenario 2 – Pullback into the Buy Zones
If XRP moves lower first, we will monitor the following areas:
✅ 1.04–1.10 USD
We do not buy blindly. In the marked zones, we wait for a higher high and clear bullish confirmation on the lower timeframes.
🚨 Critical Zone
A daily close below 1.00 USD would be bearish and significantly weaken the long-term plan.
On this channel, I will share potential entries and risk management step by step. 🔔
Wishing you success and stay blessed. 🙏
XRP: Trend Still Favours the BearsPrimary trend remains bearish
XRP continues to produce a series of lower highs and lower lows, keeping the primary trend firmly to the downside. Until that structure changes, rallies should still be treated with caution.
Moving averages reinforce the trend
The 100/50-day EMAs remain bearishly crossed, with price continuing to find resistance around those moving averages. This continues to reinforce the broader bearish outlook.
Momentum remains neutral
RSI continues to chop around the 50 level, reflecting the current lack of conviction from either side. Meanwhile, StochRSI is falling but has yet to reach oversold territory, leaving room for further downside.
Support remains critical
The $1.05 support area continues to hold the key. A break below this level would increase the likelihood of a retest of the $1.0092 swing low.
Resistance still stacked overhead
Even if bulls recover, the first hurdle sits around $1.18, while the much more significant resistance zone remains around $1.30. Bulls will need to reclaim both levels before the broader technical picture begins to improve.
In Summary
XRP continues to trade within a well-established primary downtrend, with lower highs and lower lows keeping the bears in control. The 100/50-day EMAs remain bearishly crossed, while momentum remains broadly neutral. Unless bulls can reclaim $1.18 and ultimately $1.30, rallies are likely to remain corrective. A break below $1.05 would increase the risk of another move towards the $1.0092 swing low.
Key Focus Is Whether the 1.1237–1.1475 Zone Can Hold as Support
Hello, traders.
Follow for more chart updates and trading insights.
***
## XRP Current Outlook
XRP is currently undergoing a correction after facing strong selling pressure in the 1.50 ~ 1.9669 resistance zone.
From a mid-to-long-term perspective, price is attempting to move back into a mid-term accumulation zone, and the next directional move will largely depend on whether 0.93 support can hold.
If XRP breaks below 0.93, it could enter a prolonged consolidation or extended correction phase, potentially requiring significant time before a meaningful trend reversal occurs.
In addition, the OBV indicator has fallen below its Low Line, making it important to monitor whether a volume-backed recovery can develop.
***
## Key Short-Term Level to Watch
The most important price zone right now is the HA-Low region between 1.1237 and 1.1475.
This area could attract buying interest in the short term and represents a critical level that XRP must reclaim in order to establish a new bullish wave.
***
### Scenario 1: Bullish Case
* Reclaim the 1.1237 ~ $1.1475 zone
* Turn the zone into support
* Buying pressure returns and a short-term rebound develops
* A breakout above $1.3524 strengthens the bullish trend reversal signal
If XRP successfully reclaims and holds the 1.1237 ~ 1.1475 support zone, a bullish trading bias becomes valid.
***
### Scenario 2: Bearish Case
* Failure to reclaim the 1.1237 ~ 1.1475 zone
* Sideways price action or renewed downside pressure
* Higher probability of a staircase-style downward structure
For now, it is better to wait for confirmation of a recovery above this zone rather than chasing price action aggressively.
***
## Trend Reversal Criteria
A simple bounce is not the same as a trend reversal.
For XRP to transition into a genuine bullish trend, price must first establish acceptance above 1.3524.
Afterward, XRP must break through the major Volume Profile resistance zone between 1.50 and 1.9669 to confirm a mid-to-long-term bullish trend.
Until then, a short-term trading approach focused on increasing coin holdings may be the more favorable strategy.
***
# XRP Trading Strategy
XRP has long been viewed as a strong long-term investment asset.
However, simple buy-and-hold strategies can create significant opportunity costs by tying up capital for extended periods.
Consider the following approach instead:
### Scale-In Strategy
* Avoid entering with full capital at once
* Build positions gradually at major support areas
* Maintain cash reserves for potential further downside
### Scale-Out Strategy
* Take partial profits after reaching predefined profit targets
* Use recovered capital to create future re-entry opportunities
For example:
* Sell part of the position after a meaningful price advance (around 50% gains)
* Recover all or a significant portion of the original investment
* Continue holding the remaining position for long-term upside
This approach allows traders to navigate market volatility while steadily increasing their XRP holdings over time.
***
## Trading Strategy Matters More Than Chart Analysis
Many market participants possess solid chart-reading skills yet struggle to generate consistent profits.
The main reason is often a lack of trading strategy and capital management discipline.
Ultimately, success comes from:
* Not chasing massive gains from a single trade
* Building a strategy that fits your account size and risk tolerance
* Consistently executing the same set of rules over time
The market always provides opportunities.
Rather than going all-in, managing risk through scaled buying and scaled selling can help increase holdings while preserving capital, leading to more stable long-term results.
***
Thank you for reading.
Wishing you successful trading and profitable setups ahead. 🚀📈