XTZ: local squeeze with $0.28 destinationThe Macro Picture 🗺️
XTZ unwound its May $0.40 highs through a steady descent that bottomed at $0.195 in early July. Since then the structure has shifted from trend to range — price is now rotating inside a $0.195–0.265 band, a volatility playground where the lows keep getting defended and the rallies faded back toward the middle. Price sits in the lower half near $0.23 with RSI balanced around 47. With the floor established and momentum neutral, buying into the lower portion of the range rather than chasing strength is the higher-confluence play, and the path of least resistance leans back toward the upper boundary.
The Setup ⚙️
The Buy Area: The $0.21–0.23 band has absorbed the recent dips. Bulls are defending the equilibrium, and as marked on the chart, price is holding above the $0.21 local support with room to rotate higher.
The Ceiling: The $0.265 decision line caps the range. A clean reclaim flips the local structure bullish and opens the path toward the $0.28 macro resistance above.
The Range Play: The zone between $0.21 and $0.265 creates a structural playground for grid-based accumulation — staggered entries across the range capture the chop while the market decides its next macro leg.
The Roadmap: Primary target sits at $0.28 — the green roadmap points there as price works up from the support toward the range top. Invalidation: a clean daily close below $0.195 would invalidate this bullish thesis and signal a structural breakdown out of the range.
More setups in profile.
#XTZ #CRYPTO #Tezos #Altcoins #TechnicalAnalysis
In-depth trading ideas
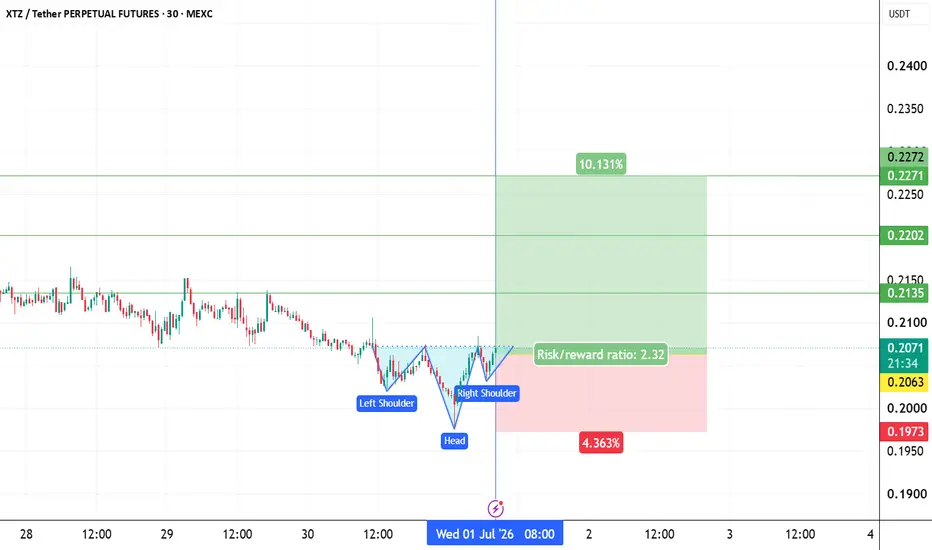
XTZUSDT LONGInstructions:
Entry point: yellow
Stop loss: red
Take profit: green
👉Leverage x 5-10-20 for crypto
👉Leverage x 20-50-100 for commodities, stocks, indices, and forex
👉Margin 1-5% max.
Always practice risk and money management.
Invest a maximum of 5% on any trade or across all your trades.
Invest only what you can afford to lose, as no one is in control of the market.
👉Our analyses are primarily based on:
breakouts: two trend lines (ascending and descending) and a line indicating a horizontal breakout.
chart patterns: shoulders and head, triangle parttern, elliott impulse, etc etc.
We don't always have the time to track them at all times or to represent them visibly, given the numerous signals, the number of channels to manage, and especially because of the often rapid pace of market movements.
indicators: We associate at least two indicators with this technique.
👉Depending on the circumstances, we use specific indicators, often setting 3 or more take profit levels.
👉Indeed, there are good days in trading and also bad days. No one can promise to win every trade, and like all traders worldwide, we also experience stop-loss orders. However, we win more than we lose and remain positive.
👉You can close the position before or after the take profit orders indicated by the green lines if you are personally satisfied; the same applies to stop loss orders.
👉We must stay positive, clear-headed, and humble.
we cannot provide all instructions or all trades here on this channel.
Good luck to us all, and may God guide us. Amen.
Xtzusdt long Instructions:
Entry point: yellow
Stop loss: red
Take profit: green
👉Leverage x 5-10-20 for crypto
👉Leverage x 20-50-100 for commodities, stocks, indices, and forex
👉Margin 1-5% max.
Always practice risk and money management.
Invest a maximum of 5% on any trade or across all your trades.
Invest only what you can afford to lose, as no one is in control of the market.
👉Our analyses are primarily based on:
breakouts: two trend lines (ascending and descending) and a line indicating a horizontal breakout.
chart patterns: shoulders and head, triangle parttern, elliott impulse, etc etc.
We don't always have the time to track them at all times or to represent them visibly, given the numerous signals, the number of channels to manage, and especially because of the often rapid pace of market movements.
indicators: We associate at least two indicators with this technique.
👉Depending on the circumstances, we use specific indicators, often setting 3 or more take profit levels.
👉Indeed, there are good days in trading and also bad days. No one can promise to win every trade, and like all traders worldwide, we also experience stop-loss orders. However, we win more than we lose and remain positive.
👉You can close the position before or after the take profit orders indicated by the green lines if you are personally satisfied; the same applies to stop loss orders.
👉We must stay positive, clear-headed, and humble.
we cannot provide all instructions or all trades here on this channel.
Good luck to us all, and may God guide us. Amen.
Xtzusdt longInstructions:
Entry point: yellow
Stop loss: red
Take profit: green
👉Leverage x 5-10-20 for crypto
👉Leverage x 20-50-100 for commodities, stocks, indices, and forex
👉Margin 1-5% max.
Always practice risk and money management.
Invest a maximum of 5% on any trade or across all your trades.
Invest only what you can afford to lose, as no one is in control of the market.
👉Our analyses are primarily based on:
breakouts: two trend lines (ascending and descending) and a line indicating a horizontal breakout.
chart patterns: shoulders and head, triangle parttern, elliott impulse, etc etc.
We don't always have the time to track them at all times or to represent them visibly, given the numerous signals, the number of channels to manage, and especially because of the often rapid pace of market movements.
indicators: We associate at least two indicators with this technique.
👉Depending on the circumstances, we use specific indicators, often setting 3 or more take profit levels.
👉Indeed, there are good days in trading and also bad days. No one can promise to win every trade, and like all traders worldwide, we also experience stop-loss orders. However, we win more than we lose and remain positive.
👉You can close the position before or after the take profit orders indicated by the green lines if you are personally satisfied; the same applies to stop loss orders.
👉We must stay positive, clear-headed, and humble.
we cannot provide all instructions or all trades here on this channel.
Good luck to us all, and may God guide us. Amen.
#XTZUSDT : Looking For Break of Structure | Bullish#XTZ
The price is moving within a descending channel on the 1-hour timeframe and has reached the lower boundary. It is now poised for a bounce and is expected to retest this boundary.
The Relative Strength Index (RSI) indicates a downward trend, which is likely to continue given the overbought conditions.
There is a key support zone (in green) at 0.3200. The price has bounced off this zone several times, making it a strong support level.
The price is trending towards the 100-period moving average, which we are approaching. This trend supports an upward move.
Entry Price: 0.3350
First Target: 0.3416
Second Target: 0.3482
Third Target: 0.3569
You can stop at the first and second targets and close below them, or continue towards the third target. Stop Loss: At the resistance zone (in green).
Remember this simple rule: Money Management.
Any questions? Please leave a comment.
Thank you.
XTZ Traps Sellers in Bullish Move !Price is compressed and currently trading in a CP structure.
The market is trading around a key level and we already have a bullish CH on the chart.
A trend line was broken and price moved below it, trapping seller liquidity before quickly reversing to the upside, which reflects bullish behavior.
We have two entry zones and the position can be managed using a DCA approach.
Targets are marked on the chart. Move to breakeven and secure partial profits at the first target.
A daily candle close below the invalidation level will invalidate this analysis.
If you would like us to analyze a coin or altcoin for you, first like this post, then comment the name of your altcoin below.
What is your opinion about XTZ?
XTZ/USDT — Descending Channel, Reversal or Further Drop?On the 2D timeframe, XTZ/USDT is clearly moving within a Descending Channel pattern, characterized by:
Consistent Lower Highs (LH) and Lower Lows (LL)
A descending resistance (upper trendline) and descending support (lower trendline)
Price currently moving in the mid-to-upper area of the channel
This indicates the market is still in a downtrend structure, but signs of a potential relief bounce are emerging.
---
📐 Pattern Explanation: Descending Channel
A Descending Channel is typically a bearish continuation pattern, but it can also act as an accumulation phase before a reversal if a breakout occurs.
Key characteristics in this chart:
Well-respected channel → high pattern validity
Multiple bounces from the channel support
Persistent pressure from the resistance trendline → critical breakout zone
---
📍 Key Levels
Strong Support: 0.33 – 0.34
Minor Resistance: 0.42 – 0.47
Major Resistance / Breakout Zone: 0.51 – 0.62
---
🚀 Bullish Scenario
A bullish move is likely if:
Price breaks out above the upper trendline
Supported by strong volume / momentum candles
Upside targets:
0.42 (nearest resistance)
0.47
0.51
0.62 (major resistance / primary target)
💡 A breakout from this channel could signal an early trend reversal or at least a strong short-term rally
---
📉 Bearish Scenario
Bearish continuation remains valid if:
Price fails to break out and gets rejected at the upper trendline
Continues moving downward within the channel
Downside targets:
0.34 (channel support)
If breakdown occurs → potential continuation to lower levels
⚠️ As long as price remains inside the channel, the bearish structure is not invalidated
---
📌 Conclusion
XTZ is currently at a critical point:
Breakout = bullish reversal opportunity
Rejection = continuation of downtrend
This is a key decision zone that will determine the next major move.
#XTZUSDT #CryptoAnalysis #TechnicalAnalysis #DescendingChannel #CryptoTrading #Altcoins #BullishScenario #BearishScenario #BreakoutWatch #PriceAction #SupportResistance #TrendAnalysis
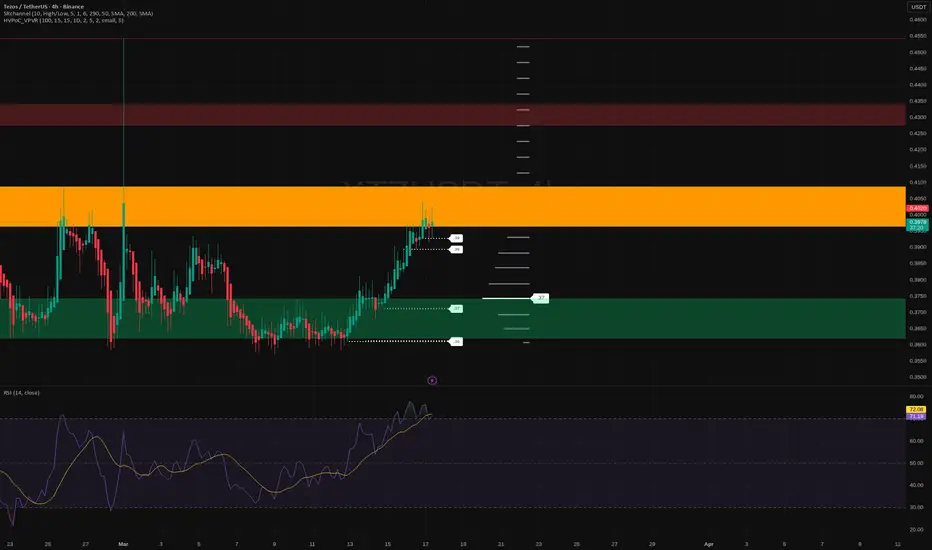
Tezos: fresh bounce or reversal? key levels to monitor todayTezos. Who’s farming this bounce? Lately, according to industry sources, Tezos has been back in the headlines thanks to fresh activity in its ecosystem and a broader pop in altcoin sentiment. Today price just smacked right into a big 4H supply block around 0.40–0.41, and the reaction is already showing on the candles.
On the 4H chart we’ve got a clean vertical run from the green demand area near 0.36 into that thick orange resistance, with RSI stretched above 70. Volume profile shows a fat node in the green zone and a clear low‑volume pocket in between, so any rejection up here can unwind fast. I’m leaning short term bearish from this supply, expecting a corrective leg back into previous demand as late longs get shaken out.
My base plan: look for rejection wicks and fading momentum in the orange zone, targeting a pullback toward the green band around 0.37 first, then possibly 0.36 if sellers really press. If bulls suddenly blast and hold above 0.41 with strong volume, that invalidates the short idea and opens the road to the next resistance near 0.43–0.44. I might be wrong, but for now I’m waiting for the liquidity grab up here to fade before jumping in.
#XTZ/USDT : Looking For Break of Structure | Bullish#XTZ
The price is moving within a descending channel on the hourly timeframe. It has reached the lower boundary and is heading towards a breakout, with a retest of the upper boundary expected.
The Relative Strength Index (RSI) is showing a downward trend, approaching the lower boundary, and an upward bounce is anticipated.
There is a key support zone in green at 0.3934, and the price has bounced from this level several times and is expected to bounce again.
The indicator is showing a trend towards consolidation above the 100-period moving average, which we are approaching, supporting the upward move.
Entry Price: 0.3967
First Target: 0.4020
Second Target: 0.4068
Third Target: 0.4131
Stop Loss: Below the green support zone.
Remember this simple thing: Money management.
For any questions, please leave a comment.
Thank you.
Tezos: bargain zone or falling knife? key levels to watch nowTezos - bargain zone or falling knife, what do you think? While majors are chopping around, Tezos keeps sliding as older PoS projects stay under pressure, according to market chatter about regulation and fading hype. Price has quietly pressed into a strong historical demand area that bulls defended before.
On the 4H chart we sit right on that support cluster around 0.37-0.38 with a fat volume node a bit higher near 0.41-0.42. RSI is below 40 but no longer printing fresh lows - early sign that sellers are tiring and a corrective pop is on the table. I lean toward a bounce long from this zone rather than chasing late shorts.
My base plan: as long as 0.37 holds, I like a rebound toward 0.42 first, then possibly 0.45 where the next supply band waits ✅. If price closes below 0.37 with momentum, that invalidates the bounce idea and opens the door to 0.34 and even lower - that would flip me to a short bias. I might be wrong, but for now I'm stalking entries near support and taking profits into the first sharp green candles.
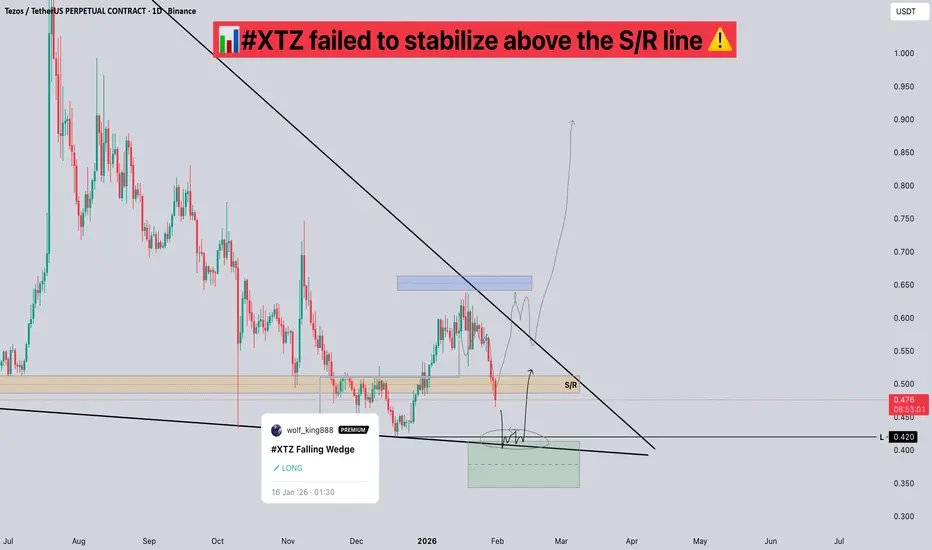
#XTZ failed to stabilize above the S/R line📊#XTZ failed to stabilize above the S/R line ⚠️
🧠From a structural perspective, we failed to stabilize above the S/R line, therefore no buy signal was generated here. Meanwhile, a bearish structure exists above, and the target area of this structure overlaps with the lower low L and the trend support line. Therefore, this area is considered an excellent entry point for long positions and deserves our attention.
Let's see 👀
🤜If you like my analysis, please like 💖 and share 💬
BINANCE:XTZUSDT.P
#XTZ Falling Wedge📊#XTZ Falling Wedge 🚀
🧠From a structural perspective, we've been in a downtrend on larger timeframes. The price is currently approaching its limit of consolidation; closely watch for a breakout and subsequent upward move.
➡️Currently near a resistance zone, if the price can return to the lower yellow support zone (S/R), we can look for long positions to potentially capitalize on a larger upward move.
Let's see 👀
🤜If you like my analysis, please like 💖 and share 💬
BINANCE:XTZUSDT.P
XTZ/USDT - Breakout: Relief Rally or Trend Continuation?XTZ/USDT on the Daily (1D) timeframe remains in a medium-term downtrend, clearly structured within a Descending Channel. Price action continues to respect this bearish structure, while the recent bounce from the lower boundary indicates a short-term relief rally rather than a confirmed trend reversal.
Volume remains relatively stable without significant expansion, suggesting that bullish momentum is still limited and primarily technical.
---
Pattern Explanation
Descending Channel (Bearish Continuation Pattern)
Formed by consistent lower highs and lower lows.
Price bouncing from the lower channel often triggers temporary recoveries.
As long as price remains inside the channel, the dominant trend stays bearish.
A valid trend reversal requires a strong daily close above the upper channel, ideally supported by increased volume.
---
Key Levels
Resistance Zones:
0.6160 → Minor resistance / mid-channel
0.7050 → Structural resistance
0.7960 → Previous breakdown & supply area
0.9060 – 1.0700 → Major resistance zone
Support Zones:
0.5400 – 0.5200 → Short-term support
0.4600 → Key support level
0.4206 → Major low / last support
---
Bullish Scenario
Price breaks and closes above the upper boundary of the descending channel.
Bullish continuation confirmed if 0.6160 flips into support.
Upside targets:
0.7050
0.7960
0.9060
This scenario signals a potential early trend reversal.
---
Bearish Scenario
Price gets rejected at the upper channel or fails to hold above 0.6160.
Bearish continuation patterns may appear.
Downside targets:
0.5400
0.4600
0.4206
A breakdown below 0.4206 could open the door for a deeper bearish extension.
---
Conclusion
XTZ/USDT is currently at a critical decision zone. The recent upside move is still considered a pullback within a broader downtrend.
The primary bias remains bearish unless price can achieve a confirmed breakout above the descending channel.
---
#XTZ #XTZUSDT #Tezos #CryptoAnalysis #TechnicalAnalysis #DescendingChannel #BearishTrend #TrendReversal #Altcoin
#XTZUSDT 1D#XTZ is moving inside a descending channel on the daily timeframe and is currently sitting on the support zone. For the bullish scenario, it must bounce from this zone with strong volume. Do not enter here yet — volume is weak, and the RSI suggests there is still room for further downside. If a successful bounce occurs, we can look for the following short-term targets:
🎯 $0.5746
🎯 $0.6305
And if price breaks above the channel resistance, the next upside targets are:
🎯 $0.6892
🎯 $0.7404
🎯 $0.8132
🎯 $0.9061
❌ Invalidation: a daily candle closing below the channel support.
⚠️ Always remember to use a tight stop-loss and maintain proper risk management.
XTZ USDT LONG SIGNAL---
📢 Trade Idea: XTZ/USDT
Type: Long
Entry Zone: 0.579 – 0.590
🎯 Take-Profit Targets (Partial Exits):
• TP1 = 0.604
• TP2 = 0.616
• TP3 = 0.626
• TP4 = 0.637
• TP5 = 0.665
🛑 Stop-Loss: 0.568
⏱ Timeframe: 1H
⚖️ Risk/Reward Ratio: 2.86
💥 Suggested Leverage: 5x – 10x
---
🧠 Technical Analysis Summary:
XTZ is showing a potential bullish reversal from the 0.57–0.58 accumulation zone, supported by higher lows and a tightening price range.
A confirmed breakout above 0.60 may trigger upward continuation toward 0.63–0.66 resistance levels.
RSI has recovered from the oversold area, and the 20 EMA is flattening, indicating a possible momentum shift in favor of buyers.
---
⚙️ Trade Management Tips:
• Take partial profits at TP1, and move SL to entry once reached.
• For higher targets (TP3–TP5), consider trailing stop-loss to secure profits.
• Avoid re-entry if price closes below 0.568 on 1H.
---
⚠️ Disclaimer:
This setup is for educational purposes only and not financial advice.
Always DYOR and manage your capital responsibly.
---
📌 Hashtags for TradingView:
#XTZUSDT #CryptoSignal #LongSetup #TechnicalAnalysis #CryptoTrading #TradingViewIdeas #Tezos
--
XTZ USDT LONG SIGNAL---
📢 Signal Alert
🔹 Pair: XTZ / USDT
📈 Trade Type: Long
💰 Entry: Market Price
🎯 Take-Profit Targets (Partial Management):
▫️ TP1 = 0.626
▫️ TP2 = 0.653
▫️ TP3 = 0.680
🛑 Stop-Loss: 0.600
📊 Timeframe: 1H
⚖️ Risk/Reward Ratio: 6.0
📌 Suggested Leverage: 5x – 10x
⚠️ Capital management is mandatory.
💬 Please review the chart before entering the trade.
---
🧠 Technical Analysis Summary:
XTZ is forming a bullish reversal pattern from the 0.60–0.61 support area.
Momentum is strengthening with higher lows and rising volume, indicating potential for upward continuation.
If price sustains above 0.620, a push toward 0.653–0.680 is expected.
RSI confirms recovery from the oversold zone, and EMA 20 crossover suggests a short-term bullish trend.
---
⚙️ Trade Management Tip:
• Take partial profit at TP1, move SL to entry once price holds above 0.63.
• Trail your stop for TP2–TP3 to secure profits.
• Avoid re-entry if price drops below 0.600.
---
⚠️ Disclaimer:
This analysis is for educational purposes only and not financial advice.
Always DYOR (Do Your Own Research) and apply proper risk management.
---
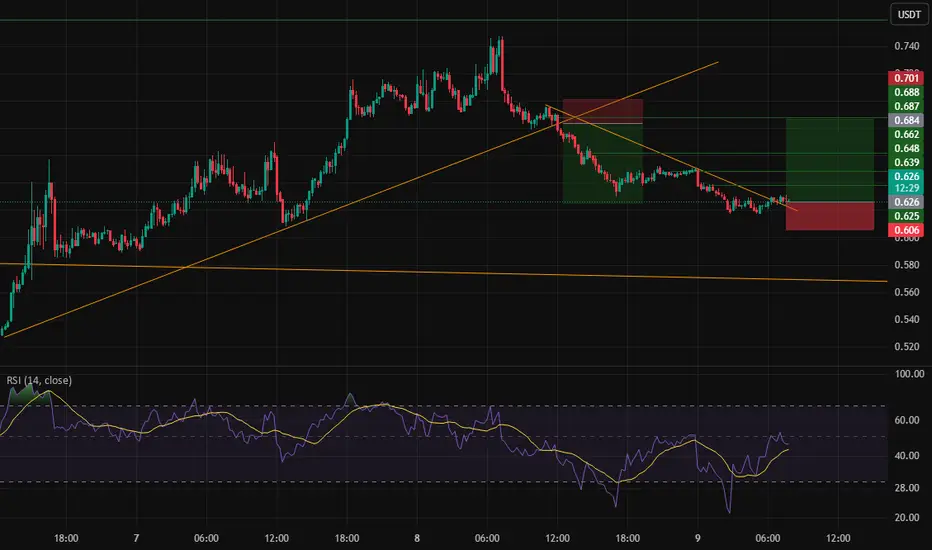
XTZ USDT LONG SIGNAL ---
📢 Signal Alert
🔹 Pair: XTZ / USDT
📈 Trade Type: Long
💰 Entry: 0.626
🎯 Take-Profit Targets (Partial Management):
▫️ TP1 = 0.639
▫️ TP2 = 0.648
▫️ TP3 = 0.662
▫️ TP4 = 0.683
🛑 Stop-Loss: 0.605
📊 Timeframe: 1H
⚖️ Risk/Reward Ratio: 5.73
📌 Suggested Leverage: 5x – 10x
⚠️ Capital management is mandatory.
💬 Please review the chart before entering the trade.
---
🧠 Technical Analysis Summary:
XTZ is currently rebounding from a strong support level near 0.615, forming a bullish reversal pattern on lower timeframes.
A clean breakout above 0.630 would confirm bullish continuation toward 0.648 – 0.683.
The RSI has crossed above 50, showing renewed bullish momentum, and MACD is forming a positive crossover.
Stop-loss is placed just below the latest swing low to protect against volatility.
---
⚙️ Trade Management Tip:
Take partial profit at TP1, then move stop-loss to breakeven.
Let the rest of the position run toward TP3–TP4 if momentum continues.
Avoid entering before confirmation candle close above 0.628.
---
⚠️ Disclaimer:
This signal is for educational purposes only and not financial advice.
Always DYOR (Do Your Own Research) and use proper risk management before trading.
---
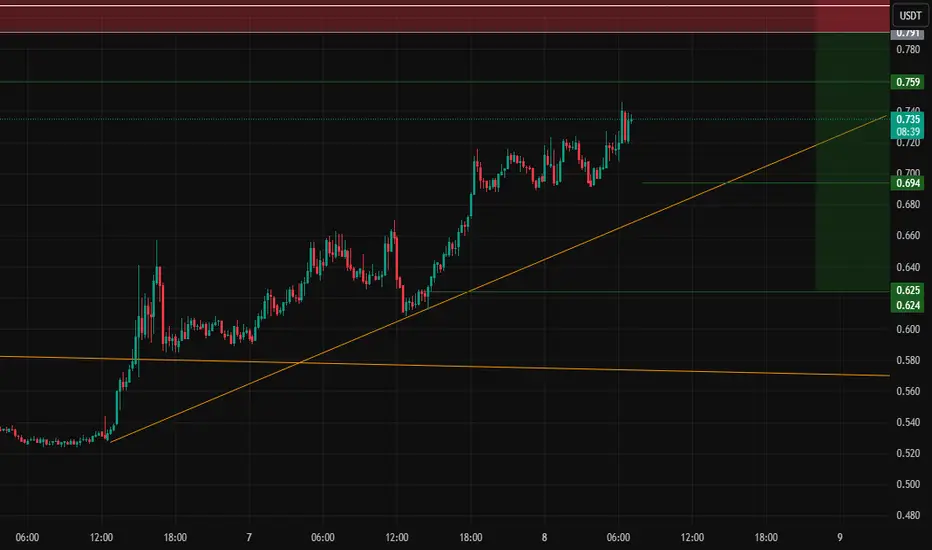
XTZ USDT SHORT SIGNAL---
📢 Signal Alert
🔹 Pair: XTZ / USDT
📉 Trade Type: Short
💰 Entry Zone: 0.790 – 0.845
🎯 Take-Profit Targets:
TP1 = 0.759
TP2 = 0.695
TP3 = 0.625
🛑 Stop-Loss: 0.846
📊 Timeframe: 1H
⚖️ Risk/Reward Ratio: 3.0
📌 Suggested Leverage: 3x – 5x
⚠️ Capital management is mandatory.
Please analyze the chart carefully before entering the trade.
---
🧠 Technical Analysis Summary:
XTZ is showing clear bearish pressure after rejecting the 0.84–0.85 resistance zone, which previously acted as a strong supply area.
Price action confirms a lower-high structure with bearish candles gaining strength.
🔸 Key Observations:
RSI has crossed below 50, supporting bearish continuation.
Volume is increasing on red candles, showing strong seller dominance.
EMA alignment favors short positions, confirming downside momentum.
First target (0.759) aligns with short-term support; deeper targets (0.695–0.625) match major daily demand zones.
Stop-loss is placed safely above recent liquidity highs to avoid false breakouts.
---
⚙️ Trade Management Tip:
Once TP1 is reached, move SL to Entry and take partial profit to secure gains.
Let the rest ride toward TP2–TP3 for extended profits.
---
⚠️ Disclaimer:
This analysis is for educational and informational purposes only and not financial advice.
Always Do Your Own Research (DYOR) and use proper risk management before entering any trade.
---
XTZUSDT Forming Falling WedgeXTZUSDT is forming a clear falling wedge pattern, a classic bullish reversal signal that often indicates an upcoming breakout. The price has been consolidating within a narrowing range around $0.65 USDT, suggesting that selling pressure is weakening while buyers are beginning to regain control amid a recent 20% surge to multi-week highs. With consistent volume confirming accumulation at lower levels exceeding $180 million daily, the setup hints at a potential bullish breakout soon. The projected move could lead to an impressive gain of 90% to 100%+ once the price breaks above the wedge resistance, igniting interest in XTZUSDT price prediction for Tezos enthusiasts.
This falling wedge pattern is typically seen at the end of downtrends or corrective phases, and it represents a potential shift in market sentiment from bearish to bullish. Traders closely watching XTZUSDT are noting the strengthening momentum as it nears a breakout zone near $0.70, fueled by Etherlink L2 launches and RWA tokenization momentum. The good trading volume adds confidence to this pattern, showing that market participants are positioning early in anticipation of a reversal in this self-amending layer 1 blockchain token.
Investors’ growing interest in XTZUSDT reflects rising confidence in the project’s long-term fundamentals and current technical strength, especially with integrations like Google cloud credits for builders and European asset expansions. If the breakout confirms with sustained volume, this could mark the start of a fresh bullish leg. Traders might find this a valuable setup for medium-term gains, especially as the wedge pattern completes and buying momentum accelerates in falling wedge breakout crypto plays.
✅ Show your support by hitting the like button and ✅ Leaving a comment below! (What is You opinion about this Coin) Your feedback and engagement keep me inspired to share more insightful market analysis with you!
BUY TEZOS NOWWBased on the XTZ/USDT 30-minute chart using Heikin Ashi candles:
• Current Price: The price is around $0.5636 (as of 20:49 on November 06, 2025).
• Support Zone: The chart shows a strong support area around $0.5252. The price has touched and held firm above this level in recent days, showing consolidation in this region, which indicates buying pressure is starting to emerge and preventing the price from dropping lower.
• Trade Setup:
• Entry: Currently around the market price, approximately $0.5636.
• Stop Loss: Placed below the nearest support zone, around $0.5252 (or slightly lower to avoid wick-hunts).
• Take Profit: A relatively distant target, around $1.0762 (based on the peak level drawn on the chart).
• Candlestick Signal: Using Heikin Ashi candles, small green candles are starting to appear after a period of red accumulation, which is an early sign of a reversal or at least an impending upward move.
• Risk/Reward Ratio (R:R): With Risk: $0.5636 - $0.5252 = $0.0384 and Reward: $1.0762 - $0.5636 = $0.5126. The R:R ratio is $0.5126 / $0.0384 \approx 13.3:1. This is an extremely attractive ratio, suggesting that a successful trade could yield massive profits relative to the risk.