YBUSDT 1D#YB has broken above the falling wedge resistance and the 50-day SMA on the daily timeframe. However, it is now approaching the Ichimoku Cloud, which remains a key resistance zone. A confirmed breakout above the cloud could pave the way for the following upside targets:
🎯 $0.1097
🎯 $0.1361
🎯 $0.1574
🎯 $0.1788
🎯 $0.2091
🎯 $0.2478
⚠️ Always use a tight stop-loss and apply proper risk management.
In-depth trading ideas
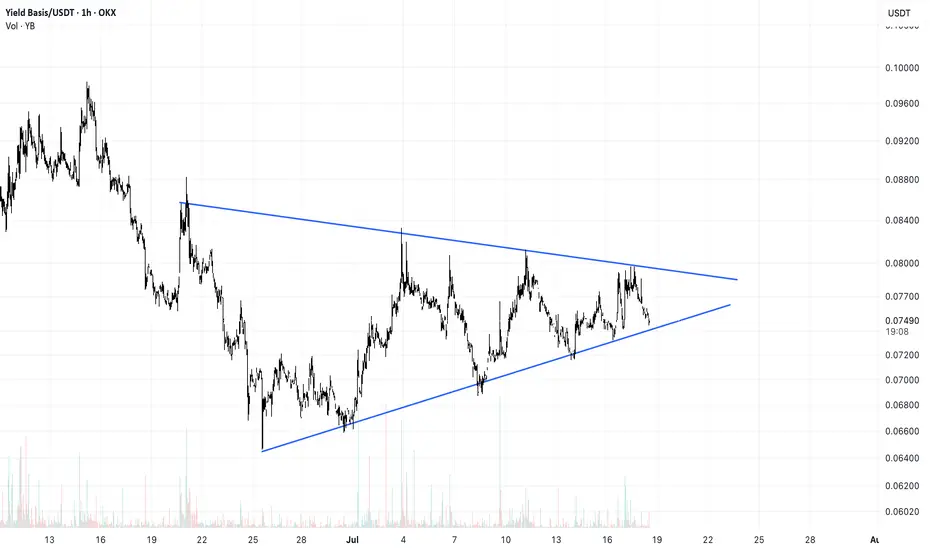
YB/USDT (1h) Testing Support Inside a Symmetrical TriangleYB/USDT is consolidating inside a symmetrical triangle on the 1H chart. Price has pulled back toward the ascending support after another rejection from the upper trendline.
Holding the lower boundary could lead to another test of descending resistance. A confirmed breakout above the triangle would favor bullish continuation, while a breakdown below support would weaken the structure and open the way for further downside.
YB / YBUSDT Long Setup | Breaker Block ReclaimMARKET ANALYSIS
YB is currently reacting from a key technical area highlighted on the chart.
As long as the protected support zone remains intact, the bullish market structure remains valid and higher liquidity targets may continue to attract price action.
A breakdown below the invalidation level would weaken the current bullish scenario and require a reassessment of market conditions.
📍 Entry, Stop Loss and Take Profit levels are marked directly on the chart.
━━━━━━━━━━━━━━
⚠️ DISCLAIMER
This publication is provided solely for educational and market observation purposes.
Nothing contained in this analysis should be considered financial advice, investment advice, or a recommendation to buy or sell any financial instrument.
All trading and investment decisions remain solely the responsibility of the individual trader.
Always conduct your own research and apply proper risk management before entering any position.
━━━━━━━━━━━━━━
🎯 PARALOG
▪️Crypto Market Analysis
▪️BTC Futures Signals
▪️Bitcoin & Altcoin Market Analysis
Precision • Momentum • Timing
━━━━━━━━━━━━━━
Exchange: #MEXC Futures
#bitcoin #btc #crypto #futures #technicalanalysis
YBUSDT 1D#YB has bounced from the support zone and volume is increasing. It is now testing the descending resistance and the daily SMA100. In case of a breakout above them, the potential upside targets are:
🎯 $0.1609
🎯 $0.1802
🎯 $0.1995
🎯 $0.2269
🎯 $0.2618
⚠️ Always use a tight stop-loss and maintain proper risk management.
YBUSDT Forming Falling WedgeYBUSDT is forming a clear falling wedge pattern, a classic bullish wave signal that often indicates an upcoming breakout. The price has been consolidating within a narrowing range, suggesting that selling pressure is weakening while buyers are beginning to regain control. With consistent volume confirming accumulation at lower levels, the setup hints at a potential bullish breakout soon. The projected move could lead to an impressive gain of around 90% to 100% once the price breaks above the wedge resistance.
This falling wedge pattern is typically seen at the end of downtrends or corrective phases, and it represents a potential shift in market sentiment from bearish to bullish. Traders closely watching YBUSDT are noting the strengthening momentum as it nears a breakout zone. The strong trading volume adds confidence to this setup, showing that market participants may already be positioning early in anticipation of a reversal.
Investors’ growing interest in YBUSDT reflects increasing confidence in the project’s long-term fundamentals and current technical strength. If the breakout confirms with sustained buying volume, this could mark the beginning of a fresh bullish rally. Traders may find this a valuable setup for medium-term gains, especially as the wedge pattern nears completion and bullish momentum continues to build.
✅ Show your support by hitting the like button
✅ Leaving a comment below! (What is your opinion about this coin?)
Your feedback and engagement keep me inspired to share more insightful market analysis with you!
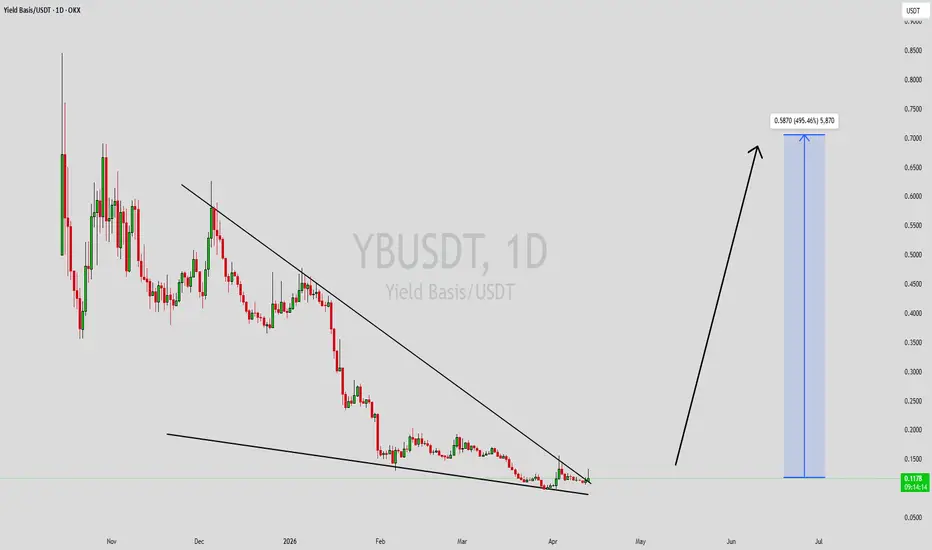
YBUSDT Forming Falling WedgeYBUSDT is forming a clear falling wedge pattern, a classic bullish reversal signal that often indicates an upcoming breakout. The price has been consolidating within a narrowing range, suggesting that selling pressure is weakening while buyers are beginning to regain control. With consistent volume confirming accumulation at lower levels, the setup hints at a potential bullish breakout soon. The projected move could lead to an impressive gain of around 390% to 400% once the price breaks above the wedge resistance.
This falling wedge pattern is typically seen at the end of downtrends or corrective phases, and it represents a potential shift in market sentiment from bearish to bullish. Traders closely watching YBUSDT are noting the strengthening momentum as it nears a breakout zone. The good trading volume adds confidence to this pattern, showing that market participants are positioning early in anticipation of a reversal.
Investors’ growing interest in YBUSDT reflects rising confidence in the project’s long-term fundamentals and current technical strength. If the breakout confirms with sustained volume, this could mark the start of a fresh bullish leg. Traders might find this a valuable setup for medium-term gains, especially as the wedge pattern completes and buying momentum accelerates.
✅ Show your support by hitting the like button and
✅ Leaving a comment below! (What is your opinion about this Coin?)
Your feedback and engagement keep me inspired to share more insightful market analysis with you!
YBUSDT Forming Bullish MomentumYBUSDT is forming a clear bullish momentum pattern, a classic bullish reversal signal that often indicates an upcoming breakout. The price has been consolidating within a narrowing range, suggesting that selling pressure is weakening while buyers are beginning to regain control. With consistent volume confirming accumulation at lower levels, the setup hints at a potential bullish breakout soon. The projected move could lead to an impressive gain of around 190% to 200% once the price breaks above the wedge resistance.
This bullish momentum pattern is typically seen at the end of downtrends or corrective phases, and it represents a potential shift in market sentiment from bearish to bullish. Traders closely watching YBUSDT are noting the strengthening momentum as it nears a breakout zone. The good trading volume adds confidence to this pattern, showing that market participants are positioning early in anticipation of a reversal.
Investors’ growing interest in YBUSDT reflects rising confidence in the project’s long-term fundamentals and current technical strength. If the breakout confirms with sustained volume, this could mark the start of a fresh bullish leg. Traders might find this a valuable setup for medium-term gains, especially as the pattern completes and buying momentum accelerates.
✅ Show your support by hitting the like button and
✅ Leaving a comment below! (What is your opinion about this Coin?)
Your feedback and engagement keep me inspired to share more insightful market analysis with you!
Yield Basis Daily with MACD & RSI (comparing the chart to Gold)Consider the difference between this one, Yield Basis (YBUSDT) and Gold (XAUUSD).
YBUSDT D MACD:
›› Notice here the bullish cross, it confirms an upcoming rise.
(Gold was showing a bearish cross instead.)
YBUSDT D RSI:
››The RSI is trending up and rising.
›› A double-bottom is present around oversold conditions.
(Gold was showing overbought conditions with the RSI trending lower after a triple top.)
YBUSDT: From the bottom up.
XAUUSD: After a parabolic rise, a crash develops.
Let's focus on the candles real quick.
Yield Basis hit a new all-time low recently followed by a higher low. This can signal the start of a bullish move. Not necessarily, but possible. A bullish move is confirmed only after a higher high shows up after the main low. When YBUSDT moves and closes above the high 12-Feb.
(Gold, on the other hand, is coming down from a new all-time high. Then the chart shows a lower high and this can lead to lower prices.)
Here you can see how the charts and oscillators are fully reversed.
The one at the bottom is bullish, the one at the top is bearish.
Namaste.
YB BREAKOUT LOADING🔥 Fortune AI Radar — NASDAQ:YB
Fresh activity detected on NASDAQ:YB today.
Data suggests increasing market interest & buyers stepping in.
Technicals currently lean bullish, with momentum trending upward.
Whales showing hints of accumulation and hype rising among traders.
This coin is flashing strong signals on short-term charts — worth keeping an eye on 👀
Not financial advice — always research before taking decisions
YB Buy/Long Setup (4H)From the point where we placed the red arrow on the chart, the correction of YBUSDT has begun. It now appears to be in wave C of this correction.
We are looking for buy positions around the green zone.
Targets are marked on the chart.
A daily candle closing below the invalidation level will invalidate this analysis.
For risk management, please don't forget stop loss and capital management
When we reach the first target, save some profit and then change the stop to entry
Comment if you have any questions
Thank You
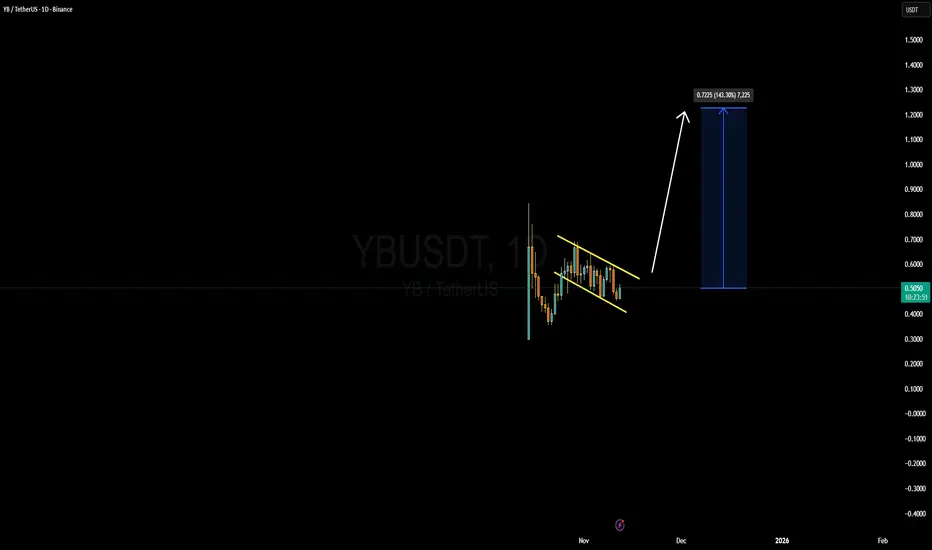
YBUSDT Forming Bullish PennantYBUSDT is forming a clear bullish pennant pattern, a classic bullish reversal signal that often indicates an upcoming breakout. The price has been consolidating within a narrowing range, suggesting that selling pressure is weakening while buyers are beginning to regain control. With consistent volume confirming accumulation at lower levels, the setup hints at a potential bullish breakout soon. The projected move could lead to an impressive gain of around 90% to 100% once the price breaks above the pennant resistance.
This bullish pennant pattern is typically seen at the end of downtrends or corrective phases, and it represents a potential shift in market sentiment from bearish to bullish. Traders closely watching YBUSDT are noting the strengthening momentum as it nears a breakout zone. The good trading volume adds confidence to this pattern, showing that market participants are positioning early in anticipation of a reversal.
Investors’ growing interest in YBUSDT reflects rising confidence in the project’s long-term fundamentals and current technical strength. If the breakout confirms with sustained volume, this could mark the start of a fresh bullish leg. Traders might find this a valuable setup for medium-term gains, especially as the pennant pattern completes and buying momentum accelerates.
✅ Show your support by hitting the like button and
✅ Leaving a comment below! (What is your opinion about this Coin?)
Your feedback and engagement keep me inspired to share more insightful market analysis with you!
YB USDT currency analysis using wave analysisإليك وصفًا مناسبًا وجاهزًا لعنوان
“YB/USDT Currency Analysis Using Wave Analysis”:
---
📌 Description
This analysis of YB/USDT uses Elliott Wave Theory to identify the current market structure, highlight the dominant impulsive and corrective waves, and determine potential reversal zones. By examining wave counts and Fibonacci confluence levels, the analysis aims to pinpoint where the correction may end and where a new trend phase could begin. This provides a clearer outlook on the next probable price movements and key areas of interest for traders.
YBUSDT Forming Falling WedgeYB/USDT is showing early signs of a potential reversal setup that could grab serious attention. The chart is forming what looks like a falling wedge pattern, which often marks the end of bearish sentiment and the start of a bullish resurgence. While the pair has been trending down, the tightening range and increased accumulation suggest that sellers may be losing steam and buyers are stepping in quietly behind the scenes.
On the fundamentals side, YB appears to be gaining traction as a project with renewed investor interest, whether through improved on-chain metrics, partnership announcements, or ecosystem expansion—these signals are often precursors to major moves in crypto. Trading volume is coming alive, which means there’s real participation behind the scenes, not just quiet accumulation. With these two elements—structure + interest—aligning, the setup is showing high-reward potential.
From a strategy perspective, one could look for a breakout above the upper trendline of the wedge as the trigger to go long, preferably accompanied by a surge in volume to confirm momentum. The risk is better defined as long as stops are placed below the recent lows of the wedge pattern. If the breakout holds, a move in the 70 %+ range becomes realistic given the structural pattern and growing market attention. Timing the entry after the breakout or on a pullback toward the breakout zone could increase the odds.
YBUSDT Forming Bullish MomentumYBUSDT is displaying a strong bullish momentum pattern, indicating that buyers are gaining control and driving the market upward. After a period of consolidation, the pair has started to show renewed strength, suggesting the potential for a major upside breakout. The bullish momentum structure points toward a continuation of the upward trend, with traders eyeing possible gains of around 60% to 70% in the short to medium term as the momentum builds.
The volume profile for YBUSDT remains solid, confirming growing interest and participation from traders and investors. Increased trading activity during bullish price movements often reinforces confidence in the trend, showing that the market is preparing for a sustained rally. The consistent volume support behind each upward move is a clear sign that the market has strong backing from both retail and institutional participants.
Investor sentiment is turning increasingly positive toward YBUSDT, with many recognizing the potential of this project’s ecosystem and growth prospects. The technical setup aligns well with the current market optimism, further strengthening the bullish outlook. If YBUSDT maintains this momentum and continues to attract buying pressure, the next breakout phase could drive it toward new resistance levels, potentially unlocking significant returns.
✅ Show your support by hitting the like button and
✅ Leaving a comment below! (What is You opinion about this Coin)
Your feedback and engagement keep me inspired to share more insightful market analysis with you!
YBUSDT.P: short setup from daily support at 0.463BINANCE:YBUSDT.P is trading near its historical low and continues to confirm the established level. A strong signal came from today’s false breakout, to which the asset showed no meaningful reaction. On the next approach to the level, monitoring volatility and entry formation will be key.
Key factors for this scenario:
Global & local trend alignment
Price void / low liquidity zone beyond level
Correlation with the market
Volatility contraction on approach
Immediate retest
No reaction after a false break
Closing near the level
Closing near the bar's extreme
Was this analysis helpful? Leave your thoughts in the comments and follow to see more.