YFI: local squeeze with $2681 destinationThe Macro Picture 🗺️
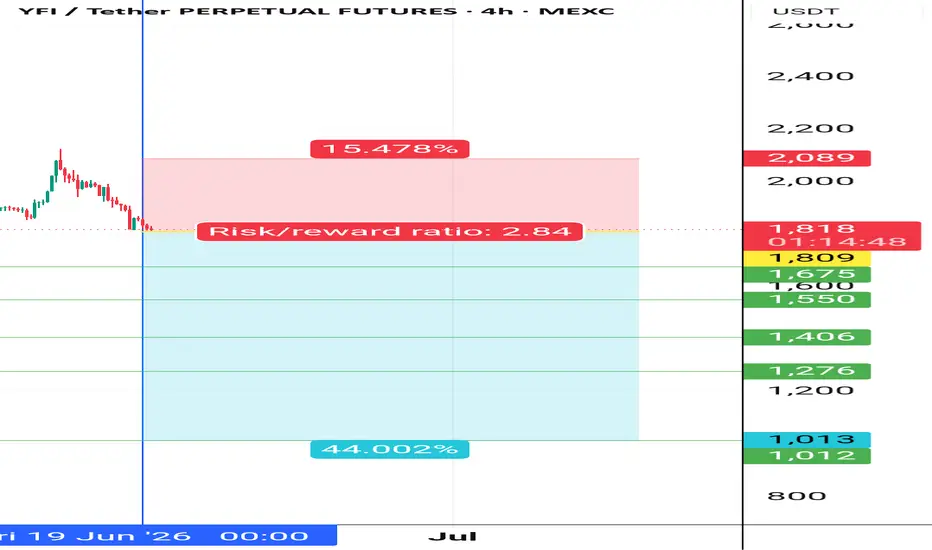
YFI flushed down to the $1675 low in late June, then snapped back hard to $2139 in a sharp recovery. Price is now consolidating in the middle of the range, digesting the bounce as it decides its next leg.
The Setup ⚙️
The Range Floor 🟢
$1579 (Macro Support) is the demand base
#YFIUSDT chart (1-hour timeframe)#YFI
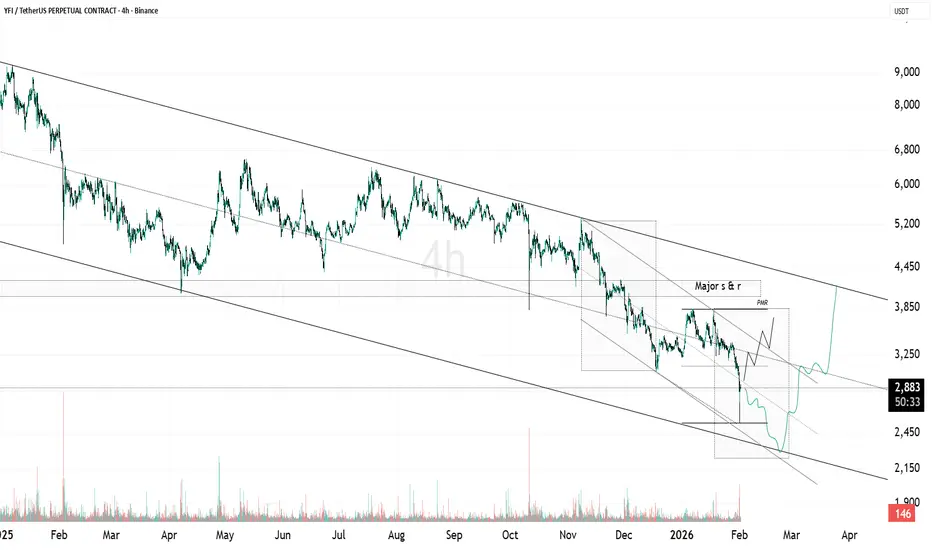
The price is moving within a descending channel on the 1-hour timeframe and has reached the lower boundary. It is now poised for a bounce and is expected to retest this boundary.
The Relative Strength Index (RSI) indicates a downward trend, which is likely to continue given the overbought con
Yfiusdt shortInstructions:
Entry point: yellow
Stop loss: red
Take profit: green
👉Leverage x 5-10-20 for crypto
👉Leverage x 20-50-100 for commodities, stocks, indices, and forex
👉Margin 1-5% max.
Always practice risk and money management.
Invest a maximum of 5% on any trade or across all your trades.
Invest on
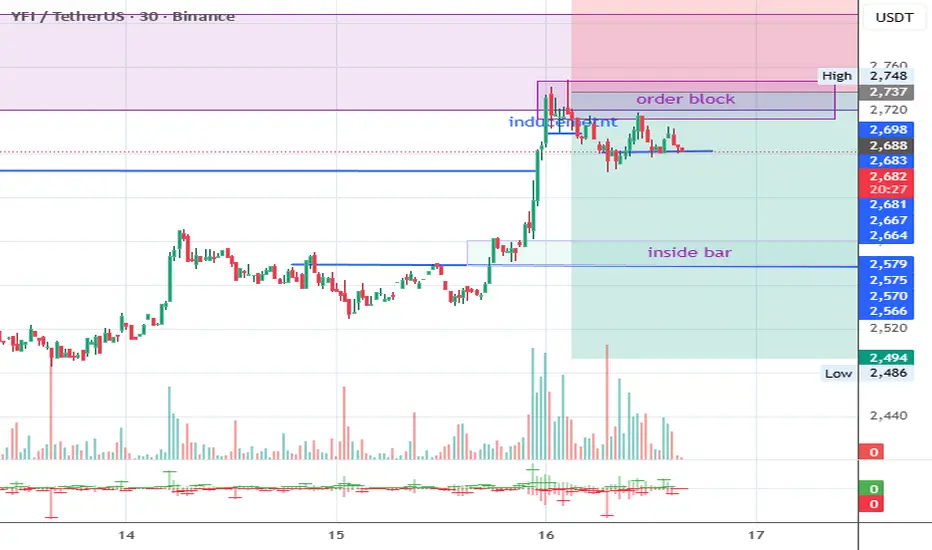
Yfiusdt longInstructions:
Entry point: yellow
Stop loss: red
Take profit: green
👉Leverage x 5-10-20 for crypto
👉Leverage x 20-50-100 for commodities, stocks, indices, and forex
👉Margin 1-5% max.
Always practice risk and money management.
Invest a maximum of 5% on any trade or across all your trades.
Invest on
YFI/USDT — Descending Trendline: Reversal or Further Drop?On the 2D timeframe, YFI/USDT is still in a strong downtrend, clearly indicated by a Descending Trendline (yellow line) consistently pushing price lower.
Price is currently moving near a dynamic resistance area (trendline), which is a crucial zone to determine the next direction.
There are also se
16-04-26 YFI Is the Altcoin party about to get down?Is the Altcoin party about to get crashed? 📉Everyone is staring at the CRYPTOCAP:BTC $ pump, but the real "Alpha" is hidden in the TVC:DXY $ chart. While most are chasing green candles, I’m watching a massive trap being set.
Trading isn't about looking at one chart in a vacuum. It’s about the "Tri
YFI Holding Demand Within a Descending StructureYFI is still moving inside a clear descending channel on the higher time frame. Price recently reacted from the lower boundary and is now trying to stabilize after a long period of controlled downside. This zone has acted as a demand area multiple times in the past, so buyers stepping in here is not
YFI/USDT: Bullish Bat Pattern Completion (Long Setup)On the OKX:YFIUSDT.P 2H chart, price has completed a Bullish Bat harmonic pattern with a potential reversal zone near point D . After the strong leg up into B→C→D structure, I’m waiting for a retracement into the demand zone (green) for a high-probability long entry.
The confluence includes:
– C
YFI Buy/Long Setup (4H)Considering that we have a 3D at the bottom and the price has formed a bullish CH, on the pullback to the previous wave’s cheap zone, we can look for buy/long positions.
We have two entry points enter these points using DCA.
The targets are also marked on the chart.
Do not enter the position with
See all ideas
Summarizing what the indicators are suggesting.
Oscillators
Neutral
SellBuy
Strong sellStrong buy
Strong sellSellNeutralBuyStrong buy
Oscillators
Neutral
SellBuy
Strong sellStrong buy
Strong sellSellNeutralBuyStrong buy
Summary
Neutral
SellBuy
Strong sellStrong buy
Strong sellSellNeutralBuyStrong buy
Summary
Neutral
SellBuy
Strong sellStrong buy
Strong sellSellNeutralBuyStrong buy
Summary
Neutral
SellBuy
Strong sellStrong buy
Strong sellSellNeutralBuyStrong buy
Moving Averages
Neutral
SellBuy
Strong sellStrong buy
Strong sellSellNeutralBuyStrong buy
Moving Averages
Neutral
SellBuy
Strong sellStrong buy
Strong sellSellNeutralBuyStrong buy
Displays a symbol's price movements over previous years to identify recurring trends.