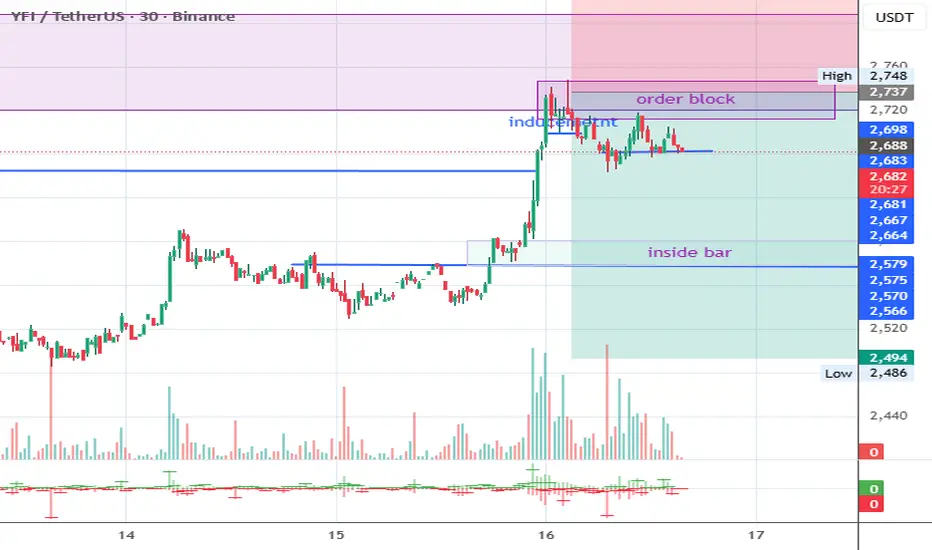
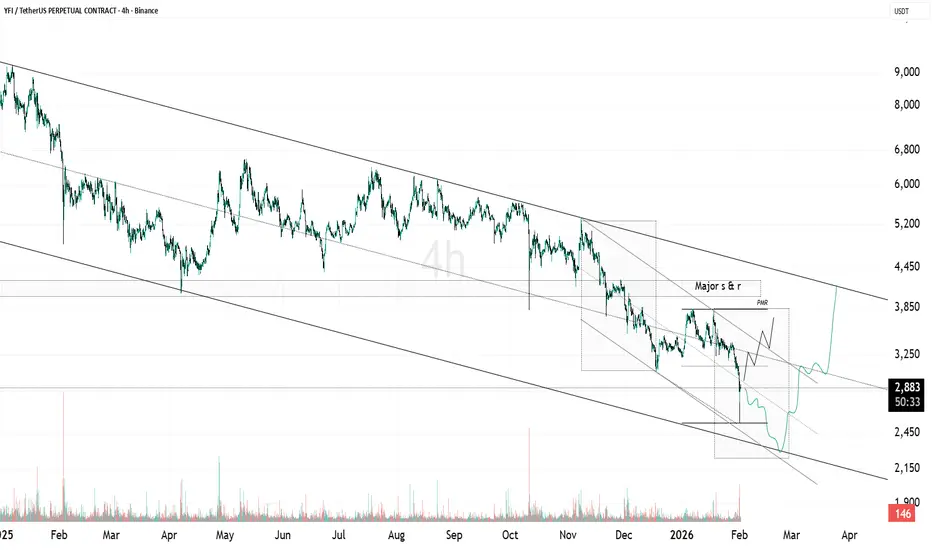
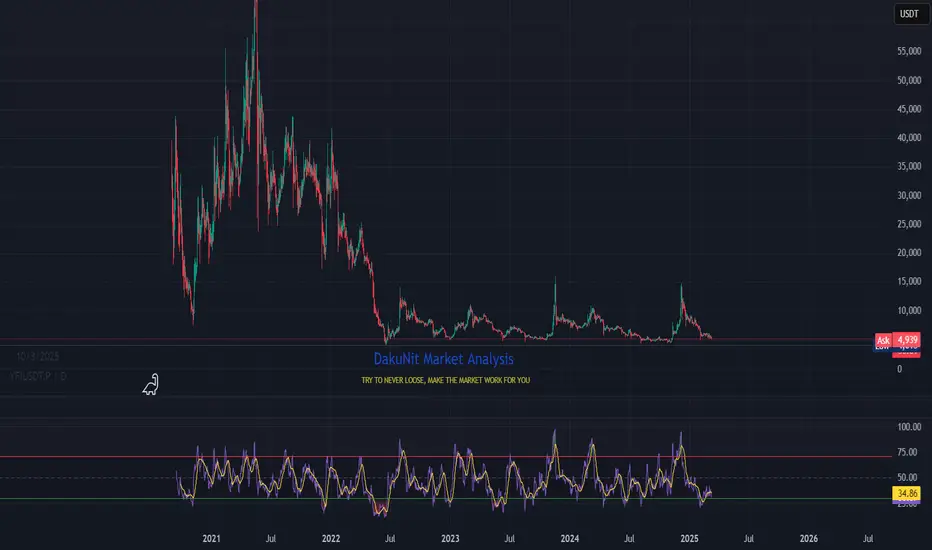
YFI Downtrend to Potential Bullish Reversal!Time Frame: 3D
Current Price: ± $2,197
Pattern: 📉 Long-Term Descending Trendline → 🚀 Bullish Breakout
Key Support Zone: 🟨 $1,800 – $2,060
Key Resistance / Targets: 🎯 $2,400 → $2,815 → $3,110 → $3,810 → $4,430
---
🔎 Market Structure
TSXV:YFI remains in a major long-term downtrend after reaching a high around $14,772, with price structure dominated by Lower Highs (LH) and Lower Lows (LL).
However, an important structural change has emerged recently. Price formed a base/consolidation zone aro
yearn.finance / Tether
No trades
No trades
In-depth trading ideas
YFI: local squeeze with $2681 destinationThe Macro Picture 🗺️
YFI flushed down to the $1675 low in late June, then snapped back hard to $2139 in a sharp recovery. Price is now consolidating in the middle of the range, digesting the bounce as it decides its next leg.
The Setup ⚙️
The Range Floor 🟢
$1579 (Macro Support) is the demand base, with $1675 (Local Low) as the nearer shelf. Both were defended on the flush, and that's the floor this range pivots on.
The Decision Point 🔴
$2819 (Local High) is the structural gate. Before it, th
YFI/USDT — Descending Trendline: Reversal or Further Drop?On the 2D timeframe, YFI/USDT is still in a strong downtrend, clearly indicated by a Descending Trendline (yellow line) consistently pushing price lower.
Price is currently moving near a dynamic resistance area (trendline), which is a crucial zone to determine the next direction.
There are also several key horizontal resistance levels marked:
📌 3,100
📌 3,400
📌 3,810
📌 4,190
📌 4,960
---
📐 Structure & Pattern
🔻 Descending Trendline (Bearish Structure)
Continuous formation of Lower Hig
16-04-26 YFI Is the Altcoin party about to get down?Is the Altcoin party about to get crashed? 📉Everyone is staring at the CRYPTOCAP:BTC $ pump, but the real "Alpha" is hidden in the TVC:DXY $ chart. While most are chasing green candles, I’m watching a massive trap being set.
Trading isn't about looking at one chart in a vacuum. It’s about the "Triple Threat" confluence:The King ( CRYPTOCAP:BTC $): Currently slamming into a major 4H/Daily Supply zone. Momentum is stalling.The Godfather ( TVC:DXY $): Just tapped a high-timeframe Demand zone and
YFI Holding Demand Within a Descending StructureYFI is still moving inside a clear descending channel on the higher time frame. Price recently reacted from the lower boundary and is now trying to stabilize after a long period of controlled downside. This zone has acted as a demand area multiple times in the past, so buyers stepping in here is not a surprise.
A short term bounce toward the mid range of the channel looks possible, but only improves if YFI can reclaim the upper channel resistance and hold above it. Until then, this remains a c
YFI/USDT: Bullish Bat Pattern Completion (Long Setup)On the OKX:YFIUSDT.P 2H chart, price has completed a Bullish Bat harmonic pattern with a potential reversal zone near point D . After the strong leg up into B→C→D structure, I’m waiting for a retracement into the demand zone (green) for a high-probability long entry.
The confluence includes:
– Completion of the Bat at 0.886 XA
– Strong reaction from point C
– Clear demand zone below price
– Bullish structure still intact
If price retraces into the demand zone and shows signs of holding, I e
YFI Buy/Long Setup (4H)Considering that we have a 3D at the bottom and the price has formed a bullish CH, on the pullback to the previous wave’s cheap zone, we can look for buy/long positions.
We have two entry points enter these points using DCA.
The targets are also marked on the chart.
Do not enter the position without capital management and stop setting
Comment if you have any questions
thank you
YFI/USDT — Multi-Year Demand Zone: Rebound or Breakdown?🔎 Full Analysis
On the weekly timeframe, YFI/USDT is trading right above a multi-year demand zone around $3,800 – $4,750 (yellow box). This area has repeatedly acted as a strong support since 2022, where buyers step in to prevent deeper declines.
After a sharp drop from its 2021 peak, price action has formed a long-term base/accumulation structure, suggesting that while selling pressure has slowed down, there’s still no strong bullish momentum to drive a sustainable uptrend.
Looking upward, w
YFI | Long | Yield Farming Support + Spot Demand |(May 21, 2025)YFI | Long | Yield Farming Support + Spot Demand | (May 21, 2025)
1️⃣ Quick Summary:
Yearn Finance is sitting at a key support level and just gave an entry opportunity. With open interest cooling down and price stabilizing, this looks like a solid setup for a cautious long, especially if momentum builds.
2️⃣ Trade Parameters:
Bias: Long
Entry Zone: Around current support – confirming the entry as the level held
Stop Loss: Around 5% below entry to manage risk
TP1: $6,100
TP2: $7,500
TP3: $8,500
YFIUSDT | Long Setup | Fib Reaction | (May 2025)YFIUSDT | Long Setup | Fib Reaction + Triangle Break Potential | (May 2025)
1️⃣ Short Insight Summary:
YFI is showing a small triangle correction, reacting well to key Fibonacci levels around $5,000–$5,135. Momentum suggests another leg up could be forming, especially if VWAP holds and buyers step in again.
2️⃣ Trade Parameters:
Bias: Long
Entry: Around $5,830 after correction confirms
Stop Loss: $4,862
TP1: $7,475
TP2: $8,561
TP3: $9,162
TP4: $11,919
TP5: $27,179
Partial Exits: Start locking
YFI/USDT | Long Bias | Healthy Open Interest | (April 2025)YFI/USDT | Long Bias | Strong Trend + Healthy Open Interest | (April 27, 2025)
1️⃣ Insight Summary:
YFI/USDT is showing a strong and clean uptrend, with open interest supporting the move. No major spot panic selling is detected, and delta flow remains healthy — setting the stage for a potential continuation.
2️⃣ Trade Parameters:
Bias: Long
Entry Zone: Watching for a small correction toward 6,114 or direct continuation toward 7,475
Stop Loss: Below recent liquidity grab zones or local structur
Yearn-Finance: Your Altcoin Choice (S2)I will start with the long-term linear chart and then move to the main chart above. This is a theme that I've been repeating across multiple charts trying to show that the market is trading at bottom prices.
The linear chart also shows clearly where a pair stands, in this case, trading at bottom prices.
I am trying to show, based on facts and market data, that the Altcoins market is not really in a bad bull market but rather in a neutral, long-term sideways period from where a bull market can
YFITo me YFI it is the next BTC.
with only 34k tokens in circulation and listed on top t1 exchanges, such projects are diamonds and same it is YFI.
very curious to see what price it would reach in full bull market, if never comes ???
i bet 1$ that it would catch 150k if not more
this is my personal opinion, do not invest unless you are pretty sure on what you do.
please do your own research.