YGGUSDT - Bear Flag, Bearish Continuation or Bullish Breakout?📊 On the 2H timeframe, YGGUSDT remains in a bearish trend following a sharp decline (flagpole). The price is currently forming a Bear Flag, a classic bearish continuation pattern that develops when price consolidates upward within a rising channel.
🟨 Technically, the price is still trading below a
YGG Weekly Structure Bearish Until 0.08 BreaksYGG continues to respect a macro descending channel on the weekly timeframe, printing consistent lower highs (10.79 → 1.81 → 0.84 → 0.29 → 0.07). Price is currently reacting near the lower boundary, suggesting a potential short-term relief bounce.
Key level to watch is 0.079–0.080 (channel resistan
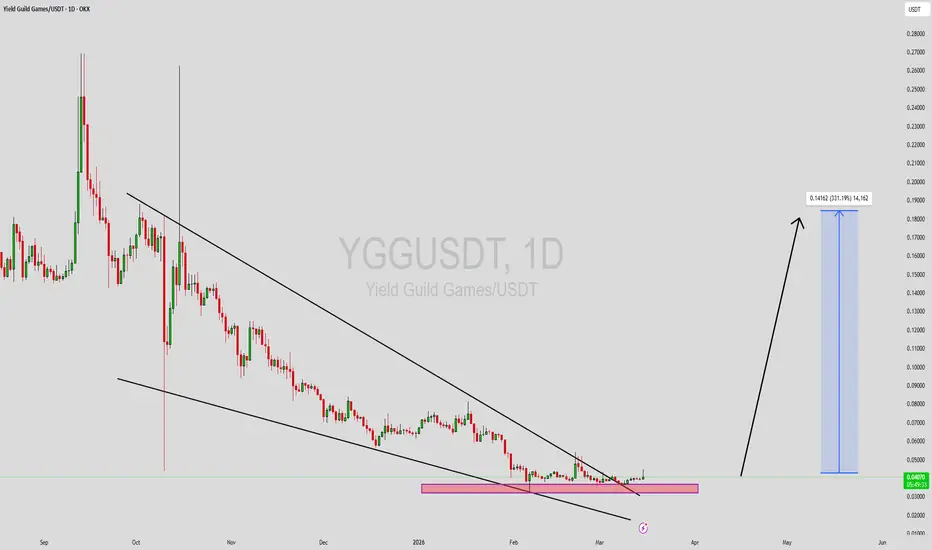
YGGUSDT Forming Falling WedgeYGGUSDT is forming a clear falling wedge pattern, a classic bullish reversal signal that often indicates an upcoming breakout. The price has been consolidating within a narrowing range, suggesting that selling pressure is weakening while buyers are beginning to regain control. With consistent volume
YGGUSDT Forming Descending ChannelYGGUSDT is forming a clear descending channel pattern, a classic bullish reversal signal that often indicates an upcoming breakout. The price has been consolidating within a narrowing range, suggesting that selling pressure is weakening while buyers are beginning to regain control. With consistent v
YGGUSDT — Historic Volume With Both Squeezes Fired and Shorts WrYGG is putting on a show. Historic combined volume, both spot and futures squeezes fired simultaneously, a whale buy signal, shorts getting liquidated, and a parabolic price structure at 66.7x the demand zone. This is one of the most loaded setups you will see — and that cuts both ways.
Price is at
YGG/USDT: Breakout Retest Long from Former SupplyOn the OKX:YGGUSDT.P 4H chart, price has impulsively broken above a major supply zone (red) and is now pulling back into that same area, turning it into potential support. This is a classic breakout-and-retest structure after a strong expansion move.
The current pullback into the former supply z
Short trade
Sell-Side Trade — YGGUSDT.P (15m)
Pair: YGGUSDT
Bias: Sell-side
Date: Fri 16th Jan 2026
Session: London Session AM
Time: 10:15 am (UK)
Entry TF: 15-minute
🎯 Execution Levels
Entry: 0.07067
Take Profit: 0.06853 (3.02%)
Stop Loss: 0.07093 (0.36%)
Risk–Reward: RR 8.23
Sentiment & Session Context
P
See all ideas
Summarizing what the indicators are suggesting.
Oscillators
Neutral
SellBuy
Strong sellStrong buy
Strong sellSellNeutralBuyStrong buy
Oscillators
Neutral
SellBuy
Strong sellStrong buy
Strong sellSellNeutralBuyStrong buy
Summary
Neutral
SellBuy
Strong sellStrong buy
Strong sellSellNeutralBuyStrong buy
Summary
Neutral
SellBuy
Strong sellStrong buy
Strong sellSellNeutralBuyStrong buy
Summary
Neutral
SellBuy
Strong sellStrong buy
Strong sellSellNeutralBuyStrong buy
Moving Averages
Neutral
SellBuy
Strong sellStrong buy
Strong sellSellNeutralBuyStrong buy
Moving Averages
Neutral
SellBuy
Strong sellStrong buy
Strong sellSellNeutralBuyStrong buy
Displays a symbol's price movements over previous years to identify recurring trends.