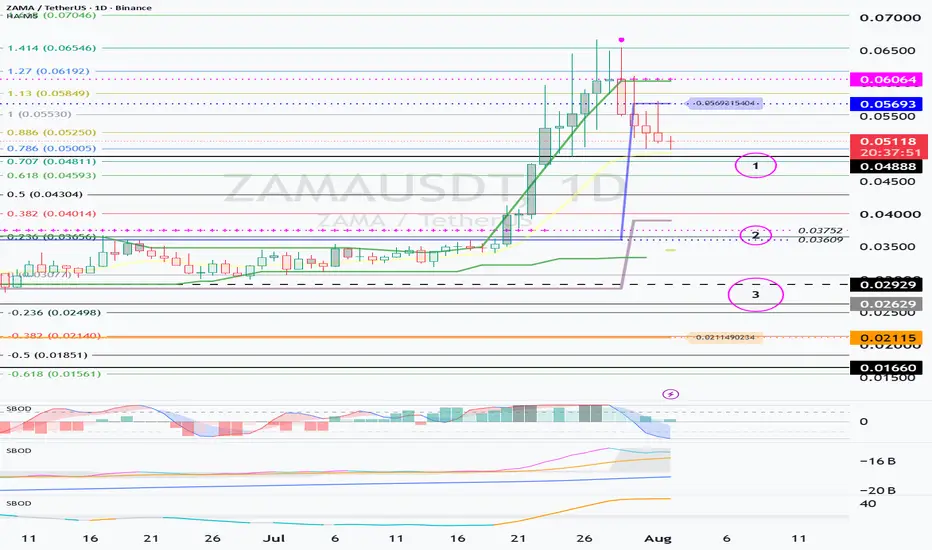
First Support Zone: Around 0.04888Hello.
Nice to meet you, fellow traders.
If you “Follow,” you can quickly check new chart analyses.
I hope you have a successful trade today.
━━━━━━━━━━━━━━━━━━━━━━━━━━━━━━━━━
ZAMA is a project that applies Fully Homomorphic Encryption (FHE) technology to blockchain.
The core of FHE is that
Zama / Tether SPOT
No trades
No trades
Compare with Zama / Tether SPOT
Technical Breakdown – ZAMAUSDTHey there , how u all doing? Hope good!!
ZAMA has delivered a clean breakout from a multi-month accumulation range, confirming a significant shift in market structure. After spending months consolidating above the macro support zone, buyers stepped in aggressively, pushing price through the key res
$ZAMA just delivered over 60%, exactly as expected. This is whyCRYPTOCAP:ZAMA just delivered over 60%, exactly as expected.
This is why I trust the chart more than the noise. I don't buy hype—I wait for confirmation and stick to my plan.
Congratulations to everyone who stayed with me. More opportunities are coming. 🚀📈
FOX Journal #11 | Not Every Beautiful Chart Is a TradeAt first glance, ZAMAUSDT looks like an excellent trend.
A clean staircase.
Strong market structure.
Higher highs. Higher lows.
Most traders would immediately start looking for an entry.
I didn't.
Why?
Because a beautiful chart alone isn't enough.
Every setup must also offer enough potential r
ZAMAUSDT Testing Major Resistance – Breakout or Rejection?📊 Technical Analysis
💵 Coin: CRYPTOCAP:ZAMA #ZAMA
⏳ Time Frame: 1D
📈 Pattern: Ascending Triangle 🔺
🎯 Outlook: Bullish Continuation if the breakout is successfully confirmed. 🚀
---
📖 Chart Analysis
📌 ZAMAUSDT is currently forming an Ascending Triangle 🔺, a classic bullish continuation patter
$ZAMA is right at a key level. The recent move looks strong, butCRYPTOCAP:ZAMA is right at a key level. The recent move looks strong, but now buyers need to prove they can keep control.
The $0.036–$0.04 zone is the one to watch. If price can hold above this area and turn it into support, the chances of another move higher increase significantly.
For now, the
ZAMA price analysis. Pump coming sooon ... ?👀 Take a closer look at CRYPTOCAP:ZAMA Could its pump be just around the corner?
#ZAMA is still a very young project. Like many newly listed tokens, it went through a brutal 90%+ correction after launch.
Today, only about 20% of the total supply is in circulation, while the project's market cap i
ZAMAUSDT Breakout IdeaI see that the price and volume is contracting, is showing relative strength against BTC, had an inside candle yesterday, is riding the 50 SMA, and daily volume is around 2 mil. Thinking about entering later today (11th July 2026) if price starts breaking out on increased volume or closes strong abo
ZAMA: A Long Term Bet on Privacy and Institutional AdoptionHi all,
As mentioned in my previous TOTAL3ES analysis, I decided to accept the losses from part of my previous portfolio and rotate that capital into new projects that I believe could play an important role in the coming years. One of those projects is ZAMA.
ZAMA is building privacy-preserving inf
ZAMA Looks Ready for a Drop (4H)It appears that a bullish wave has come to an end, and the price is likely preparing to enter a bearish phase.
A structural shift can also be observed on the chart.
We should wait for the price to retrace to higher levels before entering a position.
Consider entering positions in the supply zone
See all ideas
Summarizing what the indicators are suggesting.
Oscillators
Neutral
SellBuy
Strong sellStrong buy
Strong sellSellNeutralBuyStrong buy
Oscillators
Neutral
SellBuy
Strong sellStrong buy
Strong sellSellNeutralBuyStrong buy
Summary
Neutral
SellBuy
Strong sellStrong buy
Strong sellSellNeutralBuyStrong buy
Summary
Neutral
SellBuy
Strong sellStrong buy
Strong sellSellNeutralBuyStrong buy
Summary
Neutral
SellBuy
Strong sellStrong buy
Strong sellSellNeutralBuyStrong buy
Moving Averages
Neutral
SellBuy
Strong sellStrong buy
Strong sellSellNeutralBuyStrong buy
Moving Averages
Neutral
SellBuy
Strong sellStrong buy
Strong sellSellNeutralBuyStrong buy
Frequently asked questions
The current price of Zama / Tether SPOT (ZAMA) is 0.04844 USDT — it has fallen −1.57% in the past 24 hours. Try placing this info into the context by checking out what coins are also gaining and losing at the moment and seeing ZAMA price chart.
Zama / Tether SPOT price has fallen by −18.94% over the last week, its month performance shows a 50.52% increase, and as for the last year, Zama / Tether SPOT has increased by 64.37%. See more dynamics on ZAMA price chart.
Keep track of coins' changes with our Crypto Coins Heatmap.
Zama / Tether SPOT (ZAMA) reached its highest price on Jul 27, 2026 — it amounted to 0.06673 USDT. Find more insights on the ZAMA price chart.
See the list of crypto gainers and choose what best fits your strategy.
Zama / Tether SPOT (ZAMA) reached the lowest price of 0.01658 USDT on Feb 12, 2026. View more Zama / Tether SPOT dynamics on the price chart.
See the list of crypto losers to find unexpected opportunities.
The safest choice when buying ZAMA is to go to a well-known crypto exchange. Some of the popular names are Binance, Coinbase, Kraken. But you'll have to find a reliable broker and create an account first. You can trade ZAMA right from TradingView charts — just choose a broker and connect to your account.
Zama / Tether SPOT (ZAMA) is just as reliable as any other crypto asset — this corner of the world market is highly volatile. Today, for instance, Zama / Tether SPOT is estimated as 6.69% volatile. The only thing it means is that you must prepare and examine all available information before making a decision.
You can discuss Zama / Tether SPOT (ZAMA) with other users in our public chats, Minds or in the comments to Ideas.