First Support Zone: Around 0.04888Hello.
Nice to meet you, fellow traders.
If you “Follow,” you can quickly check new chart analyses.
I hope you have a successful trade today.
━━━━━━━━━━━━━━━━━━━━━━━━━━━━━━━━━
ZAMA is a project that applies Fully Homomorphic Encryption (FHE) technology to blockchain.
The core of FHE is that smart contracts can perform computations even without decrypting the data.
In other words, it allows for the processing of necessary calculations and verifications on-chain without disclosing the original source of sensitive data.
Due to these technical features, ZAMA is highly regarded for its potential in the following fields.
✓ DeFi requiring privacy
✓ Financial services for institutional investors
✓ RWA (Real-world Asset Tokenization)
✓ Private Stablecoins
✓ Sealed Bid Auctions
✓ AI-based On-chain Data Processing
✓ Protection of confidential data in on-chain finance
While existing privacy coins have focused on protecting transaction history or wallet information, ZAMA aims to be a next-generation privacy infrastructure that enables the utilization of encrypted data itself within smart contracts.
━━━━━━━━━━━━━━━━━━━━━━━━━━━━━━━━━━
The ZAMA token is a new token that has not been listed for long.
Therefore, the reliability of the support and resistance levels currently formed on the chart may be relatively low as sufficient trading history has not yet accumulated.
Since liquidity and volatility of newly listed coins can fluctuate rapidly, you must set your stop-loss criteria and position size in advance when entering a trade.
━━━━━━━━━━━━━━━━━━━━━━━━━━━━━━━━━
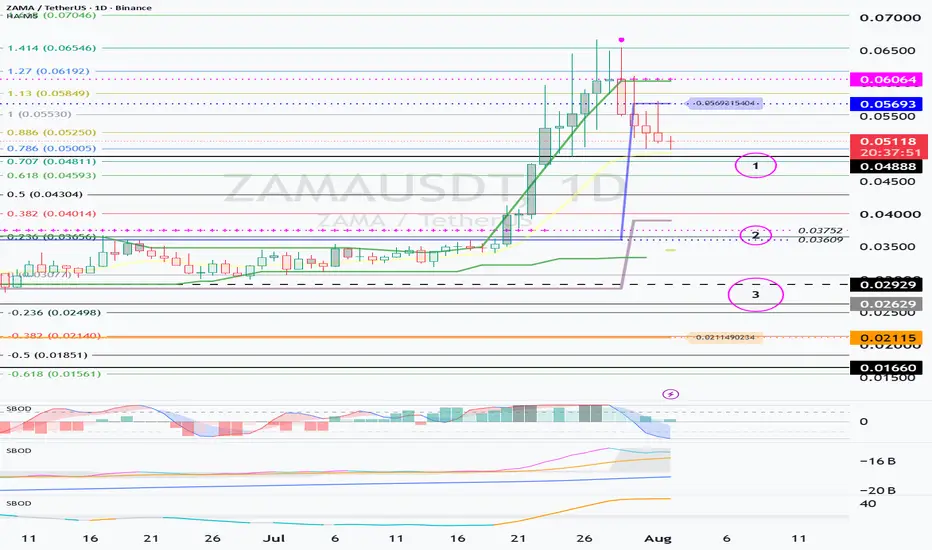
ZAMA is showing a corrective trend after forming a short-term high zone
0.05693 ~ 0.06064.
If the downtrend continues in the current zone, we need to check whether buying pressure flows in at the next support zone.
① 1st Support Zone: Around 0.04888
② 2nd Support Zone: 0.03609 ~ 0.03752
③ 3rd Key Support Zone: 0.02629 ~ 0.02929
━━━━━━━━━━━━━━━━━━━━━━━━━━━━━━━━━
In the current short-term trend, the first price to check is 0.04888.
If buying pressure flows in and the price shows signs of being supported around 0.04888, there is a possibility that the short-term correction will end and an upward wave will continue.
Therefore, the key point to watch on the current chart is:
“Can it be supported and rebound around 0.04888?”
However, if it breaks below 0.04888, the reaction of the Fibonacci retracement zones must be checked.
■ Key Fibonacci Zones
* 0.618 Zone: Around 0.04593
* 0.5 Zone: Around 0.04304
After the price touches these zones You must verify whether it recovers quickly and whether a rebound accompanied by trading volume occurs.
━━━━━━━━━━━━━━━━━━━━━━━━━━━━━━━━━━
The 0.03609 ~ 0.03752 range is the price level where the previous high was formed.
ZAMA formed a new high zone after breaking above this range.
Therefore, if a correction follows, you must verify whether this zone transitions from existing resistance to new support.
Resistance Breakout → Formation of Pullback → Support Transition
If this structure is completed, it can be judged that the uptrend is being maintained.
If the price remains stable above the 0.03609 ~ 0.03752 range, there is a possibility that a mid-term upward wave is still valid. It is high.
━━━━━━━━━━━━━━━━━━━━━━━━━━━━━━━━━━
A major supply zone has formed around 0.02629 based on the Volume Profile.
Therefore,
the 0.02629 ~ 0.02929 range can be viewed as a key support zone where
strong buying pressure is likely to flow in.
In this zone, the following conditions must be checked together:
✓ Whether trading volume is increasing
✓ Whether a long bullish candle or a candle with a lower wick appears
✓ Whether a bottom indicator is forming
✓ Whether there is a bullish divergence in auxiliary indicators
✓ Whether selling pressure is decreasing
However, if the price falls below 0.02629 and fails to recover, the likelihood of the existing support zone turning into a resistance zone increases.
Therefore, if it clearly breaks below 0.02629, aggressive It is advisable to stop trading and observe the market until a new bottom structure forms.
━━━━━━━━━━━━━━━━━━━━━━━━━━━━━━━━━━
Aggressive traders may consider a short-term entry after confirming support around 0.04888.
However, trading in this zone is best approached from a short-term or day trading perspective rather than a medium-to-long-term position.
Because newly listed coins are highly volatile, they may recover rapidly after temporarily breaking out of a support zone, or conversely, drop quickly after appearing to hold support.
Therefore, rather than entering a trade simply because the price has reached a support zone, you must also verify the following conditions:
✓ Candle reaction at the support zone
✓ Increase in trading volume
✓ Activation of the DOM (-60) indicator
✓ Position of the HA-Low indicator
✓ Bottom signal from auxiliary indicators
✓ Breakout of the short-term trend line Status
━━━━━━━━━━━━━━━━━━━━━━━━━━━━━━━━━━
Currently, the HA-Low indicator is
formed around 0.02115.
On the other hand, the DOM(-60) indicator has not yet been generated.
If the DOM(-60) indicator is newly generated during a further price decline, you must verify whether there is actual support at the price level where the indicator was formed.
Rather than buying immediately just because DOM(-60) has been generated, it is important to confirm the following movements:
Generation of DOM(-60)
→ Confirmation of support at that price level
→ Increase in trading volume
→ Breakout of short-term resistance
→ Review entry point
━━━━━━━━━━━━━━━━━━━━━━━━━━━━━━━━━
In the current chart structure, HA-Low The area around 0.02115, where the indicator is formed, can be viewed as the main buying candidate zone.
Therefore, trading strategies can be categorized as follows:
■ Short-term Trading Zone
* Around 0.04888
* Around 0.04304 ~ 0.04593
* Around 0.03609 ~ 0.03752
* Around 0.02629 ~ 0.02929
■ Main Buy Candidate Zone
* Around 0.02115, where the HA-Low indicator is formed
At price levels outside the main buying zone, you can consider a strategy of securing profits through short-term trading or increasing your holdings by the amount corresponding to the profits.
However, short-term trading quantities and medium-to-long-term holding quantities must be managed separately. ...does.
━━━━━━━━━━━━━━━━━━━━━━━━━━━━━━━━━━
Once the main purchase is completed, you must record the final average purchase price separately.
If you do not record the average purchase price, it is difficult to accurately assess actual returns and risks when prices surge or plummet.
━━━━━━━━━━━━━━━━━━━━━━━━━━━━━━━━━━
■ Short-term High Zone: 0.05693 ~ 0.06064
■ 1st Support: Around 0.04888
■ Fibonacci Support: 0.04593 / 0.04304
■ 2nd Support: 0.03609 ~ 0.03752
■ 3rd Key Support: 0.02629 ~ 0.02929
■ HA-Low: Around 0.02115
■ Trend Revocation Observation Zone: Failure to recover after breaking below 0.02629
━━━━━━━━━━━━━━━━━━━━━━━━━━━━━━━━━━
The first price to check on the current ZAMA chart is 0.04888.
If it finds support near 0.04888 and rises, there is a possibility that a short-term upward wave will continue.
Conversely, if it breaks below 0.04888, we must check for a rebound at the Fibonacci levels around 0.04593 and 0.04304.
In the medium term, it is important whether the price maintains above the previous high zone of 0.03609 ~ 0.03752.
Additionally, the major volume profile The formed range of 0.02629 to 0.02929 is a strong candidate for support.
However, if it fails to recover quickly after falling below 0.02629, there is a possibility that the existing support will turn into resistance; therefore, you should temporarily suspend trading and observe the market until a new trend forms.
It is worth watching to see if privacy blockchains, which have faded from market attention for some time, can regain focus based on the new technology known as FHE.
If ZAMA expands real-world use cases in fields such as institutional finance, RWA, AI, and DeFi, there is a possibility that it could create a new trend in the privacy blockchain market.
━━━━━━━━━━━━━━━━━━━━━━━━━━━━━━━━━
Thank you for reading to the end.
I wish you successful trading.
ZAMA / TetherUS
No trades
No trades
In-depth trading ideas
Technical Breakdown – ZAMAUSDTHey there , how u all doing? Hope good!!
ZAMA has delivered a clean breakout from a multi-month accumulation range, confirming a significant shift in market structure. After spending months consolidating above the macro support zone, buyers stepped in aggressively, pushing price through the key resistance that had capped the trend since June.
The recent breakout is supported by expanding volume, suggesting that this move is driven by genuine demand rather than short-term speculation. As long as price holds above the former resistance, the bullish structure remains intact.
Key Technical Levels:
Support: ~$0.0400–0.0450 (previous resistance turned support)
Current Price: ~$0.0610
Major Resistance / Target 1: ~$0.0810 Target 2: 0.12.. and above if volumes confirm the upward direction.
Macro Support: ~$0.0168
Bullish Scenario
If buyers successfully defend the breakout zone around $0.04–0.045, the probability increases for a continuation toward $0.081. A decisive close above that level could trigger the next impulsive leg as momentum traders and new capital enter the market.
Market Structure
Multi-month accumulation completed.
Resistance successfully reclaimed.
Higher highs and higher lows are beginning to develop.
Volume expansion confirms increasing market participation.
Overall, ZAMA is showing one of the healthiest technical structures among newer crypto projects. Holding the breakout area is the key condition for maintaining bullish momentum, while a move above $0.081 would likely confirm the beginning of a much larger price discovery phase.
$ZAMA just delivered over 60%, exactly as expected. This is whyCRYPTOCAP:ZAMA just delivered over 60%, exactly as expected.
This is why I trust the chart more than the noise. I don't buy hype—I wait for confirmation and stick to my plan.
Congratulations to everyone who stayed with me. More opportunities are coming. 🚀📈
FOX Journal #11 | Not Every Beautiful Chart Is a TradeAt first glance, ZAMAUSDT looks like an excellent trend.
A clean staircase.
Strong market structure.
Higher highs. Higher lows.
Most traders would immediately start looking for an entry.
I didn't.
Why?
Because a beautiful chart alone isn't enough.
Every setup must also offer enough potential reward to justify the risk.
On this chart, the distance to my minimum target was simply too large for my trading plan.
That doesn't make it a bad chart.
It simply makes it not my trade.
One of the hardest lessons in trading is accepting that not every attractive setup deserves an entry.
Discipline isn't only about taking the right trades. It's also about rejecting the wrong ones.
Sometimes the best trade... is no trade.
ZAMAUSDT Testing Major Resistance – Breakout or Rejection?📊 Technical Analysis
💵 Coin: CRYPTOCAP:ZAMA #ZAMA
⏳ Time Frame: 1D
📈 Pattern: Ascending Triangle 🔺
🎯 Outlook: Bullish Continuation if the breakout is successfully confirmed. 🚀
---
📖 Chart Analysis
📌 ZAMAUSDT is currently forming an Ascending Triangle 🔺, a classic bullish continuation pattern that generally has a higher probability of breaking to the upside.
Here are the key observations:
✅ 📐 The ascending trendline support continues to create Higher Lows, indicating increasing buying pressure and that buyers remain in control.
✅ 🟨 The yellow zone represents a major horizontal resistance, which has rejected price multiple times.
✅ 📈 Price is now testing this resistance again after forming a series of Higher Lows, suggesting that buyers are still accumulating.
💡 The more frequently a resistance level is tested without a significant pullback, the greater the probability that it will eventually break.
---
🟢 Bullish Scenario 🚀📈
✅ If the Daily candle closes above the resistance zone with increasing trading volume 📊, the Ascending Triangle breakout will be confirmed.
This could trigger:
🚀 Stronger bullish momentum.
💰 New buying pressure driven by breakout FOMO.
📈 A move toward the next resistance level with attractive upside potential.
🟢 As long as price remains above the ascending trendline, the bullish market structure stays intact and further upside remains possible.
---
🔴 Bearish Scenario 📉⚠️
❌ If price fails to break above the resistance and experiences a strong rejection:
📉 Price could pull back toward the ascending trendline, which serves as dynamic support.
⚠️ If this trendline is broken, the Ascending Triangle pattern would be considered invalid (Failed Breakout Setup).
🔻 This could lead to a deeper correction as buyers begin to lose momentum.
🛡️ As long as the ascending support remains intact, any pullback can still be viewed as a healthy retracement within the overall uptrend.
---
📌 Conclusion 🎯
🔥 ZAMAUSDT is currently at a critical stage, as price is testing the key resistance of the Ascending Triangle pattern.
🟢 A confirmed breakout could signal the beginning of the next bullish leg.
🔴 A rejection is still possible, but as long as the ascending trendline holds, the bullish structure remains valid.
⏳ Traders should wait for a confirmed Daily candle close before making trading decisions to avoid falling into a fake breakout.
🚀 #ZAMA #ZAMAUSDT #Crypto #Cryptocurrency #Altcoin #TechnicalAnalysis #TradingView #AscendingTriangle #Bullish #Breakout #PriceAction #CryptoTrading #Binance #ChartAnalysis #SupportAndResistance #Trading #BullishSetup #BreakoutAlert #CryptoAnalysis #DailyChart
$ZAMA is right at a key level. The recent move looks strong, butCRYPTOCAP:ZAMA is right at a key level. The recent move looks strong, but now buyers need to prove they can keep control.
The $0.036–$0.04 zone is the one to watch. If price can hold above this area and turn it into support, the chances of another move higher increase significantly.
For now, the structure still looks healthy. Holding this zone is the key before expecting the next leg up.
ZAMA price analysis. Pump coming sooon ... ?👀 Take a closer look at CRYPTOCAP:ZAMA Could its pump be just around the corner?
#ZAMA is still a very young project. Like many newly listed tokens, it went through a brutal 90%+ correction after launch.
Today, only about 20% of the total supply is in circulation, while the project's market cap is roughly $75M.
As for fundamentals... It's probably still too early to draw serious conclusions.
But the chart is becoming increasingly interesting.
Looking at OKX:ZAMAUSDT , it feels like the long consolidation phase is approaching its natural end.
And after long periods of accumulation, strong impulsive moves often follow.
What's even more interesting is that over the past few days, sellers haven't been able to push the price lower despite the overall weakness in the crypto market.
That makes us think the next big move could be to the upside.
📈 Our first targets are:
🟢 $0.0444
🟡 $0.051
🔴 And if momentum really builds, we wouldn't rule out a move toward $0.069.
Of course, it's just one possible scenario. The market will have the final say.
💬 What do you think? Is CRYPTOCAP:ZAMA quietly being accumulated before a breakout, or does it need more time to consolidate?
______________
◆ Follow us ❤️ for daily crypto insights & updates!
🚀 Don’t miss out on important market moves
🧠 DYOR | This is not financial advice, just thinking out loud
ZAMAUSDT Breakout IdeaI see that the price and volume is contracting, is showing relative strength against BTC, had an inside candle yesterday, is riding the 50 SMA, and daily volume is around 2 mil. Thinking about entering later today (11th July 2026) if price starts breaking out on increased volume or closes strong above the two trendlines with a stop below the low of today.
ZAMA: A Long Term Bet on Privacy and Institutional AdoptionHi all,
As mentioned in my previous TOTAL3ES analysis, I decided to accept the losses from part of my previous portfolio and rotate that capital into new projects that I believe could play an important role in the coming years. One of those projects is ZAMA.
ZAMA is building privacy-preserving infrastructure using Fully Homomorphic Encryption (FHE), a technology that allows computations to be performed on encrypted data without ever exposing the underlying information. Potential use cases include private finance, confidential AI, healthcare data processing, and secure blockchain applications.
The project is still in its early stages, but I like the story. I believe that as traditional finance gradually enters the crypto space, demand for privacy-preserving and compliant technologies will increase significantly. With a current market capitalization of around $75 million and a price only slightly above its IEO level, I think the project remains in a reasonable accumulation zone from a long-term investment perspective.
More reference levels can be found on the chart. From a trading perspective, the price is currently sitting just below a major resistance area, so caution is warranted. However, if we see a summer rally into July/August, I would not be surprised to see the price reach the $0.09-$0.10 range. That would likely be my first profit-taking zone, while keeping the majority of the position for what I expect could be a larger move during the 2027 cycle.
Additional targets are shown on the chart. If the broader market enters a strong bull phase, I believe there is a realistic path toward a $1 billion market capitalization. My current plan is to reduce risk significantly around my second 2027 target and potentially keep only around 10% of the position for a final moonshot target.
As always, these are simply my personal views and not financial advice.
Please do your own research.
Cheers!
ZAMA Looks Ready for a Drop (4H)It appears that a bullish wave has come to an end, and the price is likely preparing to enter a bearish phase.
A structural shift can also be observed on the chart.
We should wait for the price to retrace to higher levels before entering a position.
Consider entering positions in the supply zone using DCA, or wait for confirmation.
The targets are marked on the chart. At the first target, move your stop to breakeven and take partial profits.
A daily candle close above the invalidation level will invalidate this analysis.
If you have a coin or altcoin you want analyzed, first hit the like button and then comment its name so I can review it for you.
Do you also think ZAMA is bullish?
ZAMAUSDT Forming Bullish MomentumZAMAUSDT is forming a clear bullish momentum pattern, a classic bullish wave signal that often indicates an upcoming breakout. The price has been consolidating within a narrowing range, suggesting that selling pressure is weakening while buyers are beginning to regain control. With consistent volume confirming accumulation at lower levels, the setup hints at a potential bullish breakout soon. The projected move could lead to an impressive gain of around 70% to 80% once the price breaks above the wedge resistance.
This bullish momentum pattern is typically seen at the end of downtrends or corrective phases, and it represents a potential shift in market sentiment from bearish to bullish. Traders closely watching ZAMAUSDT are noting the strengthening momentum as it nears a breakout zone. The good trading volume adds confidence to this pattern, showing that market participants are positioning early in anticipation of a reversal.
Investors’ growing interest in ZAMAUSDT reflects rising confidence in the project’s long-term fundamentals and current technical strength. If the breakout confirms with sustained volume, this could mark the start of a fresh bullish leg. Traders might find this a valuable setup for medium-term gains, especially as the wedge pattern completes and buying momentum accelerates.
✅ Show your support by hitting the like button
✅ Leaving a comment below! (What is your opinion about this coin?)
Your feedback and engagement keep me inspired to share more insightful market analysis with you!
ZAMAUSDT Forming Bullish MomentumZAMAUSDT is forming a clear bullish momentum pattern, a classic bullish wave signal that often indicates an upcoming breakout. The price has been consolidating within a narrowing range, suggesting that selling pressure is weakening while buyers are beginning to regain control. With consistent volume confirming accumulation at lower levels, the current setup hints at a potential bullish breakout soon. The projected move could lead to an impressive gain of around 70% to 80% once the price breaks above the key resistance zone.
This bullish momentum pattern is typically seen at the end of downtrends or corrective phases, and it represents a possible shift in market sentiment from bearish to bullish. Traders closely watching ZAMAUSDT are noticing strengthening momentum as the coin approaches an important breakout area. The healthy trading volume adds confidence to this setup, showing that market participants may already be positioning early in anticipation of a strong reversal.
Investors’ growing interest in ZAMAUSDT reflects increasing confidence in the project’s technical structure and long-term potential. If the breakout confirms with sustained buying pressure and solid volume support, this could signal the beginning of a fresh bullish rally. Traders may find this an attractive medium-term opportunity, especially as the bullish momentum pattern nears completion and buying pressure continues to build.
✅ Show your support by hitting the like button!
✅ Leave a comment below! (What is your opinion about this coin?)
Your feedback and engagement keep me inspired to share more insightful market analysis with you!
ZAMA Sell/Short Setup (4H)ZAMA has encountered an important area after forming a SW H.
Then, a bearish iCH was formed on the chart.
The internal structure indicates that a larger structure is likely to become bearish soon.
If the price reaches the specified supply zone, it could drop downward. You can enter the supply box with a DCA approach or wait for confirmation.
The targets are marked on the chart.
Closing a daily candle above the invalidation level would confirm a violation of this analysis.
If you would like us to analyze a coin or altcoin for you, first like this post, then comment the name of your altcoin below.
What is your opinion about ZAMA?
ZAMAUSDT Forming Bullish MomentumZAMAUSDT is forming a clear bullish momentum pattern, a classic bullish reversal signal that often indicates an upcoming breakout. The price has been consolidating within a narrowing range, suggesting that selling pressure is weakening while buyers are beginning to regain control. With consistent volume confirming accumulation at lower levels, the setup hints at a potential bullish breakout soon. The projected move could lead to an impressive gain of around 70% to 80% once the price breaks above the wedge resistance.
This bullish momentum pattern is typically seen at the end of downtrends or corrective phases, and it represents a potential shift in market sentiment from bearish to bullish. Traders closely watching ZAMAUSDT are noting the strengthening momentum as it nears a breakout zone. The good trading volume adds confidence to this pattern, showing that market participants are positioning early in anticipation of a reversal.
Investors’ growing interest in ZAMAUSDT reflects rising confidence in the project’s long-term fundamentals and current technical strength. If the breakout confirms with sustained volume, this could mark the start of a fresh bullish leg. Traders might find this a valuable setup for medium-term gains, especially as the pattern completes and buying momentum accelerates.
✅ Show your support by hitting the like button and
✅ Leaving a comment below! (What is your opinion about this Coin?)
Your feedback and engagement keep me inspired to share more insightful market analysis with you!
ZAMAUSDT Forming Falling WedgeZAMAUSDT is forming a clear falling wedge pattern, a classic bullish reversal signal that often indicates an upcoming breakout. The price has been consolidating within a narrowing range, suggesting that selling pressure is weakening while buyers are beginning to regain control. With consistent volume confirming accumulation at lower levels, the setup hints at a potential bullish breakout soon. The projected move could lead to an impressive gain of around 140% to 150% once the price breaks above the wedge resistance.
This falling wedge pattern is typically seen at the end of downtrends or corrective phases, and it represents a potential shift in market sentiment from bearish to bullish. Traders closely watching ZAMAUSDT are noting the strengthening momentum as it nears a breakout zone. The good trading volume adds confidence to this pattern, showing that market participants are positioning early in anticipation of a reversal.
Investors’ growing interest in ZAMAUSDT reflects rising confidence in the project’s long-term fundamentals and current technical strength. If the breakout confirms with sustained volume, this could mark the start of a fresh bullish leg. Traders might find this a valuable setup for medium-term gains, especially as the wedge pattern completes and buying momentum accelerates.
✅ Show your support by hitting the like button and
✅ Leaving a comment below! (What is your opinion about this Coin?)
Your feedback and engagement keep me inspired to share more insightful market analysis with you!
ZAMA ACCUMULATION FINISHED🔥 Fortune AI Radar — CRYPTOCAP:ZAMA
Fresh activity detected on CRYPTOCAP:ZAMA today.
Data suggests increasing market interest & buyers stepping in.
Technicals currently lean bullish, with momentum trending upward.
Whales showing hints of accumulation and hype rising among trader