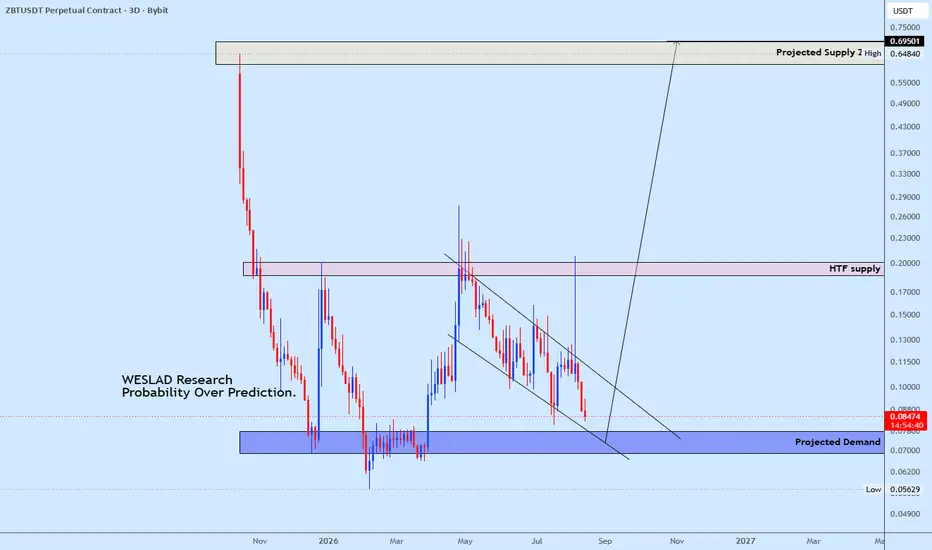
ZBT | Watching for a Bullish Response at DemandZBT is currently moving toward the projected demand zone around 0.068–0.080, where buyers have previously shown interest.
The key area to watch is the reaction from demand. A strong bullish response — particularly a rejection/sweep followed by bullish displacement — could provide the confirmation f
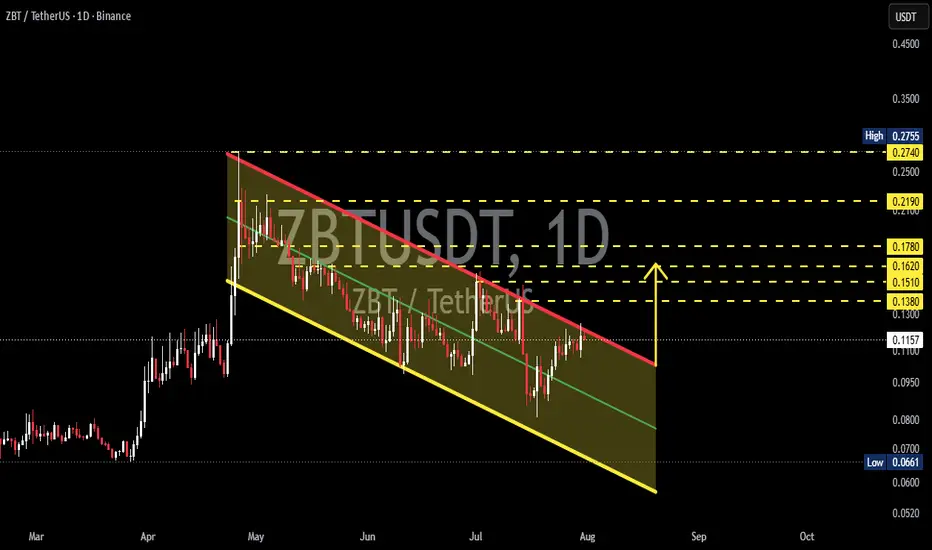
ZBTUSDT – Descending Channel Near Critical Resistance!📊 Technical Analysis
💰 Coin: $ZBT #ZBT
⏳ Time Frame: 1D
📉 Pattern: Descending Channel (Bullish Reversal Setup)
🎯 Market Bias: Neutral to Bullish (Breakout Confirmation Required)
---
📌 Pattern Analysis
🔻 Descending Channel
ZBT is still trading inside a Descending Channel, a pattern formed by
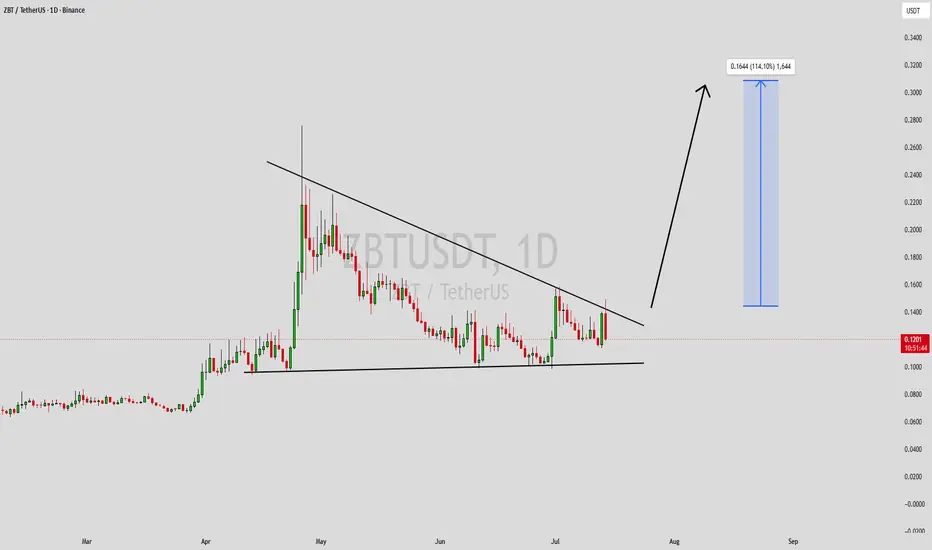
ZBTUSDT Forming Falling WedgeZBTUSDT is forming a clear falling wedge pattern, a classic bullish wave signal that often indicates an upcoming breakout. The price has been consolidating within a narrowing range, suggesting that selling pressure is gradually weakening while buyers are beginning to regain control. With consistent
ZBTUSDT Forming Bullish MomentumZBTUSDT is forming a clear bullish momentum pattern, a classic bullish wave signal that often indicates an upcoming breakout. The price has been consolidating within a narrowing range, suggesting that selling pressure is weakening while buyers are beginning to regain control. With consistent volume
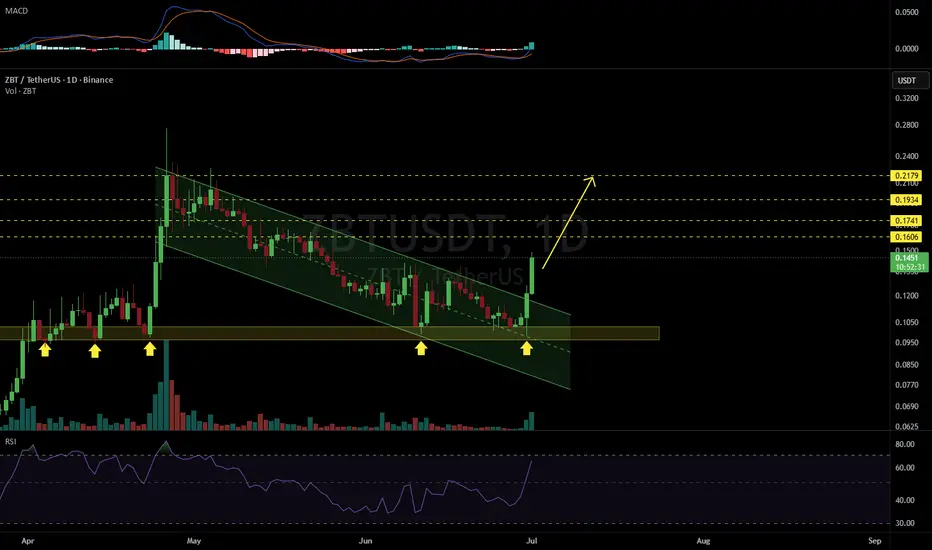
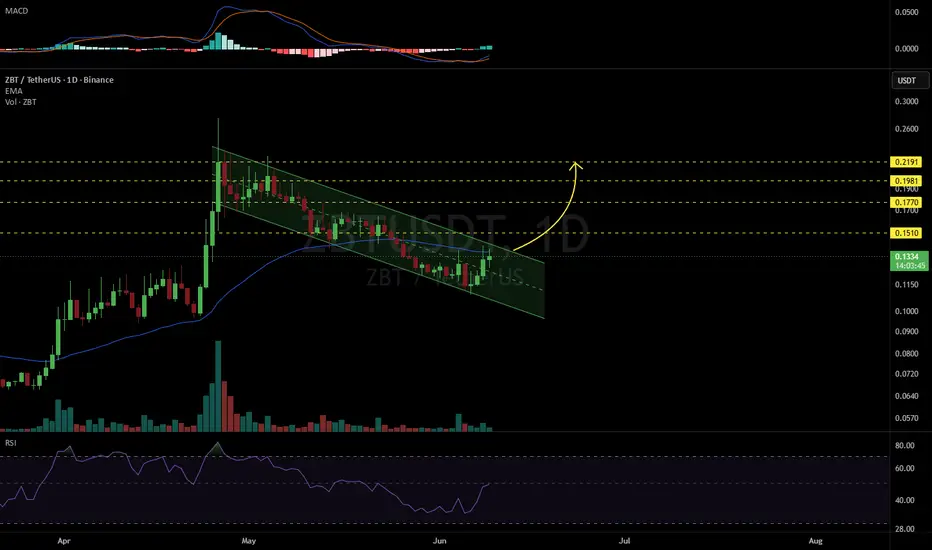
ZBTUSDT 1D#ZBT is currently trading within a bullish flag pattern on the daily chart.
Consider entering this coin only after a confirmed breakout above both the flag resistance and the daily EMA50. If the breakout is confirmed, the following upside targets could come into play:
🎯 $0.1510
🎯 $0.1770
🎯 $0.1981
ZBT/USDT – Range Reclaim Targeting +17%After a prolonged downtrend, ZBT/USDT has found a solid bottom at ~0.1174 and is now attempting to reclaim the key resistance level at ~0.1327 - a zone that previously acted as major support before the breakdown.
Price is currently consolidating just above this level, showing early signs of strengt
ZBTUSDT Forming Bullish MomentumZBTUSDT is forming a clear bullish momentum pattern, a classic bullish continuation signal that often points toward a strong breakout in the near future. The price has been consolidating within a tightening range, suggesting that selling pressure is gradually weakening while buyers continue to regai
ZBT is on a strong bullish run! (4H)From the point where we marked the green arrow on the chart, ZBT appears to have entered a bullish phase, suggesting that the correction has likely ended.
We are currently observing a bullish impulse wave, which we are labeling as wave A. After this move, the price has entered a corrective phase, w
See all ideas
Summarizing what the indicators are suggesting.
Oscillators
Neutral
SellBuy
Strong sellStrong buy
Strong sellSellNeutralBuyStrong buy
Oscillators
Neutral
SellBuy
Strong sellStrong buy
Strong sellSellNeutralBuyStrong buy
Summary
Neutral
SellBuy
Strong sellStrong buy
Strong sellSellNeutralBuyStrong buy
Summary
Neutral
SellBuy
Strong sellStrong buy
Strong sellSellNeutralBuyStrong buy
Summary
Neutral
SellBuy
Strong sellStrong buy
Strong sellSellNeutralBuyStrong buy
Moving Averages
Neutral
SellBuy
Strong sellStrong buy
Strong sellSellNeutralBuyStrong buy
Moving Averages
Neutral
SellBuy
Strong sellStrong buy
Strong sellSellNeutralBuyStrong buy
Displays a symbol's price movements over previous years to identify recurring trends.