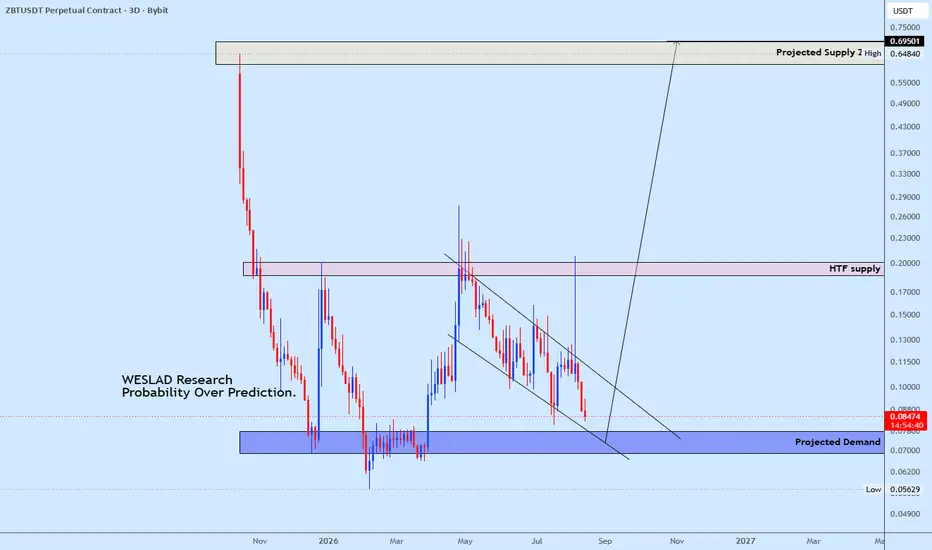
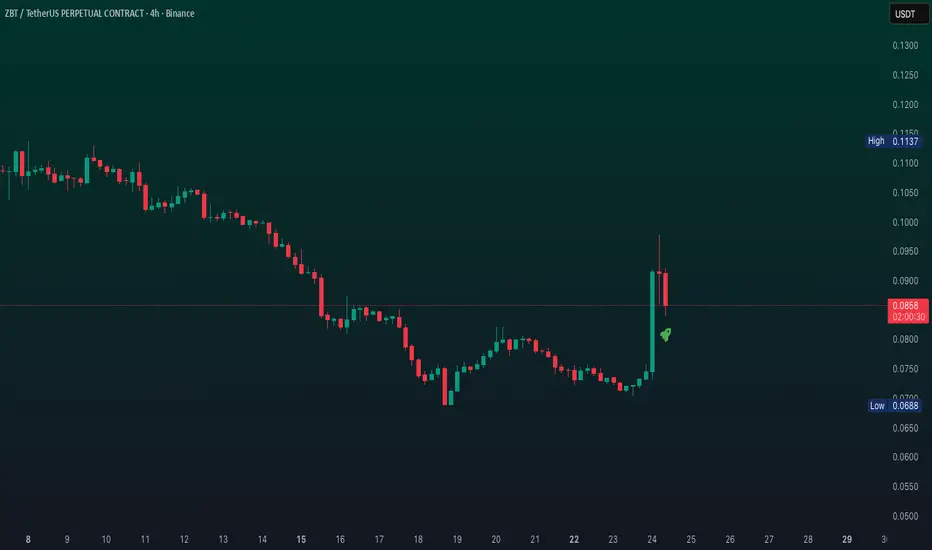
ZBT | Watching for a Bullish Response at DemandZBT is currently moving toward the projected demand zone around 0.068–0.080, where buyers have previously shown interest.
The key area to watch is the reaction from demand. A strong bullish response — particularly a rejection/sweep followed by bullish displacement — could provide the confirmation for a recovery toward the HTF supply zone around 0.185–0.205.
If demand fails to generate a meaningful bullish response, the recovery scenario weakens and price may continue searching for lower liquidity.
ZEROBASE/USD Tether Spot
No trades
No trades
In-depth trading ideas
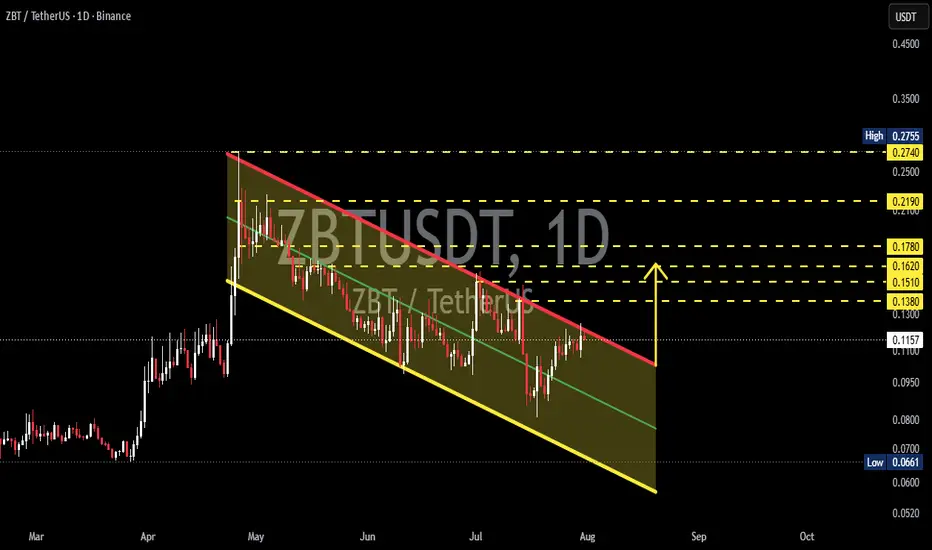
ZBTUSDT – Descending Channel Near Critical Resistance!📊 Technical Analysis
💰 Coin: $ZBT #ZBT
⏳ Time Frame: 1D
📉 Pattern: Descending Channel (Bullish Reversal Setup)
🎯 Market Bias: Neutral to Bullish (Breakout Confirmation Required)
---
📌 Pattern Analysis
🔻 Descending Channel
ZBT is still trading inside a Descending Channel, a pattern formed by a series of lower highs and lower lows. Although this structure reflects short-term bearish pressure, a Descending Channel is often considered a bullish reversal pattern if the price successfully breaks above the upper resistance trendline with strong volume.
📍 At the moment, the price is approaching the upper trendline resistance, making this a critical decision zone for the next major move.
---
🟢 Bullish Scenario
✅ If ZBT successfully breaks above the red trendline and closes a daily candle above it, the probability of a trend reversal will increase significantly.
🎯 Potential upside targets:
🟡 0.1380 USDT
Initial resistance after the breakout.
🟡 0.1510 USDT
First major supply zone.
🟡 0.1620 USDT
Intermediate resistance level.
🟡 0.1780 USDT
Next bullish target if momentum remains strong.
🟡 0.2190 USDT
Major resistance where profit-taking may occur.
🟡 0.2740 USDT
Primary upside target and the previous swing high.
📈 A breakout supported by strong trading volume would significantly increase the probability of a new uptrend.
---
🔴 Bearish Scenario
❌ If the price gets rejected at the upper trendline and fails to break out, the Descending Channel will remain valid.
⚠️ In that case, the price may:
🔻 Retrace toward the channel midline, which acts as dynamic support.
🔻 Continue declining toward the lower trendline.
🔻 If the lower support is broken, selling pressure could intensify, leading to a deeper correction.
📉 As long as the channel resistance remains intact, traders should remain cautious of continued bearish momentum.
---
🔍 Key Levels
🟢 Resistance:
0.1380
0.1510
0.1620
0.1780
0.2190
0.2740
🔴 Support:
Descending Channel Midline
Descending Channel Lower Trendline
Previous Low around 0.0661
---
⚡ Trading Insight
💡 A Descending Channel frequently results in a bullish breakout, but confirmation is the key factor.
📊 Watch for:
✅ A daily candle closing above the resistance trendline.
✅ Increasing trading volume during the breakout.
✅ A successful retest of the broken resistance as new support.
Without these confirmations, the price may continue moving sideways or remain within the descending channel.
---
🎯 Conclusion
🚀 ZBT is currently trading at a critical decision point.
📈 A confirmed breakout from the Descending Channel could open the door for a rally toward the 0.1380–0.2740 USDT resistance zone.
📉 However, if the breakout fails, the price may remain inside the channel and retest the lower support levels.
⚠️ Always wait for breakout confirmation before making any trading decisions, as this area will likely determine ZBT's next major trend.
#ZBT #ZBTUSDT #Crypto #Cryptocurrency #Altcoin #TechnicalAnalysis #TradingView #Binance #PriceAction #DescendingChannel #Breakout #Bullish #Bearish #Support #Resistance #CryptoTrading #ChartAnalysis #Altcoins
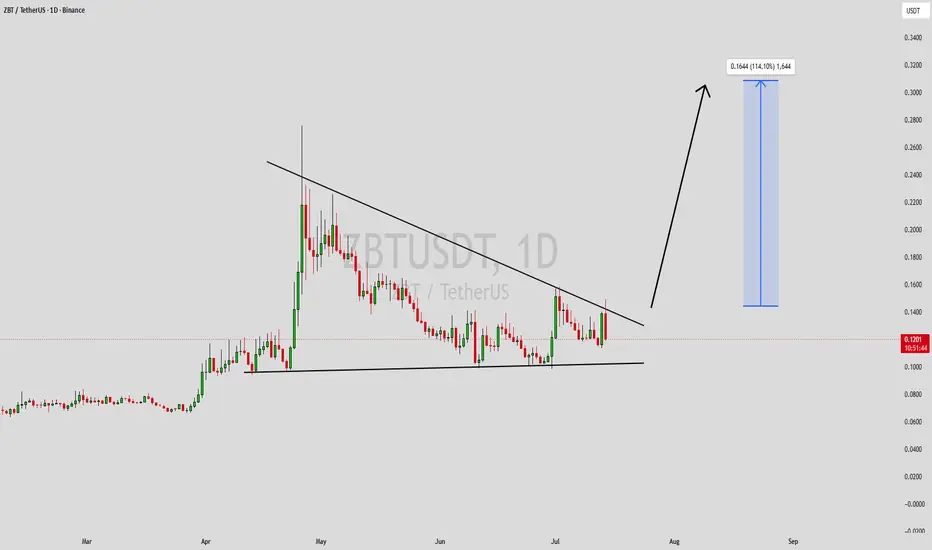
ZBTUSDT Forming Falling WedgeZBTUSDT is forming a clear falling wedge pattern, a classic bullish wave signal that often indicates an upcoming breakout. The price has been consolidating within a narrowing range, suggesting that selling pressure is gradually weakening while buyers are beginning to regain control. With consistent trading volume confirming accumulation at lower levels, the current setup hints at a potential bullish breakout in the near future. If the breakout is confirmed, the projected move could lead to an impressive gain of around 90% to 100%.
This falling wedge pattern is commonly seen at the end of downtrends or corrective phases, signaling a potential shift in market sentiment from bearish to bullish. Traders closely watching ZBTUSDT are noticing strengthening momentum as the price approaches a key breakout zone. Healthy trading volume further reinforces this setup, indicating that market participants are positioning early in anticipation of a sustained upward move.
Growing investor interest in ZBTUSDT reflects increasing confidence in the project's long-term potential and its current technical structure. If buyers successfully push the price above the wedge resistance with sustained volume, it could mark the beginning of a fresh bullish leg. The ongoing consolidation phase suggests steady accumulation, creating favorable conditions for a strong continuation rally once the breakout is confirmed.
Traders may find this an attractive medium-term opportunity, especially as the falling wedge pattern nears completion and buying pressure continues to build. A confirmed breakout could attract additional market participation and accelerate the move toward the projected upside target.
✅ Show your support by hitting the like button.
✅ Leaving a comment below! (What is You opinion about this Coin)
Your feedback and engagement keep me inspired to share more insightful market analysis with you!
ZBTUSDT Forming Bullish MomentumZBTUSDT is forming a clear bullish momentum pattern, a classic bullish wave signal that often indicates an upcoming breakout. The price has been consolidating within a narrowing range, suggesting that selling pressure is weakening while buyers are beginning to regain control. With consistent volume confirming accumulation at lower levels, the setup hints at a potential bullish breakout soon. The projected move could lead to an impressive gain of around 140% to 150% once the price breaks above the key resistance zone.
This bullish momentum pattern is typically seen at the end of downtrends or corrective phases, and it represents a potential shift in market sentiment from bearish to bullish. Traders closely watching ZBTUSDT are noting the strengthening momentum as it approaches a critical breakout area. The healthy trading volume adds confidence to this setup, showing that market participants may be positioning early in anticipation of a larger move.
Investors’ growing interest in ZBTUSDT reflects increasing confidence in the project's potential and current technical strength. If the breakout confirms with sustained buying volume, this could mark the beginning of a fresh bullish leg. Traders may find this an attractive setup for medium-term gains, especially as momentum continues to build and bullish pressure strengthens.
✅ Show your support by hitting the like button!
✅ Leave a comment below: What is your opinion about ZBTUSDT?
Your feedback and engagement keep me inspired to share more insightful market analysis with you!
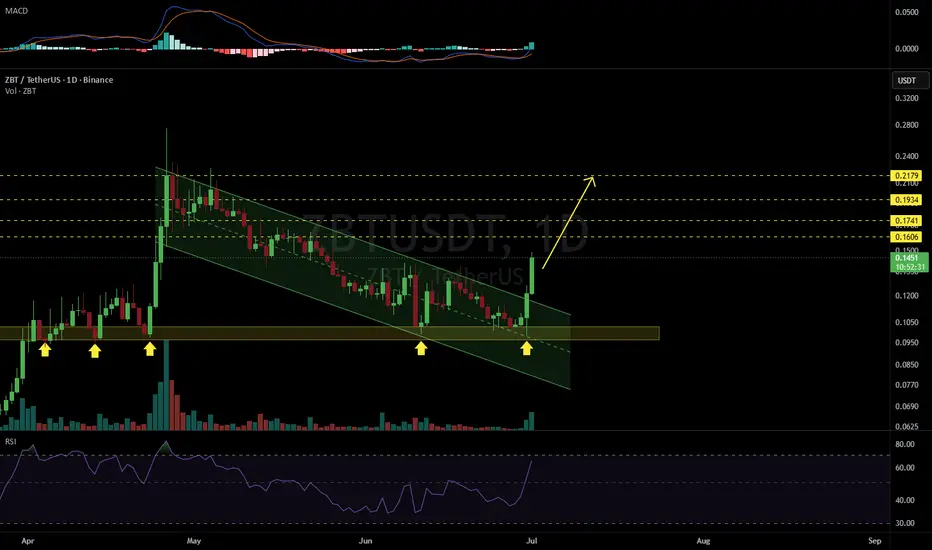
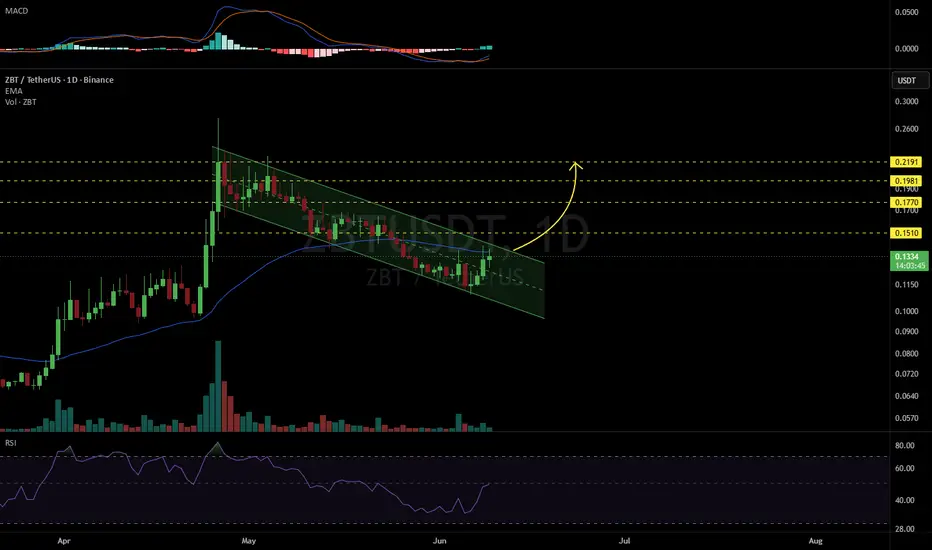
ZBTUSDT 1D#ZBT is currently trading within a bullish flag pattern on the daily chart.
Consider entering this coin only after a confirmed breakout above both the flag resistance and the daily EMA50. If the breakout is confirmed, the following upside targets could come into play:
🎯 $0.1510
🎯 $0.1770
🎯 $0.1981
🎯 $0.2191
⚠️ Always remember to use a tight stop-loss and maintain proper risk management.
ZBT/USDT – Range Reclaim Targeting +17%After a prolonged downtrend, ZBT/USDT has found a solid bottom at ~0.1174 and is now attempting to reclaim the key resistance level at ~0.1327 - a zone that previously acted as major support before the breakdown.
Price is currently consolidating just above this level, showing early signs of strength. A confirmed hold and push through 0.1327 would open the path toward the 0.1557 resistance zone, a gain of approximately 17.18% from current price.
ZBTUSDT Forming Bullish MomentumZBTUSDT is forming a clear bullish momentum pattern, a classic bullish continuation signal that often points toward a strong breakout in the near future. The price has been consolidating within a tightening range, suggesting that selling pressure is gradually weakening while buyers continue to regain control near important support levels. This type of setup is commonly associated with accumulation phases before a major bullish move begins.
The projected breakout from this bullish momentum structure could lead to an impressive gain of around 90% to 100% if the price confirms above the resistance zone with strong volume support. This pattern is frequently seen after corrective phases and may signal a transition from bearish sentiment into a fresh bullish trend.
Traders closely watching ZBTUSDT are noticing strengthening momentum as the price approaches a critical breakout area. The stable trading volume adds confidence to the setup, showing that buyers may already be accumulating positions in anticipation of a bullish continuation move.
Growing investor interest in ZBTUSDT reflects increasing confidence in both its technical outlook and long-term upside potential. If the breakout confirms with sustained buying pressure and strong follow-through momentum, this could mark the beginning of a powerful bullish wave.
✅ Show your support by hitting the like button and
✅ Leaving a comment below! (What is your opinion about this coin?)
Your feedback and engagement keep me inspired to share more insightful market analysis with you!
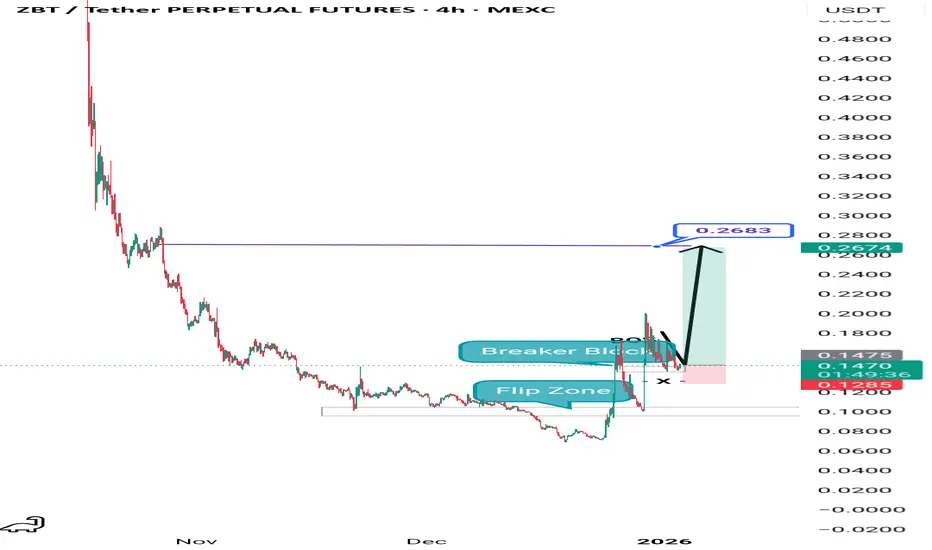
ZBT is on a strong bullish run! (4H)From the point where we marked the green arrow on the chart, ZBT appears to have entered a bullish phase, suggesting that the correction has likely ended.
We are currently observing a bullish impulse wave, which we are labeling as wave A. After this move, the price has entered a corrective phase, which we are considering wave B.
Within the green zone, we expect wave B to complete, after which the price could potentially transition into wave C to the upside.
The targets are already marked on the chart. At the first target, it is recommended to move to breakeven and secure partial profits.
A daily candle closing below the invalidation level will negate this analysis.
If you have a symbol you want analyzed, first hit the like button and then comment its name so I can review it for you.
Do you also think ZBT is bullish?
ZBT/USDT — Structure holds after impulsive expansionAfter a strong impulsive move, price is currently consolidating above the key support zone around 0.0970, forming a short-term range between support and resistance (≈0.1123).
The structure remains bullish as long as price holds above the local base and continues to respect higher lows. What matters here is not chasing momentum, but reacting to structure.
Key levels:
• Support: 0.0970
• Resistance: 0.1123
Trade plan:
• Entry zone: 0.1013 – 0.1023
• Stop loss: 0.0970
• Targets: 0.1123 / 0.1174
The idea is simple:
wait for price to react within the entry zone and confirm continuation.
Entering after expansion without structure = weak positioning.
Entering on reaction within structure = controlled risk.
This is a high-volatility environment, so execution matters more than bias.
Conclusion:
Bullish structure remains intact, but only valid while support holds.
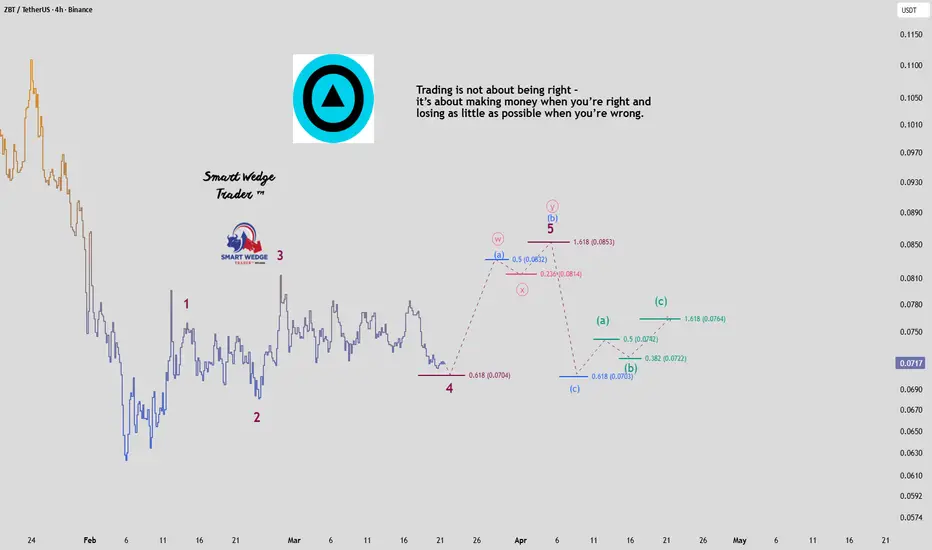
$ZBT Deep Correction Unfolding – Wave 5 of (C) Targeting 0.0717!BINANCE:ZBTUSDT
$ZBT Deep Correction Unfolding – Wave 5 of (C) Targeting 0.0717! 📉
Expected path for the cryptocurrency #ZBTUSDT on the 4-hour timeframe
Anticipated final leg lower 📉
🧐 The larger corrective structure remains in play, with price currently developing wave 5 within wave (C) of a complex W-X-Y zigzag. After a sharp impulsive wave 3 lower and a partial wave 4 bounce forming a W-X pattern, we are now witnessing the early stages of the final sub-waves inside wave 5.
📉 This terminal wave is likely extending toward the 1.618 extension of wave (W), converging around the 0.618–0.618 Fibonacci confluence near 0.0717–0.0704. The internal structure shows a potential (a)-(b)-(c) decline, with wave (b) possibly forming a brief sideways correction before the last impulsive drop in wave (c).
💡 Key observations:
- Price has already broken below the wave 4 low and is respecting the lower channel boundary.
- A deeper extension could test the 0.07003–0.0717 demand zone, which aligns with the 0.618 retracement of the entire prior decline from the February highs.
🎯 Once wave 5 completes near the projected target, exhaustion is expected and a strong multi-wave recovery (likely wave (1) or (A) of a new bullish cycle) could begin, targeting initial retracement levels around 0.085–0.089.
⚠️ Monitor closely for signs of reversal divergence or bullish engulfing patterns near 0.0717. A break below 0.069 would suggest an even deeper correction is underway.
#ZBT #ZBTUSDT #Crypto #ElliottWave #BearishCorrection #SmartWedgeTrader #TradingView #WaveAnalysis #AltcoinSeason #CryptoTrading #ToTheBottom
ZBT/USDT — Wave 2 Correction Near CompletionZBT/USDT has already delivered a strong and impulsive Wave 1, confirming the start of a new bullish cycle. After such expansions, a corrective Wave 2 is expected—and that is exactly what price action is currently developing.
The correction now appears mature and close to completion, suggesting that the market is transitioning from retracement into positioning for the next major impulse.
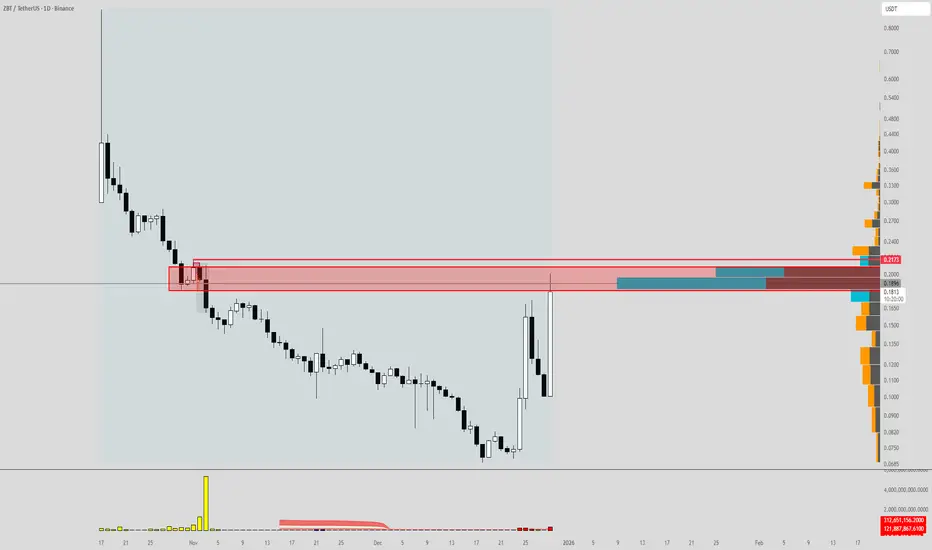
ZBT : the bears have arrived, GRR!! On the daily timeframe for ZBT/USDT, the Volume Profile reveals a prominent High Volume Node (HVN) around the 0.21–0.22 area — a zone where significant trading activity occurred and the market previously
This setup often signals distribution and potential rejection, creating a compelling short opportunity
Stop ; dailly candle close above 0.2193
BINANCE:ZBTUSDT.P BINANCE:ZBTUSDT
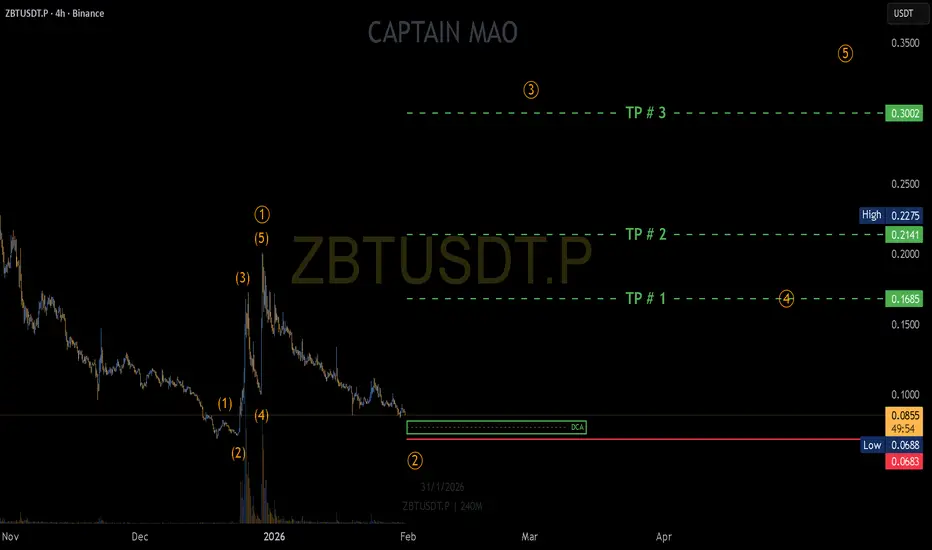
Elliot Wave 5 - ZBT🐂 LONG – ZBT
Chart structure shows a clean Elliott Wave sequence, with price currently advancing in Wave 5. Volume expansion confirms strong participation and momentum, supporting continuation rather than distribution. This setup favors a final impulsive leg higher before any meaningful correction.
🎯 TP: 0.30
🛡️ SL: 0.1372
📊 RR: 1 : 6.4
A high-quality long: Elliott Wave completion + volume breakout → strong trend continuation with asymmetric reward.
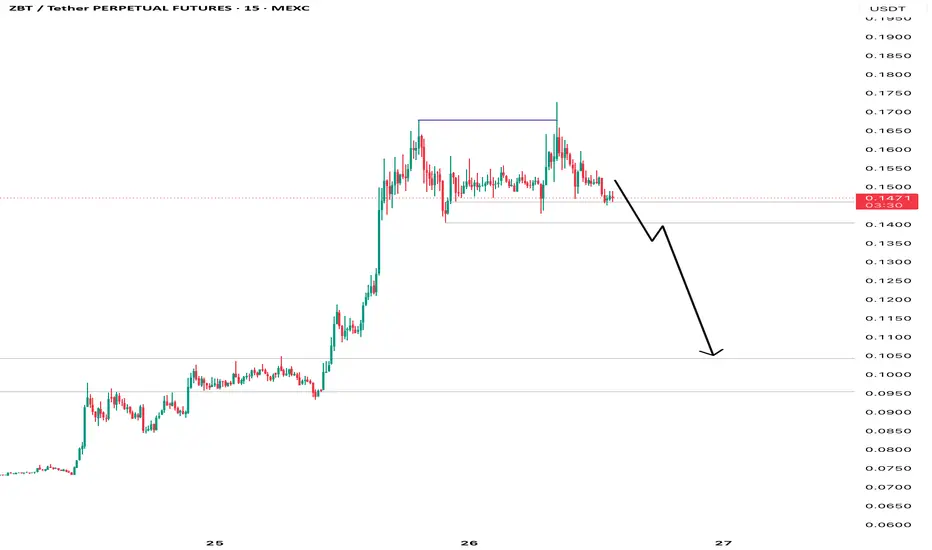
Bearish Divergence - ZBT🐻 SHORT – ZBT
A strong bearish divergence is confirmed on the 15m timeframe, while price remains overbought on both the 1H and 4H charts—most notably the 4H RSI reaching 95. This overextended rally signals momentum exhaustion. Such an unhealthy structure typically precedes distribution and a sharp sell-off. I am confident in a downside move.
🎯 TP: 0.0743
🛡️ SL: 0.1646
📊 RR: 1 : 5.35
A high-quality short setup: multi-timeframe overbought conditions + bearish divergence → elevated probability of a strong correction.
ZBTUSDT Forming Bullish MomentumZBTUSDT is forming a clear bullish momentum pattern, a classic bullish reversal signal that often indicates an upcoming breakout. The price has been consolidating within a narrowing range, suggesting that selling pressure is weakening while buyers are beginning to regain control. With consistent volume confirming accumulation at lower levels, the setup hints at a potential bullish breakout soon. The projected move could lead to an impressive gain of around 290% to 300% once the price breaks above the wedge resistance.
This falling wedge pattern is typically seen at the end of downtrends or corrective phases, and it represents a potential shift in market sentiment from bearish to bullish. Traders closely watching ZBTUSDT are noting the strengthening momentum as it nears a breakout zone. The good trading volume adds confidence to this pattern, showing that market participants are positioning early in anticipation of a reversal.
Investors’ growing interest in ZBTUSDT reflects rising confidence in the project’s long-term fundamentals and current technical strength. If the breakout confirms with sustained volume, this could mark the start of a fresh bullish leg. Traders might find this a valuable setup for medium-term gains, especially as the wedge pattern completes and buying momentum accelerates.
✅ Show your support by hitting the like button and
✅ Leaving a comment below! (What is your opinion about this Coin?)
Your feedback and engagement keep me inspired to share more insightful market analysis with you!
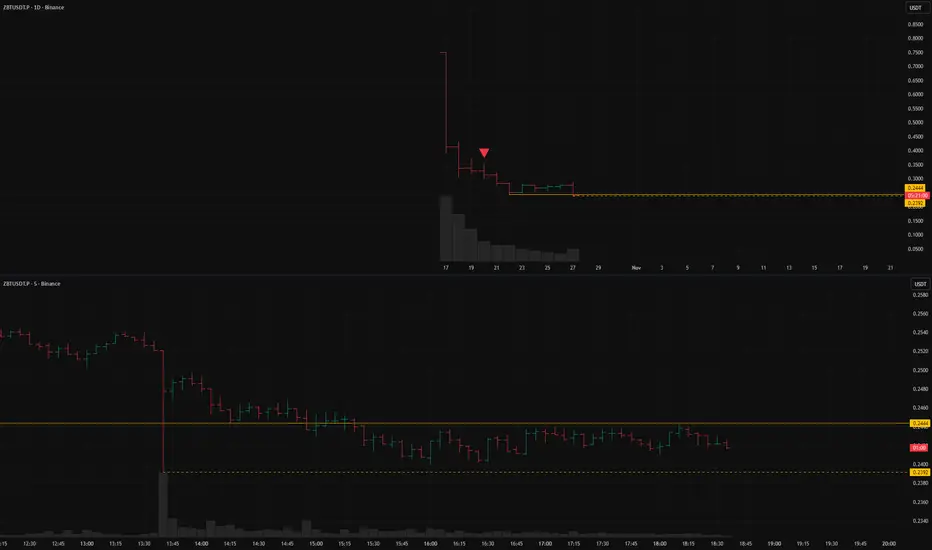
ZBTUSDT.P: short setup from daily support at 0.2444BINANCE:ZBTUSDT.P recently broke through the only support level it had been consolidating above for five days. This indicates accumulated momentum for a further move. The lack of reaction to the breakout also supports a short-side scenario.
I’m watching to ensure volatility doesn’t spike during a potential retest of the level — if it remains stable, the setup could turn into a strong short opportunity.
Key factors for this scenario:
Global & local trend alignment
Price void / low liquidity zone beyond level
Asset decoupled from the market (relative strength/weakness vs. BTC)
Volatility contraction on approach
Immediate retest
Prolonged consolidation
No reaction after a false break
Was this analysis helpful? Leave your thoughts in the comments and follow to see more.