ZEC – Bulls Defending the Trend?ZEC remains overall bullish, trading within the rising wedge pattern marked in blue.
After rejecting the upper boundary, price is now correcting and approaching the lower bound of the pattern, which has been acting as dynamic support.
The key level to watch is the major low highlighted in red. As long as ZEC holds above this invalidation zone, the bullish structure remains intact, and we will be looking for trend-following long setups from the lower blue trendline.
A clear break below the red zone would invalidate this bullish scenario and force us to reassess.
📌 Bullish trend, but location and confirmation remain key.
⚠️ Disclaimer: This analysis is for educational purposes only and does not constitute financial advice. Always manage your risk and wait for proper confirmation before entering a trade.
📚 Stick to your trading plan regarding entries, risk, and management.
Good luck! 🍀
All Strategies Are Good; If Managed Properly!
~Richard Nasr
ZEC5xShort/Tether
No trades
No trades
In-depth trading ideas
ZEC – Bullish Trend, Better Entry Ahead?ZEC has been overall bullish, trading within the rising blue channel and maintaining a clear sequence of higher highs and higher lows.
Price is currently extended from the lower boundary of the channel, so instead of chasing the move, we will be watching for a correction.
As ZEC approaches the intersection of the lower blue trendline and the green demand zone, we will be looking for trend-following buy setups.
As long as this intersection holds, the broader bullish structure remains intact and another impulse movement could follow.
📌 The trend is bullish. The key is waiting for the right location.
⚠️ Disclaimer: This analysis is for educational purposes only and does not constitute financial advice. Always manage your risk and wait for proper confirmation before entering a trade.
📚 Stick to your trading plan regarding entries, risk, and management.
Good luck! 🍀
All Strategies Are Good; If Managed Properly!
~Richard Nasr
ZEC rocket unstoppable?Every time I wait for this miracle to finally start dropping, but it just never does — and after digging into the chart, I finally understood why:
Despite rising more than 300% in just a couple of months, there's still more liquidity above than below. Nobody's buying CRYPTOCAP:ZEC — everyone's shorting it and waiting for the crash. That's exactly why it never comes, endlessly moving up on short liquidations.
For context, the nearest, even slightest cluster of buy-side liquidity sits in the $1,000 zone and below. And between the current price and that zone, there's a huge FVG that nobody wants to trade.
CVD also confirms the short liquidation narrative, showing massive sell volumes and their complete absorption by buyers.
However, CMF is already showing divergence with price — as price rises, liquidity is leaving, meaning positions are closing faster than new ones are opening.
All that's left is to wait for the crowd to finally get disillusioned and flip from shorts to longs, creating at least minor liquidity in the $1,400 zone and below. That's when we can expect the start of a correction across the entire FVG down to the order block at $1,150 — and that, by the way, is the first zone where I'll consider longing ZEC again, if by then everyone hasn't already figured out that it's a useless token
$ZEC | THE ZEC TOP MAY BE CLOSER THAN MOST EXPECTCRYPTOCAP:ZEC | THE ZEC TOP MAY BE CLOSER THAN MOST EXPECT | MY FULL MARKET VIEW
Family, I want to share my personal technical view on #ZEC because the chart is becoming extremely interesting but so is the risk.
ZEC has already delivered an extraordinary ~10,510% move over the last 27 months. Those who accumulated during 2024–2025 have witnessed an exceptional repricing.
But at the current $1,650–$2,100 region, I would personally become extremely cautious.
The key question is no longer simply: “How high can ZEC go?”
It is: “Is the upside still worth the risk at these levels?”
My chart shows a major Cup & Handle structure with a measured projection of roughly 209%, placing the projected objective around the $1,800–$2,100 region.
That makes $1,800-$2,000 a critical POI for me.
This is the zone where I would closely monitor:
→ Distribution
→ Profit-taking
→ Increasing sell-side pressure
→ Rejection from psychological resistance
I am NOT suggesting entering ZEC at current levels.
After such an explosive rally, the risk/reward profile can change dramatically. Personally, I don't try to predict the exact top, markets rarely give you that luxury.
But if you ask me where the current rally could potentially become exhausted, my estimated zone is:
TOP WATCH ZONE: $1,800–$2,100
There is also upcoming ZEC-related news, which could potentially trigger another wave of speculative buying before the event.
Classic market behaviour: BUY THE RUMOUR → SELL THE NEWS.
Now let's look beyond the current cycle.
From a multi-year perspective, if ZEC eventually enters a major distribution and prolonged downtrend, I would not be surprised to see the price revisit sub-$500 levels over the next 1–3 years.
If the long-term market structure completely reverses, sub-$200 cannot be ignored as a theoretical downside scenario.
LONG-TERM BEARISH WATCH: $650 → $500 → $200
CURRENT-CYCLE TOP WATCH: $1,800 → $2,100
These are NOT predictions or guaranteed targets.
They are simply the levels I am watching based on technical structure, market psychology and historical price behaviour.
The goal is not to be blindly bullish or bearish.
The goal is to understand BOTH sides of the trade, upside opportunity AND downside risk.
Manage your positions accordingly.
NFA. DYOR.
ZECUSDT Analyses-49, September 25, 2026
Welcome to my page! I share daily technical analyses of crypto and other charts here.
BINANCE:ZECUSDT
🔍 Market Structure Analysis:
ZEC remains bullish on the 1H chart, with higher highs and higher lows supporting the bullish structure.
🎯 Entry & Exit Signal:
Buy Entry: 1,542.85
Stop Loss: 1,479.04
Targets: 1,670.47 R/R:2 - 1,600.90 - 1,652.38
Key Support & Resistance:
Key Resistance: 1,600.90 / 1,652.38
Key Support Area: 1,526.41 / 1,468.92 / 1,435.81
⚠️Risk Management:
Maximum 1% risk per trade.
❤️Follow me for more: @EhsanZeydabadi
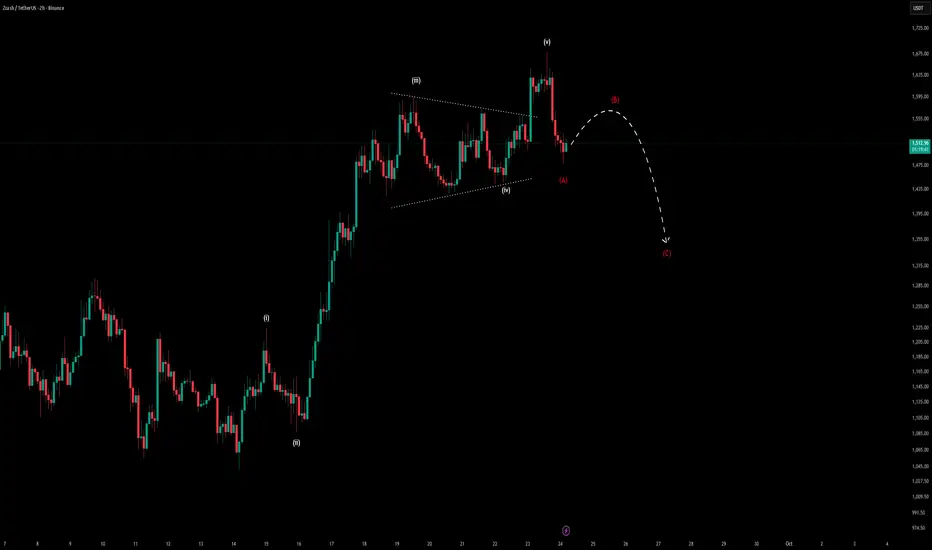
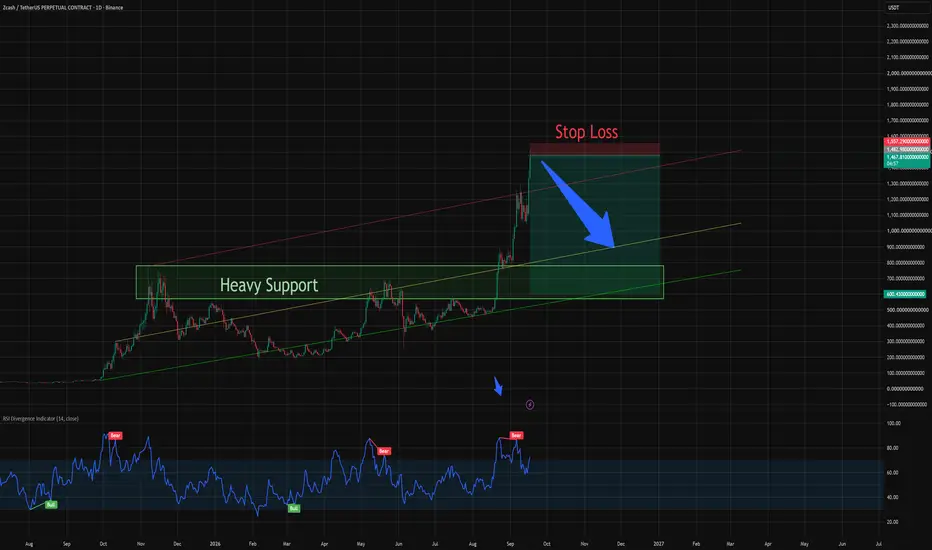
ZCASH/USDT (REVERSAL ANALYSIS)Price is currently in a bullish trend, forming a series of higher highs (HHs) and higher lows (HLs) on the price chart. However, a bearish divergence has developed on the 4H RSI, accompanied by a rising wedge reversal pattern.
A potential trend reversal may occur if price breaks below the most recent higher-low (HL) level. A confirmed breakdown of this level would provide confirmation for the bearish setup and suggest a possible shift in market structure from bullish to bearish.
The projected take-profit (TP) is around 1048, which previously acted as a strong support level. If the bearish reversal is confirmed, price could potentially retest this support zone.
ZEC short ZEC Short
Entry: $1,480
Stop Loss: $1,554 (+5%)
Take Profit Range: $1,000–$600
TP levels:
$1,000 — +32.4% 1
$800 — +45.9% 2
$600 — +59.5% 3
ZEC right now is very high. Based on previous time it has went parabolic. It's has gone down to -30% to a peak of -60% range within a couple of months. Enjoy.
Not Financial Advice.
Zecusdt longINSTRUCTIONS TO READ AND TO FOLLOW:
Entry point: yellow
Stop loss: red
Take profit: green or blue
👉Leverage x 5-10-20 for crypto
👉Leverage x 20-50-100 for commodities, stocks, indices, and forex
👉Margin 1-5% max:
This limits your maximum loss to 5% and guarantees that you retain 95% of your portfolio in the event of a stop-loss.
🔥🔥🔥🔥🔥🔥🔥🔥🔥🔥🔥🔥🔥🔥
ALWAYS PRACTICE RISK AND MONEY MANAGEMENT:
🔥🔥🔥🔥🔥🔥🔥🔥🔥🔥🔥🔥🔥🔥
👉Invest a maximum of 5% on any trade or across all your trades.
Invest only what you can afford to lose, as no one is in control of the market.
👉I repeat: this limits your maximum loss to 5% and guarantees—or rather, allows you to retain—95% of your portfolio in the event of a stop-loss.
👉I’m sending out several signals so you can pick the ones that look convincing to you—not all of them. Taking fewer positions certainly means lower gains, but it also means fewer losses. If you follow the instructions, we’ll either win together or crash and burn together. But rest assured, we win a lot more than we lose.
🎖️🎖️🎖️🎖️🎖️🎖️🎖️🎖️🎖️🎖️🎖️🎖️🎖️🎖️🎖️🎖️🎖️
LEARNING REMAINS THE BEST SOLUTION
🎖️🎖️🎖️🎖️🎖️🎖️🎖️🎖️🎖️🎖️🎖️🎖️🎖️🎖️🎖️🎖️
👉Learning from professionals remains the best solution: it enables you to understand signals, question them, and form your own opinion, as well as plan ahead should the signal provider be absent or inactive. In short, learning to trade grants you freedom and autonomy, making you responsible for both your gains and your losses.
👉Our analyses are primarily based on:
breakouts: two trend lines (ascending and descending) and a line indicating a horizontal breakout.
chart patterns: shoulders and head, triangle parttern, elliott impulse, etc etc.
We don't always have the time to track them at all times or to represent them visibly, given the numerous signals, the number of channels to manage, and especially because of the often rapid pace of market movements.
indicators: We associate at least two indicators with this technique.
👉considering the potential market risks and the likely short-term and long-term profits, we use specific indicators, often setting 3 or more take profit levels
👉depending on your psychological state, your beliefs, your goals or intuitions, you can close the position before or after the take profit orders indicated by the green lines if you are personally satisfied; the same applies to stop loss orders
👉Indeed, there are good days in trading and also bad days. No one can promise to win every trade, and like all traders worldwide, we also experience stop-loss orders. However, we win more than we lose and remain positive.
👉We must stay positive, clear-headed, and humble.
We need to proceed step by step—without rushing, without being overly timid, and without being too greedy either.We need to pull ourselves together and regain our confidence after hitting a stop-loss.
We must stay courageous and, above all, prudent regarding market reversals that no one can control
👉we cannot provide all instructions or all trades here on this channel.
such as:
⚡Move your stoploss
⚡Put B.E (break even)
⚡Add an additional take-profit
⚡Add a trailing stop
⚡re-entering the trade at the same entry point or lower.
⚡recovery signals provided in the event of—or following—a stop-loss (SL) hit.
⚡personalized discussions, instructions, and answers.
⚡revealing our high-performance indicators and teaching you how to configure and use them.
Good luck to us all, and may God guide us. Amen.
Will $ZEC down 90% From Current POI Level?What If You Go On Vacation… And Come Back To This? 😳
Imagine You’re On Vacation For A Month. You Come Back, Open Your Portfolio, And See Your CRYPTOCAP:ZEC Bag Was Bought Around $1,670–$2,200, The High POI / Rejection Area.
Now Look At The Chart 👇
Support 1: $512
Support 2: $220
Support 3: $60
A Move From $1,670 → $220 Would Mean Roughly -87%. From $2,200 → $220, It’s About -90%.
My Honest View: I’m Not Saying ZEC WILL Dump There. These Are Structural Downside Levels I’m Watching If The Current High-POI Zone Fails.
With ZEC Currently Around $1,600, This Is Exactly Why Risk Management Matters After A Parabolic Move.
Would You Be Comfortable Holding CRYPTOCAP:ZEC If This Scenario Plays Out?
NFA & Always DYOR.
ZEC/USDT: Short Setup — Overextended Rally Threatens -75% Zcash ( CRYPTOCAP:ZEC ) has staged an parabolic expansion from its low-range bases, pushing through $1,600+ driven by derivative short squeezes and institutional product news. However, momentum indicators on higher timeframes are displaying severe bearish divergence, heavy spot profit-taking, and extreme funding rate expansion, signalling that the current buying exhaustion could lead to a steep, macro mean-reversion drop.
A high-volume breakdown below $1,420 confirms the cyclical top and opens the floor for a severe multi-month retrace toward lower macro liquidity pools.
*(Educational analysis only. Always manage your risk.)*
$ZEC | Sharing My Personal View With You All | Must ReadCRYPTOCAP:ZEC | Sharing My Personal View With You All | Must Read
Family, I want to share my honest view on CRYPTOCAP:ZEC because this is one of those charts where the upside story looks exciting, but the risk at current levels should not be ignored.
CRYPTOCAP:ZEC has already delivered an extraordinary move, around 10,283% over the last 27 months. Anyone who accumulated during 2024–2025 has already witnessed a massive return.
But at $1,600–$2,000, I personally would be extremely cautious.
The important question now is not just “How much higher can CRYPTOCAP:ZEC go?” but also “How much risk am I taking at these levels?”
As per the Cup & Handle structure visible on my chart, the measured projection is around 209%, putting the projected zone around $1,800–$2,000.
For me, this $1,800–$2,000 area is a major POI where I would closely watch for distribution and potential seller activity.
I am NOT suggesting anyone enter CRYPTOCAP:ZEC at current levels.
After such an enormous move, the risk/reward has changed significantly, and IMO the market is already showing signs of extreme extension from a psychological perspective.
TBH, I never try to predict the exact TOP.
But if you ask me where I personally think the current move could potentially exhaust, my estimated zone would be:
TOP Zone: $1,650–$2,000
There is also upcoming CRYPTOCAP:ZEC -related news, so I would not be surprised to see additional speculative buying before the event.
Classic market behaviour:
Buy The Rumour → Sell The News.
Now comes the part that most people don't want to hear.
I am looking at CRYPTOCAP:ZEC from a multi-year perspective as well.
If the current cycle eventually enters a major distribution and downtrend phase, I would not be surprised to see CRYPTOCAP:ZEC trading below $500 over the next 1–3 years.
And if the long-term structure completely reverses, even a move below $200 is possible.
My Long-Term Bearish Levels: $650 → $200
Potential Current-Cycle TOP Zone: $1,650 → $2,000
This is NOT a prediction, and I am not claiming that CRYPTOCAP:ZEC must reach these levels.
I am simply sharing my personal technical view with my community so everyone can understand both sides of the trade, the potential upside AND the potential downside.
Please manage your risk accordingly.
NFA. DYOR.
$ZEC | 4H | BUY SETUP |The crowd is busy buying high-FDV VC coins that dump on them every week.
Meanwhile, a 21M hard-capped asset with ZERO unlock cliffs is quietly setting up a massive structural pivot.
Let's talk about BINANCE:ZECUSDT — and the giant disconnect between narrative and data 📊
📉 WHAT THE MARKET SEES:
"Privacy coins are dead due to regulation."
"Zcash is a dinosaur coin in a permanent downtrend."
🔍 WHAT THE DATA ACTUALLY SHOWS:
1️⃣ The Supply Illusion
Most "new" tokens have <15% of supply circulating. They are unlock time-bombs.
CRYPTOCAP:ZEC has over 77.6% of its supply circulating (~16.3M / 21M max). There are ZERO VC unlock cliffs. No team dumping on retail. Just pure market supply.
2️⃣ The PoS Transition (ZS-PoS)
Zcash is actively moving toward Shielded Proof-of-Stake. Currently, PoW miners must dump ZEC daily to cover electricity bills.
Shifting to PoS completely eliminates this persistent miner sell pressure while introducing native staking yield, locking up circulating supply.
3️⃣ The Accumulation Structure
Despite the bearish noise, the 4h structure shows an aggressive impulsive breakout followed by a clean corrective pullback.
We are heading straight into a high-confluence Buying Order Block.
🎯 THE TRADE SETUP:
We are looking for a defensive reaction in the key demand zone.
• Entry: $1,394.57
• Buying Order Block: $1,392.96 – $1,326.92
• Stop Loss: $1,314.57 (Risk: $80.00 / 5.74%)
• Target One: $1,535.81 (R:R: 1.77x)
• Target Two: $1,794.47 (R:R: 5.00x)
Why this is asymmetric:
The crowd is positioned for a breakdown, but the order block is the ultimate invalidation line. If the $1,326.92 – $1,392.96 block holds, the path to $1,794.47 is wide open.
Bullish above $1,394.57. A close below $1,314.57 invalidates the setup.
Not Financial Advice. ALWAYS DYOR.
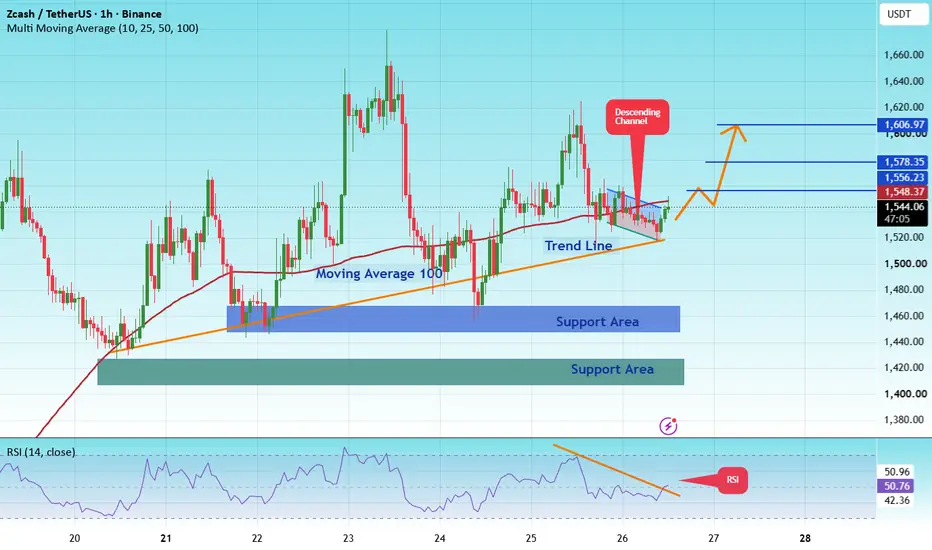
ZECUSDT Breakout Confirmed - Bullish Rally Loading!#ZEC
The price is moving within a descending channel on the 1-hour timeframe; it has reached the lower boundary and is poised for a rebound, suggesting a potential upward move upon retesting this level.
The Relative Strength Index (RSI) indicates a bearish trend, yet a bullish breakout is likely given that the price has reached "oversold" levels on the 1-hour chart.
An orange trendline supports the likelihood of a bullish rebound.
There is an initial support level at 1450, acting as a preliminary support zone.
A key support zone (marked in green) exists at 1400; the price has bounced from this area multiple times, making it a strong support level.
The price is heading toward the 100-period moving average (a level currently being approached), reinforcing the potential for an upward move.
Entry Price: 1544
Target 1: 1556
Target 2: 1578
Target 3: 1606
Stop Loss: At the green resistance zone.
Remember this simple rule: Capital management.
If you have any questions, please leave a comment.
Thank you.
Zcash (ZEC) Keeps on Rising: Bullish for Crypto (Altcoins)What will the market do now?
Will there be a crash or bullish continuation?
The chart knows the answer to these questions so, let's ask the chart.
ZECUSDT (Zcash) daily technical analysis
Notice the fibo level around $1,100. This is the 1.618 extension, the golden ratio. ZECUSDT moved to hit a new all-time high and stopped right above this level. When the retrace occurred, still happening, support was found here.
Notice how the action continues above support with a full green candle today.
Let's keep it simple, shall we?
As long as ZECUSDT trades above $1,000, we can consider this chart setup and trading pair as hyper-bullish; still moving within the price discovery phase, an uptrend, with higher always possible and expected. Only if the uptrend is compromised do we doubt or change, no other way. Since Zcash continues rising, we continue bullish.
There is always one or another project moving first, ahead of the pack. We saw this with Hyperliquid recently and now Zcash is going beyond all expectations. What one does, the rest follows.
Just as ZECUSDT can continue growing and is challenging resistance once more today; when it broke bullish, the entire market produced a very strong advance. Now that Zcash continues to move higher pushing prices up, we know that Bitcoin and the rest of the altcoins are good for additional growth.
Thanks a lot for your continued support.
Namaste.
ZCash is headed to $1750-$2000 within 36 hrs This thing simply has too much momentum and ignoring every piece of bad news and disregarding all trends and associations with the overall market. I’ve been on this since Below $1000. This thing is actually a replacement for Fiat you got privacy a.k.a. cash, Debit cards and bank accounts a.k.a. Wallet and public transactions, it has the volume and liquidity and Interest required to actually make a run bitcoin. I think this thing is almost guaranteed to make it near $2000 and quite honestly I see it Topping out at 0.05 to 0.10 BTC With bitcoin rising to 100 to $200,000. If we get a true alt cycle it’s really not that unreasonable to see A narrative that it will replace bitcoin come along and then subsequently see massive in flows Because if this thing even had a 10% chance of the bitcoin, Well that makes it 0.10BTC=1ZEC
ZECUSDT: Liquidity Sweep & Split Entry Plan Targeting $1,620ZEC has cooled off after its run to $1,640, and price is currently resting around $1,440. Liquidity heatmaps and order book data show clear levels where big orders are sitting, so I am building a staggered long setup to trade the next push up.
What I am seeing and why:
Right now, there is a strong bid wall sitting around $1,410, which can support current prices. However, there is also a deeper pool of stop losses and liquidity lower down, around $1,330 to $1,350. Market makers often push price down into these zones to collect liquidity before starting a clean move up.
Overhead, a massive cluster of short liquidations is stacked between $1,600 and $1,645. This zone acts like a magnet once buyers regain control.
How we are executing this:
Instead of jumping in with one single entry, I am splitting my position into two parts to handle potential volatility:
1. Initial Entry (~$1,443): Keeps us in the trade in case price respects the local bid wall and moves higher without a deep dip.
2. DCA Entry (~$1,330): Placed inside the lower liquidity pool to catch an aggressive sweep, which lowers our average entry price if sellers push further.
3. Stop Loss ($1,236.77): Placed safely below the $1,250 macro support floor. If price breaks below $1,250 on a daily close, the structure is broken and the trade is invalidated.
Trade Execution Levels:
Initial Entry: $1,443.82
DCA Entry: $1,330.00
Stop Loss: $1,236.77
Take Profit 1: $1,480.00 (Derisking zone at local ask wall)
Take Profit 2: $1,520.00 (Mid-range resistance)
Full Take Profit: $1,620.00 (Overhead liquidation peak)
Manage your position size carefully and let the plan play out!
ZEC is truly super bullish! (12H)ZEC appears to be forming a large-scale ABC pattern. Wave B now seems to have completed, and price has entered Wave C. The wave degree is Super Cycle, meaning this is a very large structure that is expected to develop over an extended period of time.
Wave C appears to be unfolding as either a Diametric, Symmetrical, or Double Combination pattern. The first section of Wave C could be a Symmetrical or Diametric structure, as the overall Wave C is expected to take considerable time to develop and is unlikely to complete in the near term.
We are looking for potential buy/long opportunities around the green zone. However, keep in mind that this is a very high-timeframe setup, so precise risk management and patience are essential. The structure may require a significant amount of time to fully develop.
A daily candle close below the invalidation level would invalidate this analysis and the bullish scenario.
If you have a symbol you want analyzed, first hit the like button and then comment its name so I can review it for you.
Do you also think ZEC is bullish?
ZECusdt Neckline Breakout Opens the Path Toward $2,500ZEC has completed a major Cup & Handle formation, with price decisively breaking above the neckline and confirming the bullish structure.
The sequence now becomes important: neckline breakout → retest/hold of immediate demand → continuation → $1,568 immediate target → $2,501 projected target.
As long as the breakout structure remains intact, the chart favors continued expansion rather than another return into the broader HTF demand range.
Breakout confirmed. Now we watch how the market delivers the continuation.
Probability over prediction.
WESLAD Research