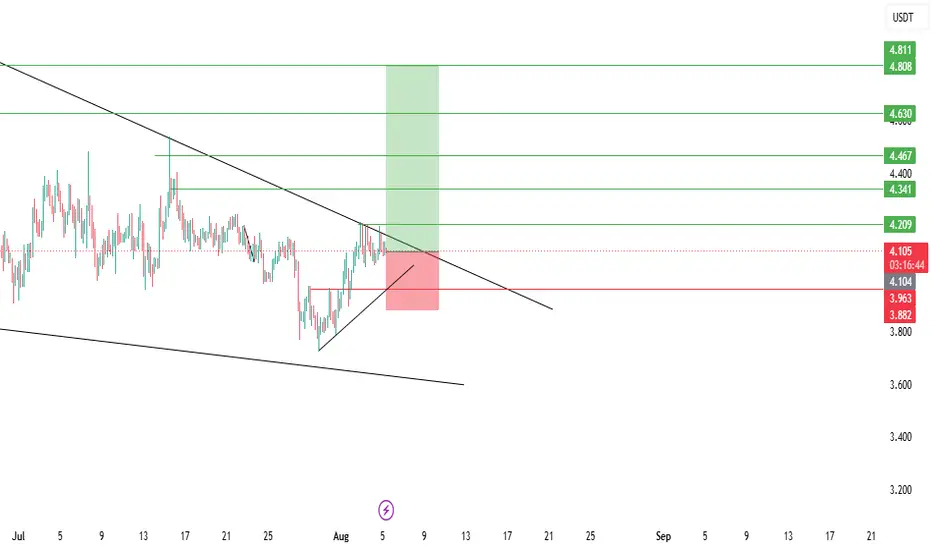
ZEN USDT LONG SIGNAL#17. ZEN/USDT – Trade Setup (LONG)
📈 Position Type: LONG
🕒 Timeframe: 1H
📊 Market: Futures
💰 Entry Zone:
4.110
3.963
🛑 Stop-Loss:
3.880
🎯 Take-Profit Targets:
• TP1: 4.209
• TP2: 4.340
• TP3: 4.467
• TP4. 4.630
Tp5. 4.800
⚙️ Leverage:
5*3
▫️ After TP1, move SL to Entry + 0.2%.
▪️ Exit Plan:
• 40% at TP1
• 20% at TP2
• 20% at TP3
20% at TP4
📌 Risk Management:
Risk only 1–2% of your capital per trade.
⚠️ Always check and confirm the setup on your chart before entering the trade.
In-depth trading ideas
ZEN at macro floor: base recovery toward $5.005The Macro Picture 🗺️
ZEN slid the whole way from the $7.50 top down toward the $3.828 macro floor and has flattened into a base just above it at $4.165. The months of lower lows have given way to a tight sideways grind — exhaustion rather than continuation.
The Setup ⚙️
The Accumulation Zone 🟢
$3.828–3.922 is where the selling has dried up. Macro Support has held on retest, with the $3.922 Local Low as the nearer shelf — this is the demand base a recovery would build from.
The Decision Point 🔴
$6.998 (Local High) is the structural gate. Before it, the $5.005 measured-move target is the first objective — reclaiming it proves buyers are stepping back in.
The Roadmap 🛣️
Hold the $3.828 floor → recover toward $5.005 → then challenge $6.998. Invalidation is a clean daily close below $3.828 — that voids the accumulation thesis.
This is a textbook DCA Accumulation Zone setup: scale in across the $3.828–3.922 band and let the base do the work.
More setups in profile.
#ZEN #Horizen #crypto #trading #TA #3Commas #DCA
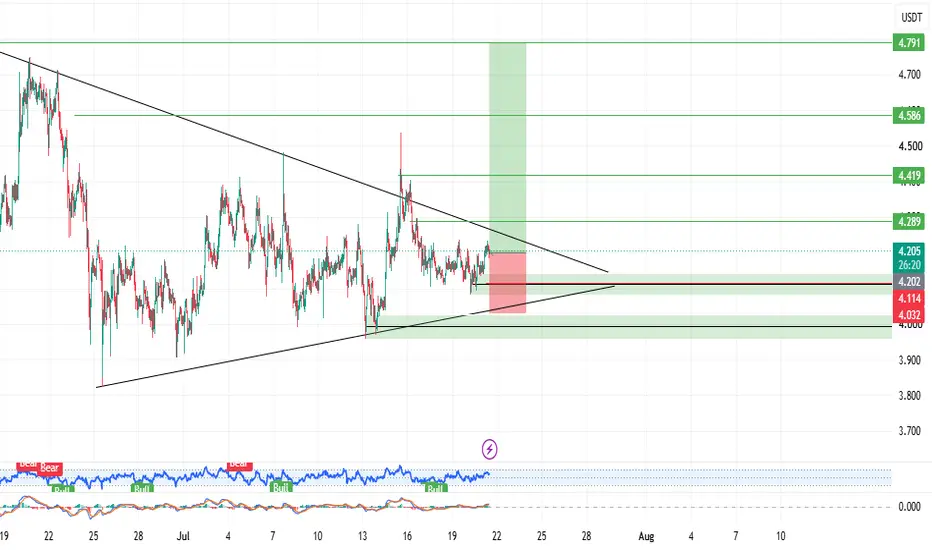
ZEN USDT LONG SIGNAL#101 ZEN/USDT – Trade Setup (LONG)
📈 Position Type: LONG
🕒 Timeframe: 1H
📊 Market: Futures
💰 Entry Zone:
Market..4.202
4.113
🛑 Stop-Loss:
4.030
🎯 Take-Profit Targets:
• TP1: 4.289
• TP2: 4.419
• TP3: 4.586
• TP4: 4.790
⚙️ Leverage:
5 *10
▫️ After TP1, move SL to Entry + 0.2%.
▪️ Exit Plan:
• 40% at TP1
• 20% at TP2
• 20% at TP3
20% at. TP4
📌 Risk Management:
Risk only 1–2% of your capital per trade.
⚠️ Always check and confirm the setup on your chart before entering the trade.
#ZEN/USDT Long plan#ZEN
The price is moving within a descending channel on the 1-hour timeframe and has reached the lower boundary. It is now poised for a bounce and is expected to retest this boundary.
The Relative Strength Index (RSI) indicates a downward trend, which is likely to continue given the overbought conditions.
There is a key support zone in green at 3.95, and the price has bounced off this zone several times, making it a strong support level.
The price is trending towards the 100-period moving average, which we are approaching. This trend supports an upward move.
Entry Price: 4.20
Target 1: 4.25
Target 2: 4.30
Target 3: 4.36
Stop Loss: At the resistance zone in green
Remember this simple rule: Money management.
Any questions, please leave a comment.
Thank you.
longInstructions:
Entry point: yellow
Stop loss: red
Take profit: green
👉Leverage x 5-10-20 for crypto
👉Leverage x 20-50-100 for commodities, stocks, indices, and forex
👉Margin 1-5% max.
Always practice risk and money management.
Invest a maximum of 5% on any trade or across all your trades.
Invest only what you can afford to lose, as no one is in control of the market.
👉Our analyses are primarily based on:
breakouts: two trend lines (ascending and descending) and a line indicating a horizontal breakout.
chart patterns: shoulders and head, triangle parttern, elliott impulse, etc etc.
We don't always have the time to track them at all times or to represent them visibly, given the numerous signals, the number of channels to manage, and especially because of the often rapid pace of market movements.
indicators: We associate at least two indicators with this technique.
👉Depending on the circumstances, we use specific indicators, often setting 3 or more take profit levels.
👉Indeed, there are good days in trading and also bad days. No one can promise to win every trade, and like all traders worldwide, we also experience stop-loss orders. However, we win more than we lose and remain positive.
👉You can close the position before or after the take profit orders indicated by the green lines if you are personally satisfied; the same applies to stop loss orders.
👉We must stay positive, clear-headed, and humble.
we cannot provide all instructions or all trades here on this channel.
Good luck to us all, and may God guide us. Amen.
Zenusdt shortInstructions:
Entry point: yellow
Stop loss: red
Take profit: green
👉Leverage x 5-10-20 for crypto
👉Leverage x 20-50-100 for commodities, stocks, indices, and forex
👉Margin 1-5% max.
Always practice risk and money management.
Invest a maximum of 5% on any trade or across all your trades.
Invest only what you can afford to lose, as no one is in control of the market.
👉Our analyses are primarily based on:
breakouts: two trend lines (ascending and descending) and a line indicating a horizontal breakout.
chart patterns: shoulders and head, triangle parttern, elliott impulse, etc etc.
We don't always have the time to track them at all times or to represent them visibly, given the numerous signals, the number of channels to manage, and especially because of the often rapid pace of market movements.
indicators: We associate at least two indicators with this technique.
👉Depending on the circumstances, we use specific indicators, often setting 3 or more take profit levels.
👉Indeed, there are good days in trading and also bad days. No one can promise to win every trade, and like all traders worldwide, we also experience stop-loss orders. However, we win more than we lose and remain positive.
👉You can close the position before or after the take profit orders indicated by the green lines if you are personally satisfied; the same applies to stop loss orders.
👉We must stay positive, clear-headed, and humble.
we cannot provide all instructions or all trades here on this channel.
Good luck to us all, and may God guide us. Amen.
ZEN/USDT — Major Reversal Opportunity or Final Breakdown?On the 1-Week (1W) timeframe, ZEN/USDT has once again entered a major historical demand zone between $4.40 and $3.40 (yellow block) 🟨.
This area has acted as a significant reversal zone multiple times since 2019 and is now being tested again after a prolonged downtrend from the 2021 bull market peak.
From a market structure perspective, ZEN remains in a long-term downtrend 📉, characterized by a sequence of Lower Highs (LH) and Lower Lows (LL).
However, the most interesting aspect is that price is currently trading within a multi-year support zone that could attract institutional accumulation if it continues to hold 💰.
---
🟨 Key Levels (Major Demand Zone)
🟡 Primary Support:
💎 $4.40 – $3.40
This zone represents a historical demand area that has repeatedly absorbed selling pressure over several years.
✅ Multi-Year Support
✅ Potential Accumulation Zone
✅ Strong Historical Reaction Area
The more frequently this zone is tested without a significant breakdown, the greater the probability of a long-term accumulation phase developing.
---
🔴 Major Resistance Levels
🔸 $5.80 → Initial Resistance
🔸 $7.10 → Intermediate Resistance
🔸 $11.70 → Major Resistance
🔸 $15.70 → Primary Upside Target and Strong Supply Zone
---
📐 Pattern Structure
🔄 Long-Term Base Formation (Potential Accumulation)
The weekly chart shows price repeatedly revisiting the same support area over multiple years.
Key Characteristics:
✅ Selling pressure is gradually weakening
✅ Volatility has decreased compared to the previous distribution phase
✅ Price is trading at relatively undervalued levels compared to previous market cycles
✅ Historical support remains intact
✅ Potential long-term accumulation structure is developing
This type of pattern often serves as the foundation for a major impulsive move during the next market cycle 🚀.
However, bullish confirmation will only be established once price successfully breaks above key resistance levels.
---
🐂 Bullish Scenario
🎯 Primary Bullish Outlook
If the $4.40 – $3.40 demand zone continues to hold as support:
1️⃣ Price could establish a Higher Low within the demand area.
2️⃣ A breakout above $5.80 would signal the beginning of a momentum shift.
3️⃣ Potential upside targets include:
🎯 $7.10
🎯 $11.70
🎯 $15.70
If the broader cryptocurrency market remains supportive 🌐, a recovery from this demand zone toward the major resistance levels could offer substantial upside potential.
✅ Strongest Bullish Confirmation
✔ Weekly close above $5.80
✔ Increasing volume during breakout
✔ Successful reclaim and hold above $7.10 as new support
✔ Formation of a Higher High market structure
---
🐻 Bearish Scenario
The primary risk remains a failure to defend this historical demand zone.
If price experiences:
❌ A weekly close below $3.40
❌ A high-volume breakdown
❌ Failure to reclaim $4.40
❌ Continued formation of Lower Highs
Then the multi-year support structure would be invalidated, opening the door for further downside continuation 📉.
Since $3.40 represents a critical historical support level, losing this area could trigger panic selling and extend the long-term bearish trend that has been in place since 2021.
---
🎯 Conclusion
ZEN/USDT is currently trading at one of the most critical price zones in its history 🔍.
The $4.40 – $3.40 range represents a major multi-year demand zone 🟨 that could become the starting point of a long-term reversal if buyers successfully defend it.
As long as this support remains intact, the possibility of accumulation and recovery toward:
🚀 $5.80
🚀 $7.10
🚀 $11.70
🚀 $15.70
remains firmly on the table.
However, traders and investors should remain cautious ⚠️, as a breakdown below this zone would invalidate the bullish outlook and reinforce the long-term bearish structure.
---
⚠️ Disclaimer
This analysis is for educational purposes only and should not be considered financial advice.
📚 Always conduct your own research.
🛡️ Practice proper risk management.
📊 Never rely solely on a single analysis when making investment decisions.
#ZENUSDT #ZEN #Horizen #Crypto #Cryptocurrency #TechnicalAnalysis #TradingView #PriceAction #SupportAndResistance #Accumulation #DemandZone #Altcoin #BullishScenario #BearishScenario #WeeklyChart #CryptoTrading #MarketStructure #LongTermInvestment #AltcoinSeason #ChartAnalysis
Zecusdt longInstructions:
Entry point: yellow
Stop loss: red
Take profit: green
👉Leverage x 5-10-20 for crypto
👉Leverage x 20-50-100 for commodities, stocks, indices, and forex
👉Margin 1-5% max.
Always practice risk and money management.
Invest a maximum of 5% on any trade or across all your trades.
Invest only what you can afford to lose, as no one is in control of the market.
👉Our analyses are primarily based on:
breakouts: two trend lines (ascending and descending) and a line indicating a horizontal breakout.
chart patterns: shoulders and head, triangle parttern, elliott impulse, etc etc.
We don't always have the time to track them at all times or to represent them visibly, given the numerous signals, the number of channels to manage, and especially because of the often rapid pace of market movements.
indicators: We associate at least two indicators with this technique.
👉Depending on the circumstances, we use specific indicators, often setting 3 or more take profit levels.
👉Indeed, there are good days in trading and also bad days. No one can promise to win every trade, and like all traders worldwide, we also experience stop-loss orders. However, we win more than we lose and remain positive.
👉You can close the position before or after the take profit orders indicated by the green lines if you are personally satisfied; the same applies to stop loss orders.
👉We must stay positive, clear-headed, and humble.
we cannot provide all instructions or all trades here on this channel.
Good luck to us all, and may God guide us. Amen.
zenusdt shortInstructions:
Entry point: yellow
Stop loss: red
Take profit: green
👉Leverage x 5-10-20 for crypto
👉Leverage x 20-50-100 for commodities, stocks, indices, and forex
👉Margin 1-5% max.
Always practice risk and money management.
Invest a maximum of 5% on any trade or across all your trades.
Invest only what you can afford to lose, as no one is in control of the market.
👉Our analyses are primarily based on:
breakouts: two trend lines (ascending and descending) and a line indicating a horizontal breakout.
chart patterns: shoulders and head, triangle parttern, elliott impulse, etc etc.
We don't always have the time to track them at all times or to represent them visibly, given the numerous signals, the number of channels to manage, and especially because of the often rapid pace of market movements.
indicators: We associate at least two indicators with this technique.
👉Depending on the circumstances, we use specific indicators, often setting 3 or more take profit levels.
👉Indeed, there are good days in trading and also bad days. No one can promise to win every trade, and like all traders worldwide, we also experience stop-loss orders. However, we win more than we lose and remain positive.
👉You can close the position before or after the take profit orders indicated by the green lines if you are personally satisfied; the same applies to stop loss orders.
👉We must stay positive, clear-headed, and humble.
we cannot provide all instructions or all trades here on this channel.
Good luck to us all, and may God guide us. Amen.
zenusdt Roddy01-SIGNALSPROVIDERInstructions:
Entry point: yellow
Stop loss: red
Take profit: green
👉Leverage x 5-10-20 for crypto
👉Leverage x 20-50-100 for commodities, stocks, indices, and forex
👉Margin 1-5% max.
Always practice risk and money management.
Invest a maximum of 5% on any trade or across all your trades.
Invest only what you can afford to lose, as no one is in control of the market.
👉Our analyses are primarily based on:
breakouts: two trend lines (ascending and descending) and a line indicating a horizontal breakout.
chart patterns: shoulders and head, triangle parttern, elliott impulse, etc etc.
We don't always have the time to track them at all times or to represent them visibly, given the numerous signals, the number of channels to manage, and especially because of the often rapid pace of market movements.
indicators: We associate at least two indicators with this technique.
👉Depending on the circumstances, we use specific indicators, often setting 3 or more take profit levels.
👉Indeed, there are good days in trading and also bad days. No one can promise to win every trade, and like all traders worldwide, we also experience stop-loss orders. However, we win more than we lose and remain positive.
👉You can close the position before or after the take profit orders indicated by the green lines if you are personally satisfied; the same applies to stop loss orders.
👉We must stay positive, clear-headed, and humble.
we cannot provide all instructions or all trades here on this channel.
Good luck to us all, and may God guide us. Amen.
zenusdt longInstructions:
Entry point: yellow
Stop loss: red
Take profit: green
👉Leverage x 5-10-20 for crypto
👉Leverage x 20-50-100 for commodities, stocks, indices, and forex
👉Margin 1-5% max.
Always practice risk and money management.
Invest a maximum of 5% on any trade or across all your trades.
Invest only what you can afford to lose, as no one is in control of the market.
👉Our analyses are primarily based on:
breakouts: two trend lines (ascending and descending) and a line indicating a horizontal breakout.
chart patterns: shoulders and head, triangle parttern, elliott impulse, etc etc.
We don't always have the time to track them at all times or to represent them visibly, given the numerous signals, the number of channels to manage, and especially because of the often rapid pace of market movements.
indicators: We associate at least two indicators with this technique.
👉Depending on the circumstances, we use specific indicators, often setting 3 or more take profit levels.
👉Indeed, there are good days in trading and also bad days. No one can promise to win every trade, and like all traders worldwide, we also experience stop-loss orders. However, we win more than we lose and remain positive.
👉You can close the position before or after the take profit orders indicated by the green lines if you are personally satisfied; the same applies to stop loss orders.
👉We must stay positive, clear-headed, and humble.
we cannot provide all instructions or all trades here on this channel.
Good luck to us all, and may God guide us. Amen.
ZEN/USDT — Descending Channel: Reversal or Rejection?ZEN/USDT on the 2D timeframe is currently still moving within a Descending Channel pattern that has been forming since the November 2025 peak area. This structure indicates that the market is still in a major correction phase, but price is now approaching a critical zone that could determine the next major trend direction. 📊
Price can be seen recovering from the lower channel area and is now approaching the upper resistance trendline marked in red 🔴. This area is extremely important because a breakout or rejection from this resistance will determine whether ZEN can begin a bullish reversal or continue its previous downtrend.
━━━━━━━━━━━━━━━━━━
📌 Main Pattern: Descending Channel 📉
A Descending Channel is a bearish continuation or reversal structure depending on how price reacts at the channel resistance.
✨ Pattern characteristics on this chart:
🔻 Lower Highs continue forming below the red trendline
📉 Lower Lows are still respected near the yellow support channel
📊 Price continues moving steadily within the channel range
⚠️ Price is currently testing the main resistance channel
As long as price remains inside the channel, the larger trend is still considered bearish-neutral.
However, if a breakout occurs with strong volume, a major bullish reversal could begin to develop. 🚀
━━━━━━━━━━━━━━━━━━
🟢 Bullish Scenario 🚀
Bullish confirmation would occur if:
✅ Price successfully breaks out above the descending red resistance
✅ A strong 2D candle closes above the 7.3 USDT area
✅ The breakout is followed by strong volume and a valid retest
If the breakout holds successfully, the next upside targets could be:
🎯 9.5 USDT
🎯 10.6 USDT
🎯 12.75 USDT
And if market momentum becomes very strong, ZEN could even have the potential to move toward:
🚀 17 USDT
🚀 20 USDT
These areas are important horizontal resistance zones that previously acted as strong supply areas. 📈
A breakout from a descending channel often becomes an early signal of a trend reversal from bearish to bullish. 🔥
━━━━━━━━━━━━━━━━━━
🔴 Bearish Scenario 📉
The bearish scenario remains valid if:
❌ Price fails to break the red resistance
❌ Strong rejection occurs around the 7.3 USDT area
❌ Candles return under seller pressure
If rejection happens, price could potentially decline back toward:
⚠️ 6 USDT
⚠️ 4.9 USDT support low
If the lower support channel eventually breaks down, deeper downside movement could still occur following the primary descending channel trend. 📛
As long as lower highs continue to form, the market still carries bearish continuation risk.
━━━━━━━━━━━━━━━━━━
📊 Conclusion
ZEN is currently at a major trend decision point. ⚡
The descending channel resistance is the most important area to watch over the next few candles.
📍 Breakout = major bullish reversal opportunity 🚀
📍 Rejection = continuation of bearish trend 📉
Traders should wait for breakout or rejection confirmation before making major decisions, as the current area is a high-volatility zone. 🔥
━━━━━━━━━━━━━━━━━━
#ZEN #ZENUSDT #Horizen #Crypto #Bitcoin #Altcoin #TradingView #TechnicalAnalysis #CryptoTrading #Bullish #Bearish #Breakout #DescendingChannel #SupportAndResistance #CryptoAnalysis #Altseason #Kucoin #Trader #ChartAnalysis #SmartMoney
zenusdt shortInstructions:
Entry point: yellow
Stop loss: red
Take profit: green
👉Leverage x 5-10-20 for crypto
👉Leverage x 20-50-100 for commodities, stocks, indices, and forex
👉Margin 1-5% max.
Always practice risk and money management.
Invest a maximum of 5% on any trade or across all your trades.
Invest only what you can afford to lose, as no one is in control of the market.
👉Our analyses are primarily based on:
breakouts: two trend lines (ascending and descending) and a line indicating a horizontal breakout.
chart patterns: shoulders and head, triangle parttern, elliott impulse, etc etc.
We don't always have the time to track them at all times or to represent them visibly, given the numerous signals, the number of channels to manage, and especially because of the often rapid pace of market movements.
indicators: We associate at least two indicators with this technique.
👉Depending on the circumstances, we use specific indicators, often setting 3 or more take profit levels.
👉Indeed, there are good days in trading and also bad days. No one can promise to win every trade, and like all traders worldwide, we also experience stop-loss orders. However, we win more than we lose and remain positive.
👉You can close the position before or after the take profit orders indicated by the green lines if you are personally satisfied; the same applies to stop loss orders.
👉We must stay positive, clear-headed, and humble.
we cannot provide all instructions or all trades here on this channel.
Good luck to us all, and may God guide us. Amen.
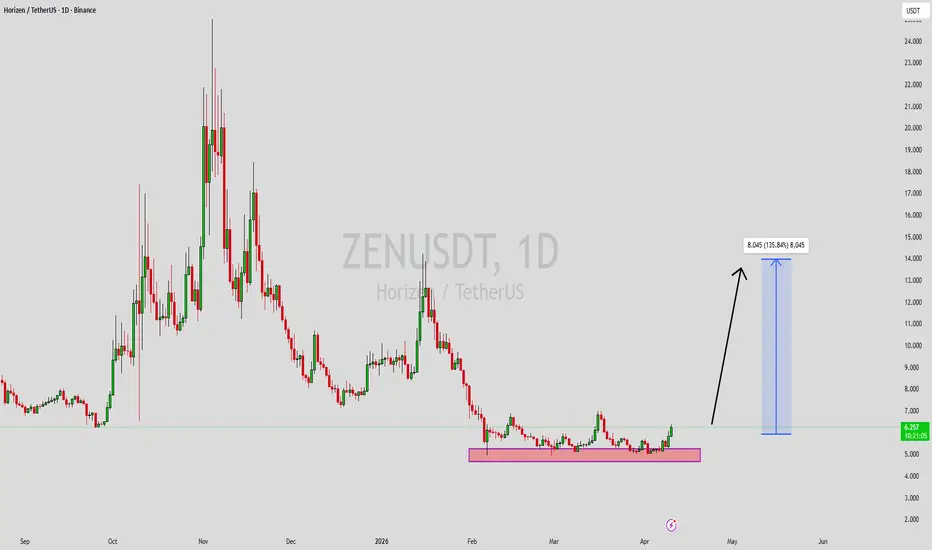
Horizen (ZENUSDT) Can Grow Long-Term (843% Profits Potential)Horizen (ZEN) has been building up above-below support for a prolonged period of time. We are talking about almost three months and there is a complete lack of bearish force. All the action is happening right below-above resistance but a little far away from support. The accumulation phase.
The trading at resistance can be considered bullish as we track Bitcoin and the rest of the market. It can be good to ask: What is happening with ZENUSDT? Will it crash while the rest of the market grows?
I don't think so, the market is one.
Horizen is set to grow like Bitcoin is doing and so many of these other projects. In fact, growth potential is huge right now and we can find many early reversal signals.
Volume goes up as the all-time low is hit.
There is a complete failure by sellers to reactivate support.
Resistance continues to be challenged over and over, making it weaker.
The MACD & RSI are trading within the bullish zone based on the daily timeframe.
The long-term chart structure looks great.
The trading is happening above the June 2023 (purple) and June 2024 (blue) lows.
The final level on the chart is green and that's right below the September 2025 low, the opportunity buy-zone.
This is a great chart setup, one that offers huge potential for growth. Long-term growth, a bull market, uptrend or rising wave, can start now. It is likely that it started with the February 2026 low, it is likely that Horizen will grow for years to come.
Namaste.
#ZEN Update Cycle Outlook 2025-2026!ZEN moved from $ 6 to $ 24 after 243 days since the last touch in 2024.
The main question now:
Will ZEN outperform this cycle or fall back into another deep coma?
🧭 Trend Structure
Based on the combined reading of FIB and Gann:
ZEN must hold 9 dollars, whatever happens.
This line is the spine of the trend.
If ZEN can close at the end of November around 19 to 21 dollars,
Then the chart unlocks the next potential wave toward:
40 to 73 dollars
This is a 3x to 5x range.
💰 Trade History and Plan
We traded ZEN at many levels, from 7.5 to 24 dollars.
The last setup was:
Entry Targets
11.05 dollars (66.7 percent)
13.00 dollars (33.3 percent)
Max investment
2% only for this cycle play
Always do your own research
Duration
90-180 days or more
Confidence
Medium
🔍 Quick Recap
• Key support to hold: 9 dollars
• November close target: 19 to 21
• Breakout potential: 40 to 73
• Allocation: two percent
• Setup invalidation: losing the 9 zone with weekly and monthly closes
• Timeframe: medium to long (three to six months)
⚓ Renzo Tip
“A quiet coin is like a quiet sea. It looks dead until one wave reminds everyone that depth always hides power.”
🤲 Prayer
May Allah bring clarity to our decisions, protect us from rushing,
and bless our patience with results that reflect discipline, not luck.
ZENUSDT 1D#ZEN is trading within a falling wedge pattern on the daily chart and has recently been rejected from the daily EMA100. Consider accumulating a small position at current levels and near the support zone, which is roughly aligned with the daily SMA50. In case of a confirmed breakout above the pattern resistance, the potential upside targets are:
🎯 $7.886
🎯 $8.795
🎯 $9.704
🎯 $10.998
🎯 $12.647
⚠️ Always use a tight stop-loss and maintain proper risk management.
ZENUSDT Forming Bullish MomentumZENUSDT is forming a clear bullish momentum pattern, a classic bullish reversal signal that often indicates an upcoming breakout. The price has been consolidating within a narrowing range, suggesting that selling pressure is weakening while buyers are beginning to regain control. With consistent volume confirming accumulation at lower levels, the setup hints at a potential bullish breakout soon. The projected move could lead to an impressive gain of around 90% to 100% once the price breaks above the wedge resistance.
This bullish momentum pattern is typically seen at the end of downtrends or corrective phases, and it represents a potential shift in market sentiment from bearish to bullish. Traders closely watching ZENUSDT are noting the strengthening momentum as it nears a breakout zone. The good trading volume adds confidence to this pattern, showing that market participants are positioning early in anticipation of a reversal.
Investors’ growing interest in ZENUSDT reflects rising confidence in the project’s long-term fundamentals and current technical strength. If the breakout confirms with sustained volume, this could mark the start of a fresh bullish leg. Traders might find this a valuable setup for medium-term gains, especially as the pattern completes and buying momentum accelerates.
✅ Show your support by hitting the like button and
✅ Leaving a comment below! (What is your opinion about this Coin?)
Your feedback and engagement keep me inspired to share more insightful market analysis with you!
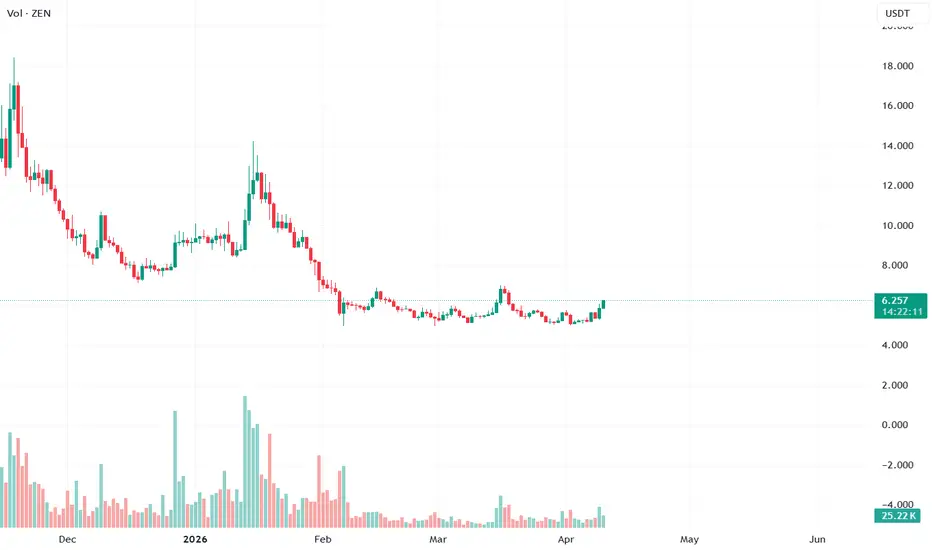
ZEN Squeeze Elevated Five Bars With OBV Inflow at Extreme FloorPrice on ZEN is sitting at 6.6 percent of all-time range — one of the deepest floor readings possible. Squeeze has been Elevated for five consecutive bars with bandwidth tightening to 21.71 percent, the compression is real and building. Retrace reads zero percent Extreme Breakout, meaning price has not pulled back from the recent move at all. The setup structure is there but the signal board has significant splits that need addressing before calling this a clean entry.
Total signals show 39 green to 16 red out of 112. EMA sits 5 to 1 with one red remaining. Candle patterns 11 to 3, Ichi TK split exactly 6 to 6 — structure not confirmed. C>T at 10 to 4 is positive but not dominant. DD/SS at 1 to 3 and Pat Tot at 3 to 2 are both leaning bearish on the pattern side. Stars split 2 to 2. The board is green-leaning but far from a sweep, which matters when entering an elevated squeeze.
All three Z-scores are subzero. Spot Z negative 0.23 Steady, Futures Z negative 0.31 Steady, combined negative 0.30 Steady. SpotZ 1:5 reads negative 0.23 to negative 0.66 then 0.44 with a rising arrow — the most recent bars are recovering from a deeper negative which explains the squeeze building. S/F ratio shows 2.23 million spot against 24.64 million futures, Futures Lean classification. Spot to Futures dollar value 13.98 million against 154.17 million — futures are doing eleven times the volume of spot.
OBV Z at 0.93 Inflow with no divergence is the strongest signal in this panel. Leverage at 11x High sitting at 23.1 percentile Floor is structurally bullish — low leverage at floor is the classic precondition for a real squeeze. AT Min at 0.92x printed 360 bars ago confirms price is near historical lows. Yield at negative 245 APY at negative 0.8 sigma Bull means funding is pricing a move up.
The honest read: ZEN has the right ingredients for a genuine squeeze breakout — five bars of elevation, OBV inflow, leverage at floor percentile, and price at 6.6 percent of range. The friction is the Futures Lean classification with all Z-scores still subzero and Ichi TK split. This needs Spot Z to cross zero and push toward 1.0 on the next two bars to confirm real buying is joining the futures setup. If that happens with the squeeze still elevated, the 25.019 range high becomes the measured target. If Z-scores stall and roll negative again, the squeeze fades without resolution.
Is That Crypto Pump Real? Data Says No. Here's Why.
Stop Losing Money to Fake Volume. Find Real Moves Now.
Trade the REAL Crypto Volume. Stop Getting Faked Out.
ZEN / USDT Attempting Breakout — Bullish Move Toward $5.769ZEN / USDT is showing positive momentum and attempting to break through a key resistance level. A confirmed breakout followed by a successful retest as support could trigger a strong bullish rally toward the $5.769 target. Keep a close watch on price action, wait for proper confirmation, and manage risk wisely before entering any trade.
ZENUSDT at Key Support - Bounce or Breakdown?Alright fam, BINANCE:ZENUSDT just took a solid hit 📉 but now it’s sitting right at a major support zone — this is where things get interesting 👀
📊 Market Structure:
After a strong uptrend, ZEN is now in a pullback phase
Price tapped into a high-probability demand/support zone
This is a classic make-or-break level
🟢 Key Support Zone: $5.87 – $5.98
👉 Previous accumulation + strong reaction zone
💰 Entry Plan: $5.95 – $6.00
⚡ Wait for bullish confirmation (don’t catch a falling knife)
🛑 Stop Loss: $5.78
❌ If this breaks, downside continuation likely
🎯 Targets:
🔥 TP1: $6.409
First resistance + liquidity grab
🚀 TP2: $6.880
Major resistance / previous high zone
📉 Indicators Insight:
Price testing key moving averages
Momentum weak short-term, but support is strong
Bounce potential high if buyers step in
⚡ Final Take:
This is a high-risk, high-reward support play.
Either we get a clean bounce from here… or breakdown continues.
👀 Watch reaction closely — this zone decides the next move.
#ZEN #CryptoSignals #Altcoins #Trading 🚀📈
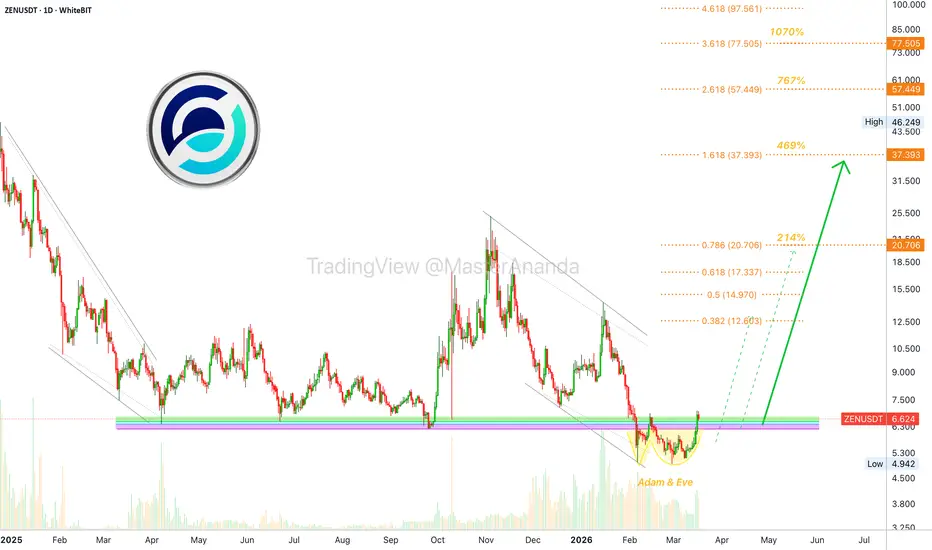
Horizen: Bottom pattern & support (214%-1070% profits potential)ZENUSDT lost all bullish momentum and ended up producing a stop-loss hunt event, three support levels were pierced. The April (blue), June (green) and September (purple) 2025 lows.
The break of support was followed by an Adam & Eve reversal pattern, and the action is now back above support. This is a complete cycle. A down-move, support lost and recovered; now, it is easy to see the start of a new market phase. One that will match what Bitcoin and the other altcoins are doing.
The targets can be seen on the chart with huge potential for growth mid- to long-term, a bullish wave lasting 3-6 months. The first target has 214% potential for profits while the third target has 767%. The last highlighted target on the chart has 1070%.
Thank you for reading.
Namaste.