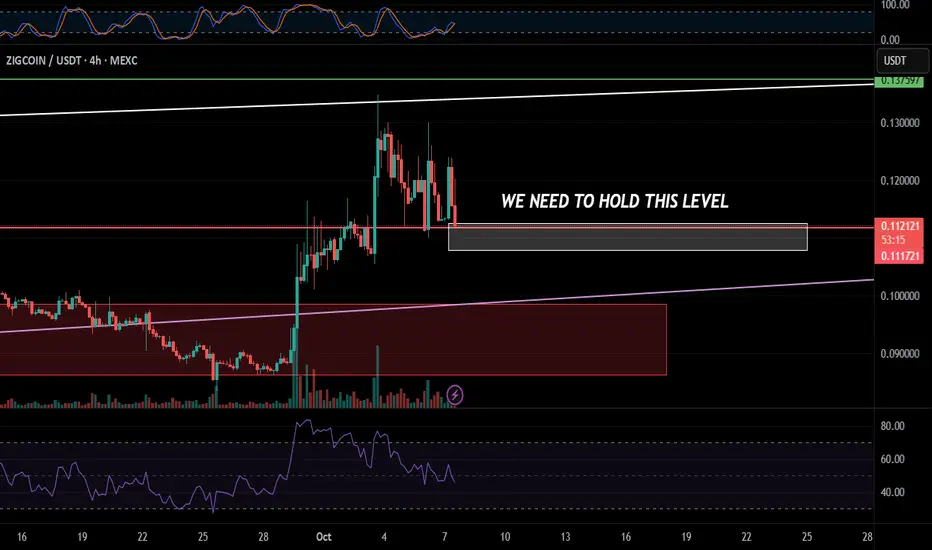
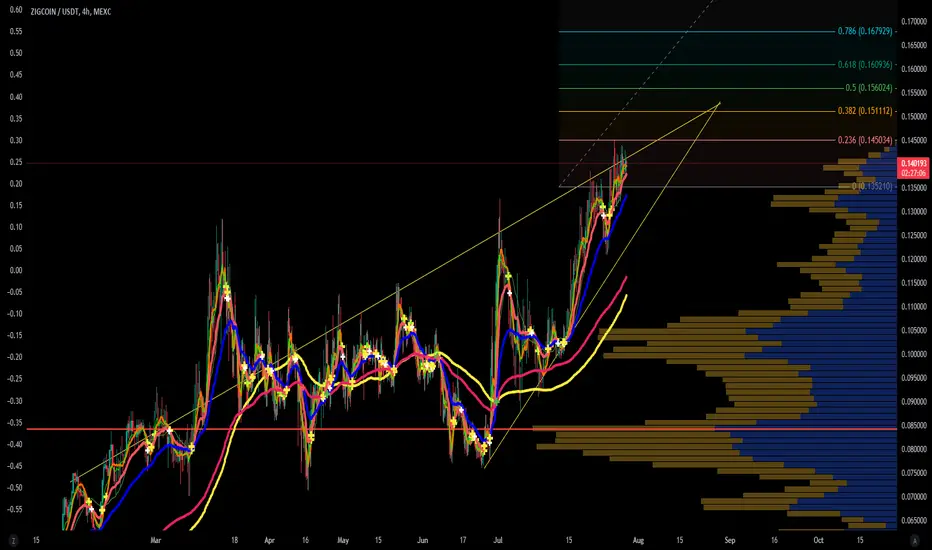
Zignally coin $ZIG Bullishness4 consecutive tries to break the resistance and forming HLs with consolidation below the range.
Notice the distance between arrows are getting narrower marking a potential breakout for the range retest.
please do not neglect your risk and money management in your tradings activities.
Good luck
In-depth trading ideas
$ZIGUSDT Currently sideways, but expecting the UPSIDESo, basically, we have broken from above of the actual and accurate downtrend.
Except that right now things are going sideways and choppy, many people will think that the dashed trend is the accurate one, but no. If you check lines, you will see that most of it is in the air, because line is more accurate than candlesticks. Enjoy the free tip.
Back to what's important I believe that right now what is actually going on is, we have broken from above of the trendline, we are going sideways becaus
ZIGUSDT heading to weekly support before bounce to highsZIGUSDT has a similar story like many others. It has hit the weekly resistance WR1 and currently pulling back from there.
It is likely to hit daily support DS1 and later weekly support WS1.
DS1 can provide some bounce but the price may visit WS1 again before bouncing well and continuing its upward journey.
I will buy spot heavy if it hits WS1 zone.
What do you think?
Zignaly: Basic Technical AnalysisIn January 2024 ZIGUSDT turns bullish and starts to move within a rising channel, higher highs and higher lows.
In March 2025 this channel's lower boundary breaks for the first time and ZIGUSDT moves lower.
This week, ZIGUSDT moves "back into the rising channel." When this happens, from a technical analysis perspective, we can expect the action to continue as before the breakdown. So we can expect a higher high next compared to early December 2024.
The break of support between March and May t
ZIG is at a critical breakout pointThe rising band that ZIG formed was broken to the downside by the descending band starting from December 5, 2024, and it has maintained its downward movement since March 3, 2025.
As we approach a decisive moment for BTC, if BTC breaks out upward, ZIG will likely break its descending band and start rising. We are very close to the decision point. Everything seems to depend on a piece of news that could push BTC upward.
If BTC breaks downward, the first support levels for ZIG would be around 0.0
$ZIG switching to an upward trend at 14th OR 15th december! Here’s the Zignaly ( AMEX:ZIG ) 8h chart. Since December 5th, we’ve been in a downtrend with occasional small legs up, but no higher highs have been formed. The KDJ indicator has given several buy and sell signals, with the second buy signal being very short-lived. Since December 5th, no higher highs have been made, which confirms the ongoing downtrend.
Here come's the fun part. Looking at the data since December 1st, all downtrends have lasted around two days which you can clearly see at the w
$ZIGUSDT: Multi-Month Trend – Aiming for $1!BYBIT:ZIGUSDT - Long Term Play
This could be one of those slow trends that builds up to a huge breakout. It's hard to time the exact move, but we're positioning in case it happens.
Plan:
Bought the monthly retest.
Stop placed on the current daily trend.
Aiming for around $0.30 in the short term, but I see this eventually reaching $1.
Hold:
Multimonth trend confirmed. Get ready for a long ride.
ZIG - Unprecedented StrengthTaking a stab at this one. AMEX:ZIG
Clear invalidation if it fails to trade above the gray block.
Since NYSE:FET has been outperforming most of the sector, some AIs should follow suit. This one, in particular, has held its ground in 2024 while many others have been struggling during this altcoin correction.
Simple plan...
Back high ZIGZIGCOIN trading within a rising channel. The price is currently rebounding from the lower trendline, indicating potential bullish momentum. If the price breaks through resistance at $0.1261, it could aim for the next target near $0.1485. A failure to maintain above $0.0865 may signal a trend reversal.
ZIG/USDT: Potential Bullish Reversal After Key Support Retest#ZIG/USDT #Analysis
Description
---------------------------------------------------------------
+ ZIG/USDT is currently testing a critical support zone around $0.115 after a strong bullish rally.
+ The 100-day EMA is acting as dynamic support, suggesting a potential bullish reversal if this level holds.
+ RSI is around 43, indicating a neutral stance with the possibility of an oversold bounce, leading to higher targets.
---------------------------------------------------------------
VectorAlgo