ZIL/USDT: +115% Macro Reversal SetupZilliqa ( GETTEX:ZIL ) is stabilizing right above its **$0.00084 – $0.00096** post-capitulation demand zone after shedding over 42% following the November 16 Upbit market support termination. With the 14-day RSI compressed deep into extreme oversold territory (~17.7) and selling volume exhausting after testing the $0.00084 low, market structure favors a high-volatility mean-reversion squeeze. A confirmed H4 candle close above the **$0.00110** reclaimed resistance pivot invalidates the post-delis
Zilliqa / TetherUS
No trades
No trades
In-depth trading ideas
#ZILUSDT Is Approaching Another Potential Bullish Move!
On the 1-hour timeframe, ZIL has been moving within a series of consecutive descending price channels. What stands out is that previous breakouts above these channels were followed by sharp and notable upward moves.
Key Support Zone: 0.001500
This level represents a major support area that has repeatedly proven its strength, with price bouncing higher whenever it approaches this zone. This reinforces its importance as a key defensive level supporting the bullish outlook.
What Can We Expect
ZIL Trapped Under a Descending Trendline — Breakout Ahead?💵 Coin: GETTEX:ZIL / USDT
⏳ Time Frame: 4D
📉 Pattern: Descending Trendline / Downtrend
🎯 Potential Target: 10%+
🔻 Descending Trendline Structure
📐 The chart shows a Descending Trendline formed from the high around $0.0377, with price continuing to form lower highs over time.
🔴 As long as price remains below the trendline, the overall bearish structure remains dominant.
📍 Price is currently around $0.00283, while the descending trendline continues to act as dynamic resistance.
⚠️ The horiz
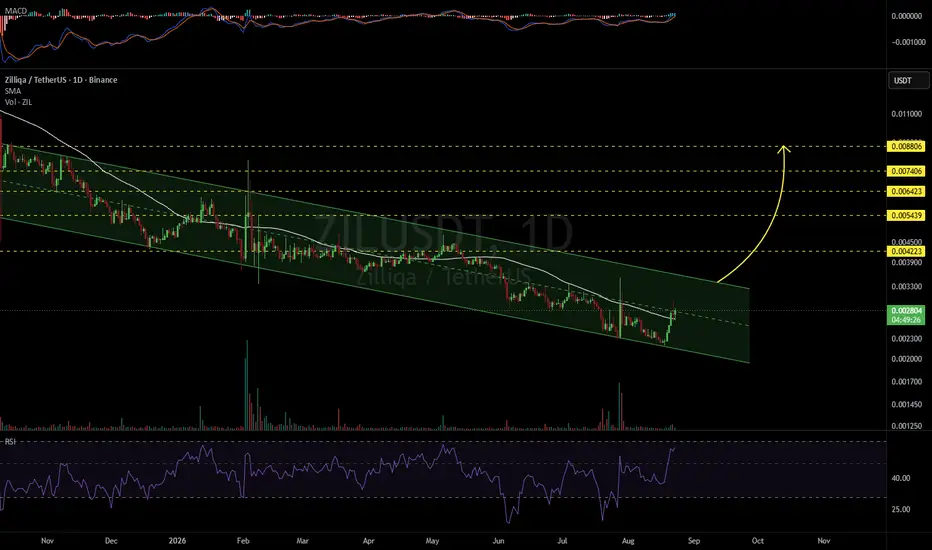
ZILUSDT 1D#ZIL is trading within a descending channel on the daily timeframe. It has broken above the 50-day SMA and successfully retested it. A confirmed breakout above the channel resistance could trigger a bullish move toward the following upside targets:
🎯 $0.004223
🎯 $0.005439
🎯 $0.006423
🎯 $0.007406
🎯 $0.008806
⚠️ Always use a tight stop-loss and apply proper risk management.
ZIL: Rejected at Dynamic MA100 BarrierZIL: Rejected at Dynamic MA100 Barrier – Triggering Optimal Short Setup at Triangle Apex
Zilliqa (ZIL) is issuing highly definitive technical signals favoring a continued downside expansion as it reaches the apex of a descending triangle pattern on the daily timeframe. The recent short-term recovery attempt toward the upper boundary was swiftly met with intense selling pressure, leaving a sharp upper rejection wick directly at the dynamic MA100 trendline resistance and retreating back inside t
ZIL/USDT – Temporary Rebound or Downtrend Continuation?Zilliqa (ZIL) is currently attempting a recovery after experiencing a sharp decline from its previous distribution area. However, from a 1D timeframe market structure perspective, the trend remains dominated by bearish pressure, with price approaching a key supply/resistance zone at 0.00365 – 0.00380 USDT 🟨 (yellow box).
This zone previously acted as a strong support level, but after the breakdown, it is now likely to serve as resistance (Support Turned Resistance). The market's reaction within
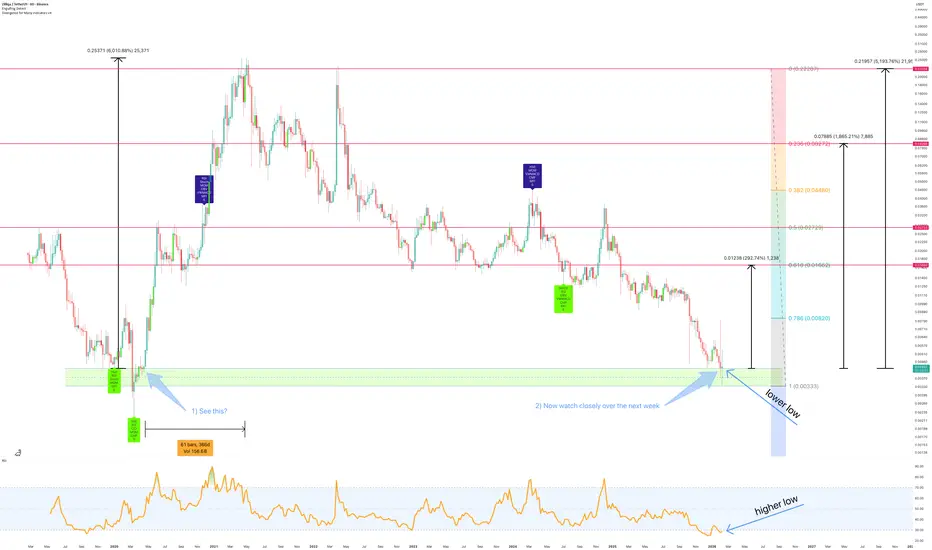
Zilliqa: Biggest Bull Market in the History of CryptocurrencyThere is something about March and April. On this month, we see the start of cycles. There are many peaks happening marketwide in March but also valleys. Many cycles end in April but sometimes the valleys also appear in April like last year.
ZILUSDT (Zilliqa) hit bottom March 2020 based on candle close. The true all-time low also happened around this date. Fast forward six long years and we get a new market bottom, March 2026.
In 2020, the week with the lowest close was 23-March. The price was
Zilliqa zoomies with 5000% move? - February 2026Do you remember all those bearish Bitcoin ideas Without Worries posted during quarter 4? The ones you din’t want to read but were difficult to ignore? And now the same "screaming from the roof tops" with a plethora of bullish alt token ideas? Is the math is mathing?
On the above 6 day chart price action has plummeted a whopping 99% as holders finally decide to make the losses real. Is now the time to join them? Let me give you a few reasons why that might not be the best idea:
1. Support and r
TRADE [6] ZIL There has been strong buying activity in the past few hours, along with the formation of a new low. ZIL looks suitable for trading during this period, particularly for short-term speculation. Increasing the risk level may be considered, as this trade is intended to be short-term, but it could also develop into a swing trade. Always remember that success begins with proper risk management.
Zilliqa ZIL price analysisAfter remaining in a structural downtrend since mid-2021, CRYPTOCAP:ZIL recorded a sharp +100% upside move over a short period.
The move was driven by expectations around a #Zilliqa network upgrade and an upcoming hard fork on Feb 05, indicating a fundamentally triggered impulse rather than random volatility.
From a scenario perspective OKX:ZILUSDT :
Bullish continuation zone: $0.0096–0.011
Key support: $0.0044
Current conditions show expanded volatility and a wide trading range, incr
The old guard is trying to surviveWe also need to talk about the veterans. Zilliqa, a name that has been around for ages, has had a rough time lately.
The chart for GETTEX:ZIL looks like it fell off a cliff recently, but it is finally finding some footing. We are seeing a bounce from the lows around $0.0064.
This is a trickier setup. Unlike the strong uptrends we see in AI coin, this is a recovery play. It is like trying to catch a falling knife, but for brave souls, these relief bounces can be profitable.
However, it is
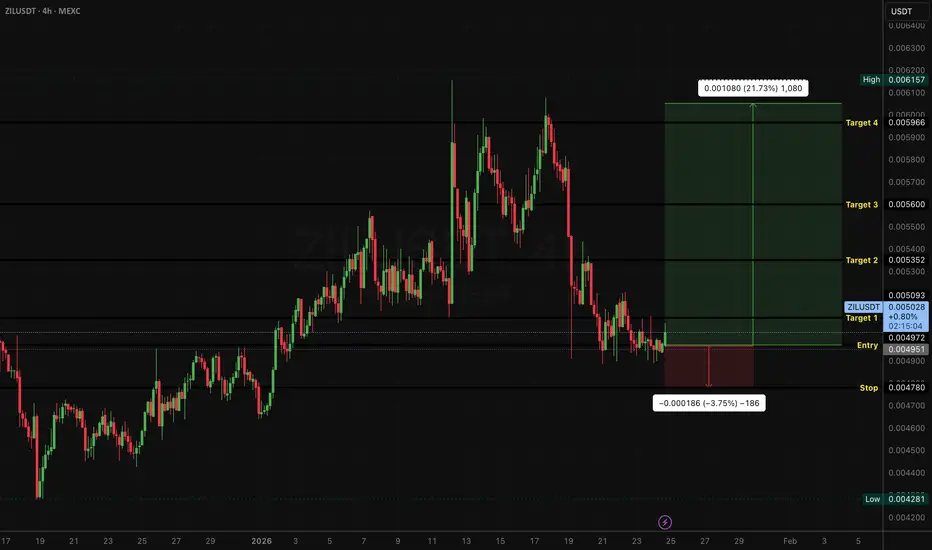
Kredbe Trade Setup | $ZILUSDTPosition Type: Long
Leverage: 2× – 5× (strict risk control)
Entries
• Primary Entry: Current market price
• DCA Entry: 0.00488
Invalidation (SL):
• 0.00477 zone (tight risk, no tolerance below)
Targets:
• Take profits at predefined liquidity levels (as marked on chart)
Trade Logic:
GETTEX:ZIL is currently trading inside the Fibonacci Golden Zone on the lower timeframe — an area where price historically reacts due to liquidity + smart money interest.
This is a reaction-based setup, not a b
ZIL BOTTOMED OUT🔥 Fortune AI Radar — GETTEX:ZIL
Fresh activity detected on GETTEX:ZIL today.
Data suggests increasing market interest & buyers stepping in.
Technicals currently lean bullish, with momentum trending upward.
Whales showing hints of accumulation and hype rising among traders.
This coin is flashing strong signals on short-term charts — worth keeping an eye on 👀
Not financial advice — always research before taking decisions
ZIL Approaching Cycle Bottom: One Breakout Can Change EverythingZIL is currently trading inside a large multi-year falling channel, with price pressing into the lower boundary of the structure. This zone has historically acted as a major cycle low for ZIL, and the current reaction aligns with the broader pattern of diminishing volatility and trend exhaustion.
Price recently tapped the lower support line of the macro channel while the RSI is showing a tightening descending structure. This combination often signals weakening bearish momentum and an upcoming
Scalp Long – ZIL💎 Scalp Long – ZIL
RSI has broken out of its downtrend, and price has broken above the triangle pattern, signaling a clear bullish shift.
Buying volume is surging, confirming strong momentum behind the move.
🎯 Plan:
→ Enter after confirmation of breakout retest.
→ TP: 0.00774 | SL: 0.00733 | RR: 1 : 2.42
Momentum supports the long setup.
Keep entries clean, trail SL as price advances.
Stay patient — act only on confirmed breakout strength.
ZIL/USDT Futures: Primed for a Bullish Breakout Explosion!🚀 ZIL/USDT Futures: Primed for a Bullish Breakout Explosion! 🚀
Traders, get hyped! 🔥 This killer setup on $ZIL/USDT Perpetual Futures is locked in on the 30-minute timeframe, where price is coiling tight against a descending trendline, building massive pressure for an upside breakout. We're on the edge of our seats waiting for that clean snap above the trendline – and when it happens (as we're betting it will), it's game on for some serious gains! 📈
📊 Setup Scoop:
Timeframe: 30-minute – perfec
ZILUSDT: Trend in daily time frameThe color levels are very accurate levels of support and resistance in different time frames, and we have to wait for their reaction in these areas.
So, Please pay special attention to the very accurate trend, colored levels, and you must know that SETUP is very sensitive.
Be careful
BEST
MT
Zilliqa Defends Value Area Low, Accumulation Suggests BreakoutZilliqa has been consolidating around its value area low for a considerable amount of time, repeatedly defending this level. The extended accumulation suggests a potential breakout if supported by bullish volume inflows.
Zilliqa’s price action has remained rangebound but notably resilient. The value area low has acted as a key level of defense, with buyers consistently stepping in to absorb supply. At the same time, the monthly SIP support has been respected, adding further weight to the bullis
Zilliqa Price Coils as Bollinger Bands Signal Explosive BreakoutZilliqa (ZIL) is consolidating tightly on the weekly timeframe, with compressing Bollinger Bands suggesting an imminent volatility expansion. Bulls are watching for volume confirmation to trigger a move toward the 0.61 Fibonacci retracement zone and higher.
Zilliqa has spent several weeks trading in a narrow consolidation zone, reflecting indecision between buyers and sellers. This sideways structure has resulted in a squeeze on the Bollinger Bands — a classic signal that volatility is set to e