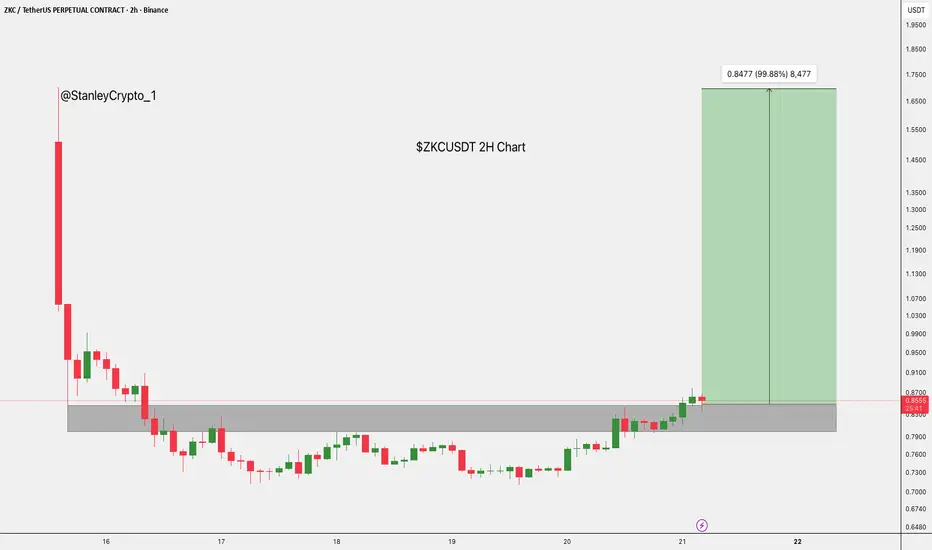
ZKCUSDT Forming Bullish MomentumZKCUSDT is forming a clear bullish momentum pattern, a classic bullish reversal signal that often indicates an upcoming breakout. The price has been consolidating within a narrowing range, suggesting that selling pressure is weakening while buyers are beginning to regain control. With consistent volume confirming accumulation at lower levels, the setup hints at a potential bullish breakout soon. The projected move could lead to an impressive gain of around 90% to 100% once the price breaks above the wedge resistance.
This bullish momentum pattern is typically seen at the end of downtrends or corrective phases, and it represents a potential shift in market sentiment from bearish to bullish. Traders closely watching ZKCUSDT are noting the strengthening momentum as it nears a breakout zone. The good trading volume adds confidence to this pattern, showing that market participants are positioning early in anticipation of a reversal.
Investors’ growing interest in ZKCUSDT reflects rising confidence in the project’s long-term fundamentals and current technical strength. If the breakout confirms with sustained volume, this could mark the start of a fresh bullish leg. Traders might find this a valuable setup for medium-term gains, especially as the wedge pattern completes and buying momentum accelerates.
✅ Show your support by hitting the like button and
✅ Leaving a comment below! (What is your opinion about this Coin?)
Your feedback and engagement keep me inspired to share more insightful market analysis with you!
In-depth trading ideas
ZKC at a Potential Trend Reversal (8H)ZKC is one of the coins that has successfully filled its long lower shadow and is currently trading around that shadow level, which can now act as a potential support zone. This behavior often indicates that liquidity below has been taken and the market may be preparing for a structural shift, provided buyers step in with sufficient momentum.
From a technical perspective, price has broken a clear descending trendline that had been acting as dynamic resistance for an extended period. This breakout is an important early signal that bearish pressure may be weakening. In addition, the recent structure suggests that a bearish Wave C likely part of a larger corrective pattern has been completed. If this count is valid, the market could be transitioning from a corrective phase into the early stages of a new bullish leg.
That said, patience is key. Rather than chasing the current price, it is more strategic to wait for a pullback into the marked entry zones shown on the chart. These areas align with structural support and potential demand zones. Entries should be executed using a DCA (Dollar-Cost Averaging) approach to manage volatility and reduce risk exposure in case of deeper retracements.
Targets are clearly defined on the chart and correspond to previous resistance levels and projected expansion zones. As always, partial profit-taking at intermediate resistance levels can help manage risk and lock in gains.
Risk management remains critical. A daily candle close below the invalidation level will invalidate this bullish scenario and suggest that the structure is not ready for continuation. In that case, reassessment of the overall market structure would be necessary.
Trade smart, manage risk, and stick to the plan.
If you have a coin or altcoin you want analyzed, first hit the like button and then comment its name so I can review it for you.
This is not a trade setup, as it has no precise stop-loss, stop, or target. I do not publish my trade setups here
ZKC (SPOT)BINANCE:ZKCUSDT
ZKC / USDT
Entry range (0.1000- 0.1180)
SL 4H 0.0960
T1 0.1700
T2 0.2560
T3 0.3000
T4 0.4000
3 optional extra targets on the chart
_______________________________________________________
Golden Advices.
********************
* collect the coin slowly in the entry range.
* Please calculate your losses before the entry.
* Do not enter any trade you find it not suitable for you.
* No FOMO - No Rush , it is a long journey.
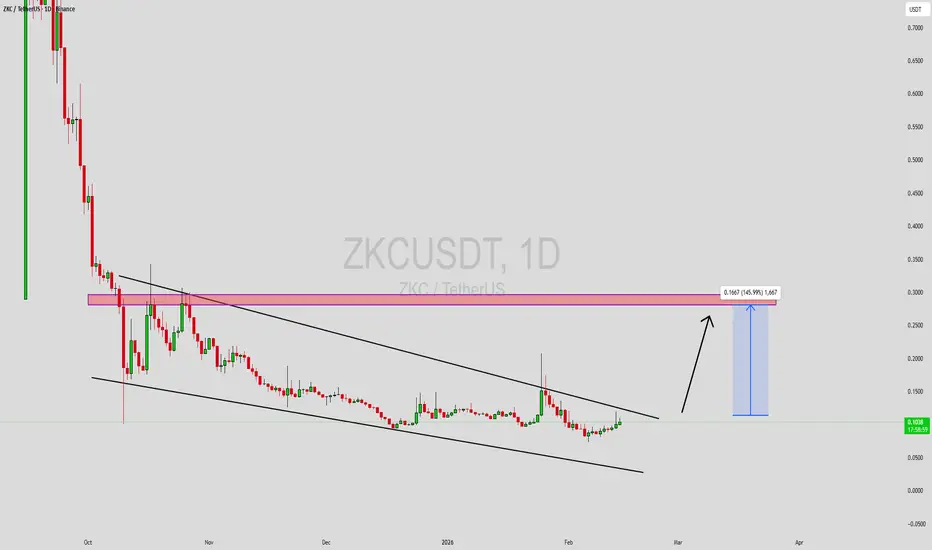
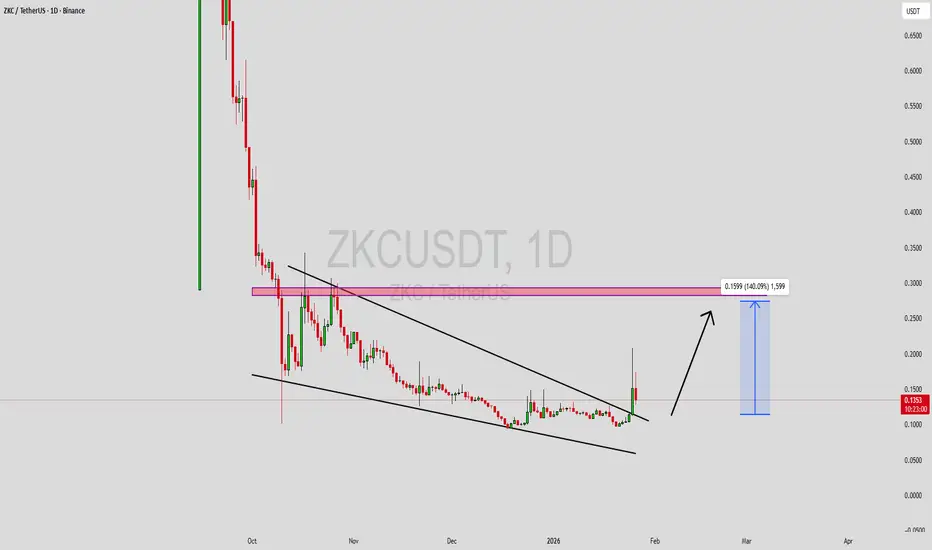
ZKCUSDT Forming Falling WedgeZKCUSDT is forming a clear falling wedge pattern, a classic bullish reversal signal that often indicates an upcoming breakout. The price has been consolidating within a narrowing range after the earlier decline, suggesting that selling pressure is steadily weakening while buyers are quietly stepping in to regain control. With consistent volume confirming accumulation at these lower levels, the setup is building toward a potential bullish breakout in the near term. If the price breaks decisively above the wedge resistance, the projected move could deliver an impressive gain of around 90% to 100% from the breakout point.
This falling wedge pattern is typically seen at the end of downtrends or during corrective phases, and it serves as a strong sign that market sentiment may be shifting from bearish to bullish. Traders closely watching ZKCUSDT are seeing a similar strengthening momentum as it approaches its own breakout zone. The solid trading volume supporting the pattern adds real confidence, showing that market participants are getting positioned early in anticipation of a reversal.
The growing interest in ZKCUSDT is driven by increasing optimism about the project’s long-term fundamentals combined with this attractive technical picture. A confirmed breakout backed by sustained volume could mark the beginning of a fresh bullish leg. Traders might view this as a high-quality setup for medium-term gains, especially once the wedge pattern fully completes and buying momentum starts to accelerate.
✅ Show your support by hitting the like button and
✅ Leaving a comment below! (What is your opinion about this Coin)
Your feedback and engagement keep me inspired to share more insightful market analysis with you!
ZKC READY TO FLY🔥 Fortune AI Radar — $ZKC
Fresh activity detected on $ZKC today.
Data suggests increasing market interest & buyers stepping in.
Technicals currently lean bullish, with momentum trending upward.
Whales showing hints of accumulation and hype rising among traders.
This coin is flashing strong signals on short-term charts — worth keeping an eye on 👀
Not financial advice — always research before taking decisions
ZKCUSDT Forming Falling WedgeZKCUSDT is forming a clear falling wedge pattern, a classic bullish reversal signal that often indicates an upcoming breakout. The price has been consolidating within a narrowing range, suggesting that selling pressure is weakening while buyers are beginning to regain control. With consistent volume confirming accumulation at lower levels, the setup hints at a potential bullish breakout soon. The projected move could lead to an impressive gain of around 90% to 100% once the price breaks above the wedge resistance.
This falling wedge pattern is typically seen at the end of downtrends or corrective phases, and it represents a potential shift in market sentiment from bearish to bullish. Traders closely watching ZKCUSDT are noting the strengthening momentum as it nears a breakout zone. The good trading volume adds confidence to this pattern, showing that market participants are positioning early in anticipation of a reversal.
Investors’ growing interest in ZKCUSDT reflects rising confidence in the project’s long-term fundamentals and current technical strength. If the breakout confirms with sustained volume, this could mark the start of a fresh bullish leg. Traders might find this a valuable setup for medium-term gains, especially as the wedge pattern completes and buying momentum accelerates.
✅ Show your support by hitting the like button and
✅ Leaving a comment below! (What is your opinion about this Coin?)
Your feedback and engagement keep me inspired to share more insightful market analysis with you!
ZKC (SPOT)BINANCE:ZKCUSDT
#ZKC/ USDT
Entry range (0.1300- 0.1500)
SL 1D close below 0.125
T1 0.230
T2 0.290
T3 0.340
T4 0.500
1 Extra Target is optional 0.650 , 0.840
_______________________________________________________
Golden Advices.
********************
* collect the coin slowly in the entry range.
* Please calculate your losses before the entry.
* Do not enter any trade you find it not suitable for you.
* No FOMO - No Rush , it is a long journey.
ZKCUSDT Forming Bullish WaveZKCUSDT is showing signs of a bullish wave pattern, signaling strong upward momentum building within the market. This pattern often appears after a consolidation phase and represents renewed buyer dominance, indicating that the pair could be preparing for a major breakout. The formation suggests that ZKCUSDT may be entering a new growth phase as it establishes higher highs and higher lows, which typically confirm a shift toward sustained bullish control.
The trading volume remains strong, supporting this potential rally and reflecting growing investor confidence in the project. With an expected gain of 260% to 280%+, the pair presents a high-reward setup for traders closely monitoring breakout zones. The steady increase in accumulation, combined with technical momentum indicators turning positive, reinforces the likelihood of a continuation in the upward trajectory once key resistance levels are cleared.
Investor interest in ZKCUSDT has been increasing, likely due to improving sentiment around the project’s fundamentals and its overall position in the broader crypto market. If the bullish wave sustains with consistent volume, this could lead to an explosive move toward new price highs, creating opportunities for both swing traders and long-term holders seeking substantial upside potential.
✅ Show your support by hitting the like button and
✅ Leaving a comment below! (What is You opinion about this Coin)
Your feedback and engagement keep me inspired to share more insightful market analysis with you!
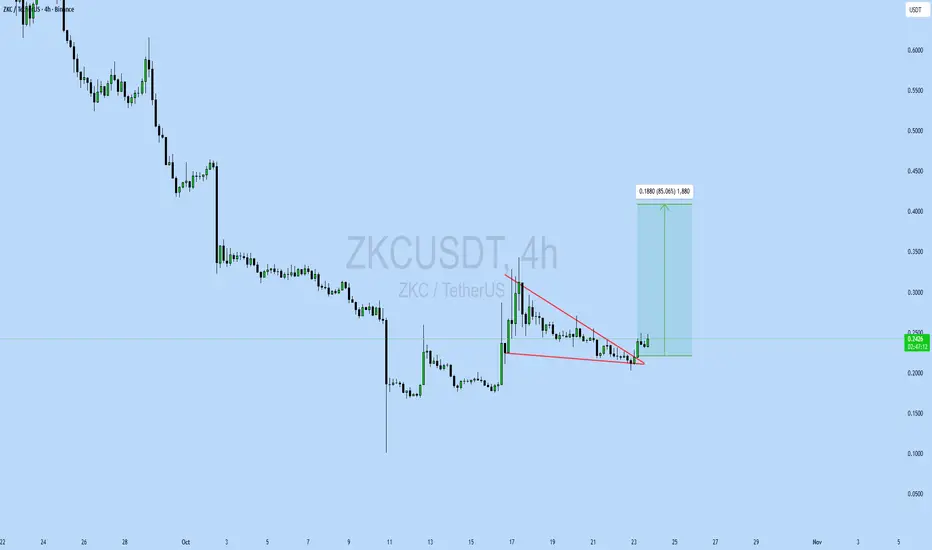
ZKCUSDT UPDATE#ZKC
UPDATE
ZKC Technical Setup
Pattern: Bullish Symmetrical Triangle
Current Price: $0.242
Target Price: $0.430
Target % Gain: 85.06%
$ZKC has broken out of a bullish symmetrical triangle pattern on the 4H timeframe. Current price is $0.242 with a projected target near $0.430, showing potential for an 85% upside move. The breakout indicates increasing bullish momentum and potential continuation to the upside.
Time Frame: 4H
Risk Management Tip: Always use proper risk management.
ZKCUSDT🧭 ZKC/USDT — Accumulation Zone and Potential Reversal Impulse (4H Analysis)
After a prolonged downtrend, ZKC/USDT is forming a broad accumulation range between 0.10 – 0.25.
Market structure indicates that a capitulation phase has likely ended, followed by a period of calm consolidation — often the first condition for a potential trend reversal.
Technical Overview
Trend: Long-term bearish, but significant liquidity has accumulated below 0.10.
Current Price: ~0.25
Support Zone: 0.10 – 0.15
Resistance Zone: 0.60 – 0.80 (first impulse target)
Risk/Reward Ratio: ~1:2.4 (favorable setup)
Trade Scenario
🎯 Entry: 0.24 – 0.26
🛑 Stop-Loss: 0.152
💰 Take-Profit: 0.617
➡️ Potential Gain: +142%
➡️ Potential Drawdown: -40%
This 1:2.38 R:R ratio represents a solid positional trade setup.
If price closes below 0.15 on the 4H timeframe, the idea becomes invalid — signaling either a re-accumulation phase or a new lower structure forming.
Fundamental Perspective
ZK-based Layer-2 projects (Zero-Knowledge technology) have recently gained attention with the rise of AI + zk-rollup narratives.
If overall market momentum returns, ZKC could react faster compared to larger-cap projects due to its lower liquidity profile.
Conclusion
ZKC/USDT is currently in a post-capitulation “quiet zone.”
The 0.15–0.25 range offers an optimal accumulation area for patient traders.
A breakout and consolidation above 0.60 would confirm a trend reversal and open the door for a new bullish phase.
ZKCUSDT: short setup from daily support at 0.3228BINANCE:ZKCUSDT.P has been falling almost continuously since its listing, with short pauses.
Right now, after another downward impulse, I see a pause. This consolidation could last for a day or for several—it's impossible to predict.
However, a clear tendency is visible on the chart: drop → consolidation → drop.
Key factors for this scenario
Global & local trend alignment
Price void / low liquidity zone beyond level
Asset decoupled from the market (relative strength/weakness vs. BTC)
Was this analysis helpful? Leave your thoughts in the comments and follow to see more.