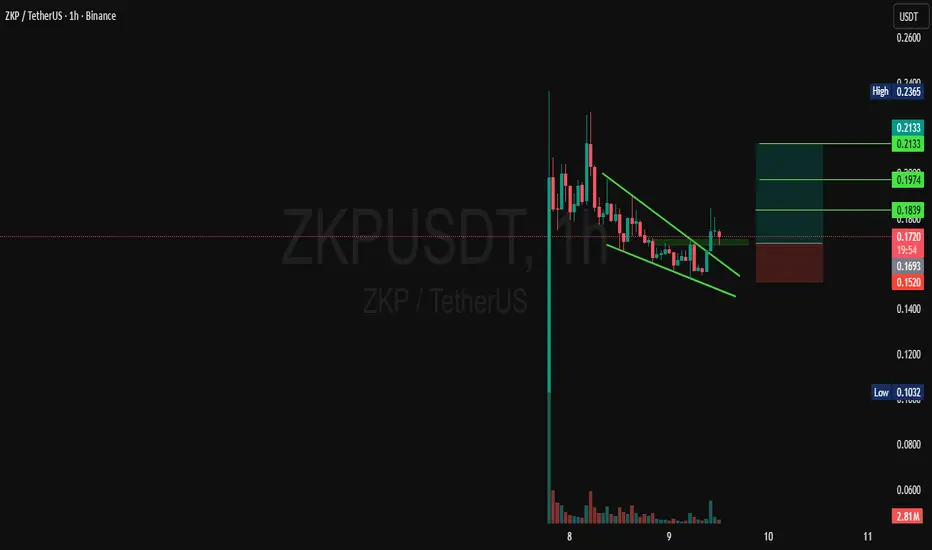
ZKPUSDT - Bear Flag, Breakdown or Reversal?📊 ZKPUSDT on the 1-hour timeframe is still trading within a Bear Flag continuation pattern after experiencing a strong impulsive decline. This pattern represents a temporary recovery phase where buyers attempt to push prices higher inside an ascending channel, but the overall market structure remains bearish.
📍 The current price is testing the lower boundary of the Bear Flag, making this a decisive area. If sellers regain control and break below the support trendline, the probability of another bearish continuation increases significantly.
🎯 The measured move projection suggests that a confirmed breakdown could drive the price toward the 0.0465–0.0460 support zone, with the possibility of extending even lower if selling pressure accelerates.
---
📊 Pattern Explanation – Bear Flag
🔻 Bear Flag Characteristics:
📉 Strong bearish impulse (Flagpole).
📈 Followed by an upward-sloping consolidation channel (Flag).
📊 Volume generally decreases during consolidation.
⚠️ A breakdown below the lower trendline usually confirms continuation of the previous downtrend.
📌 Currently, ZKPUSDT is still respecting this Bear Flag structure, meaning sellers continue to hold the overall market advantage unless buyers successfully invalidate the pattern.
---
🟢 Bullish Scenario 🚀
✅ Buyers successfully defend the lower trendline of the Bear Flag.
✅ Price rebounds and breaks above the upper resistance of the channel with strong bullish momentum.
✅ A confirmed breakout above the Bear Flag would invalidate the bearish continuation setup and could trigger a stronger recovery toward higher resistance levels.
📈 Bullish Confirmation
🟢 Strong candle close above the upper channel resistance.
📊 Increasing buying volume.
📈 Formation of Higher Highs and Higher Lows after the breakout.
---
🔴 Bearish Scenario 📉
⚠️ Sellers break below the ascending support trendline.
⚠️ The Bear Flag pattern becomes fully confirmed.
⚠️ Selling pressure is likely to increase, opening the path toward:
🎯 First Target
📍 0.0465
🎯 Second Target
📍 0.0460
📉 If bearish momentum remains strong, price could continue making new local lows below these support levels.
---
📌 Key Levels to Watch 👀
🟢 Resistance
⬆️ Upper Bear Flag Trendline
🔴 Support
⬇️ Lower Bear Flag Trendline
🎯 0.0465
🎯 0.0460
---
⚠️ Conclusion
📉 ZKPUSDT remains under bearish control as long as price continues trading inside the Bear Flag formation.
📍 The lower trendline is currently acting as the most critical support level.
🔻 A confirmed breakdown would strengthen the probability of another bearish leg toward the highlighted support zones.
🚀 Conversely, only a strong breakout above the upper channel resistance would invalidate the bearish outlook and shift momentum back in favor of buyers.
🛡️ Always wait for confirmation before entering a trade and never forget to apply proper risk management.
---
#ZKP #ZKPUSDT #Crypto #Cryptocurrency #Trading #TechnicalAnalysis #TradingView #BearFlag #PriceAction #ChartAnalysis #Binance #Altcoins #Support #Resistance #CryptoTrading #MarketAnalysis #Bearish #Bullish #RiskManagement #TrendContinuation
In-depth trading ideas
ZKPUSDT Forming Bullish MomentumZKPUSDT is forming a clear bullish momentum pattern, a classic bullish reversal signal that often indicates an upcoming breakout. The price has been consolidating within a narrowing range, suggesting that selling pressure is weakening while buyers are beginning to regain control. With consistent volume confirming accumulation at lower levels, the setup hints at a potential bullish breakout soon. The projected move could lead to an impressive gain of around 90% to 100% once the price breaks above the wedge resistance.
This bullish momentum pattern is typically seen at the end of downtrends or corrective phases, and it represents a potential shift in market sentiment from bearish to bullish. Traders closely watching ZKPUSDT are noting the strengthening momentum as it nears a breakout zone. The good trading volume adds confidence to this pattern, showing that market participants are positioning early in anticipation of a reversal.
Investors’ growing interest in ZKPUSDT reflects rising confidence in the project’s long-term fundamentals and current technical strength. If the breakout confirms with sustained volume, this could mark the start of a fresh bullish leg. Traders might find this a valuable setup for medium-term gains, especially as the pattern completes and buying momentum accelerates.
✅ Show your support by hitting the like button and
✅ Leaving a comment below! (What is your opinion about this Coin?)
Your feedback and engagement keep me inspired to share more insightful market analysis with you!
ZKPUSDT — Bearish Setup | 30M Scalping#ZKPUSDT is showing strong volume, but the 30-minute timeframe has formed a clear bearish divergence, signaling momentum weakness. Price has also broken short-term support, confirming a bearish market structure.
Trade Plan:
Bias: Bearish
Entry: Short at CMP or Sell Stop below previous support
SL: Above recent lower high
TP: Nearest intraday support zones
RR: Minimum 1:2 with strict risk management
No support = no longs. Shorts favored until structure changes.
👍 Like | 💬 Comment | ⭐ Follow for more scalping & intraday ideas
#ZKPUSDT #Scalping #IntradayTrading #BearishDivergence
#MarketStructure #SupportResistance #CryptoTrading
#PriceAction #VolumeAnalysis #ShortTrade #TradingViewIdeas
ZKP GOT HIDDEN POTENTIAL🔥 Fortune AI Radar — CRYPTOCAP:ZKP
Fresh activity detected on CRYPTOCAP:ZKP today.
Data suggests increasing market interest & buyers stepping in.
Technicals currently lean bullish, with momentum trending upward.
Whales showing hints of accumulation and hype rising among traders.
This coin is flashing strong signals on short-term charts — worth keeping an eye on 👀
Not financial advice — always research before taking decisions
$ZKP Momentum Fading Under ResistanceA few of you asked about NASDAQ:ZKP here’s my take 👇
Honestly… it looks bearish right now.
We’ve seen this setup before:
Sharp spike → slow fade → momentum dies.
Price is under resistance, below key MAs, and structure looks weak.
This isn’t a bottom-catching spot.
If anything, weakness favors shorts not longs.
Let it come lower. Let structure shift. No rush.
Sometimes the best trade is the one you don’t take.
DYOR | NFA
ZKPUSDT Forming Bullish WaveZKPUSDT is forming a clear bullish wave pattern, a classic bullish reversal signal that often indicates an upcoming breakout. The price has been consolidating within a narrowing range, suggesting that selling pressure is weakening while buyers are beginning to regain control. With consistent volume confirming accumulation at lower levels, the setup hints at a potential bullish breakout soon. The projected move could lead to an impressive gain of around 90% to 100% once the price breaks above the wedge resistance.
This bullish wave pattern is typically seen at the end of downtrends or corrective phases, and it represents a potential shift in market sentiment from bearish to bullish. Traders closely watching ZKPUSDT are noting the strengthening momentum as it nears a breakout zone. The good trading volume adds confidence to this pattern, showing that market participants are positioning early in anticipation of a reversal.
Investors’ growing interest in ZKPUSDT reflects rising confidence in the project’s long-term fundamentals and current technical strength. If the breakout confirms with sustained volume, this could mark the start of a fresh bullish leg. Traders might find this a valuable setup for medium-term gains, especially as the wedge pattern completes and buying momentum accelerates.
✅ Show your support by hitting the like button and
✅ Leaving a comment below! (What is your opinion about this Coin?)
Your feedback and engagement keep me inspired to share more insightful market analysis with you!
ZKP/USDT – This Accumulation Could Be the Next Big BouncePrice has been bleeding inside a clear downtrend, but the momentum is now slowing down. We are seeing strong accumulation at the base, right after price tapped the demand zone and reacted sharply.
The descending trendline is being pressured, and any sustained hold above this area increases the probability of a trend reversal rally. This is the type of zone where smart money typically builds positions before expansion.
If price continues to respect the accumulation base, the path toward higher liquidity becomes very clear.
Entry Zone: Current price area
Stop Loss: 0.1272
Target 1: 0.15427
Target 2: 0.17220
As long as the base holds, the bullish scenario remains valid.
Failure to hold the base invalidates the setup.
ZKPUSDT – Bearish Setup (SMC & Price Action)The market is clearly in a downtrend, with a bearish BOS confirming seller strength.
Because of this structure shift, we can start looking for short positions.
I’ve marked a bearish refined order block between 0.13000 – 0.13066.
Price has already taken the IDM, and we can also see previous rejection from this zone, which gives extra confidence for a downside move.
If price revisits this order block and shows rejection again, we can expect continuation to the downside.
Let’s wait for price to react at the zone and trade with proper risk management.
Hope for the best 🤞
ZKP PANTHER PROTOCOL $0.031 | End to End Real World Solution something or definitely a working project that its time has come
a facility that covers current and future de fi requirements
on top of it is the beauty of its being COMPLIANT
and adaptable or built on NEAR MATiC FLARE and AVAX
still under the radar or un appealing to most as it tank from launching
it has the same dna that of INJECTIVE and AiOZ
or so most PROJECTS which narratives that were shelved until again ITS TIME HAS COME
ROADMAp is on schedule Q1 2024
Risk Reward.. so worth it more so solid base established with STAKING on the move at 15%
ZKPUSD - 1D - up to 75% ?Hi guys
lets have a look at panther protocol (ZKP) forming a hudge falling wedge with a strong increase in volume as shown in the red rectangle...
If this wedge breaks the price could reach the 0.03$ zone.
If the price has to drop, i'd like to see a reaction around 0.015-0.016$
Like if you share
NFA