ZK at macro floor: base recovery toward $0.00997The Macro Picture 🗺️
ZK ground down from the $0.02008 macro ceiling all the way to the $0.00768 macro floor and has flattened onto it at $0.00786. The long, steady bleed has given way to a base right on support — exhaustion rather than continuation.
The Setup ⚙️
The Accumulation Zone 🟢
$0.00717–0.00786 is where the selling has dried up. Macro Support has held on retest, with the $0.00717 Local Low as the deeper backstop — this is the demand base a recovery would build from.
The Decision Point 🔴
$0.01251 (Local High) is the structural gate far above. Before it, the $0.00997 measured-move target is the first objective — reclaiming it proves buyers are stepping back in.
The Roadmap 🛣️
Hold the $0.00768 floor → recover toward $0.00997 as the first leg up. Invalidation is a clean daily close below $0.00717 — that voids the accumulation thesis.
This is a textbook DCA Accumulation Zone setup: scale in across the $0.00768 floor band and let the base do the work.
#ZK #zkSync #crypto #trading #TA #3Commas #DCA
In-depth trading ideas
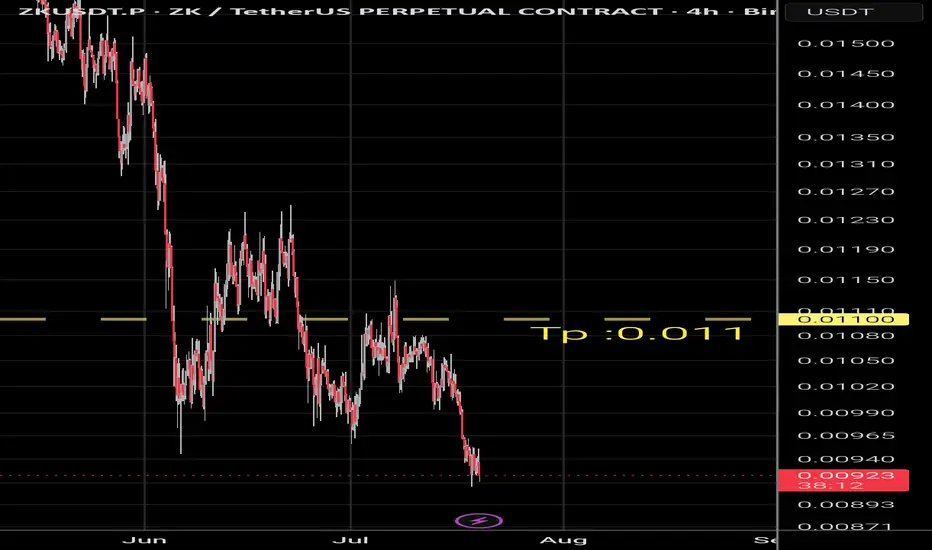
ZkColossians 3:3 — "For ye are dead, and your life is hid with Christ in God. When Christ, who is our life, shall appear, then shall ye also appear with him in glory."
ZK — Zero Knowledge. The hidden proof. The truth that needeth no revelation of its mechanics.
Hidden in the depths. Waiting. Silent. Patient.
0.011 is where it appeareth in glory. The proof is shown. The life hidden in code cometh forth.
ZKUSDT - Bear Flag, Breakdown or Rebound from a Critical Zone?On the 8-hour timeframe, ZKUSDT remains within a strong downtrend structure that has been in place since mid-May. After experiencing a sharp decline, price entered a consolidation phase and formed a Bear Flag Pattern 🐻🚩, highlighted by the ascending yellow channel.
A Bear Flag is a bearish continuation pattern that typically appears after a strong downward impulse (flagpole) 📉, followed by a weak upward correction (flag) before the next leg down begins.
Currently, price is losing momentum around the middle of the channel ⚠️ and is once again approaching the lower trendline support, increasing the probability of a potential breakdown.
---
🐻🚩 Pattern Overview: Bear Flag
🔍 Bear Flag Characteristics on This Chart:
✅ Formed after a strong bearish impulse (flagpole).
✅ Price is moving upward within a relatively narrow ascending channel.
✅ Buying momentum appears weaker compared to the previous selling pressure.
✅ The overall market structure continues to print Lower Highs relative to the broader trend.
✅ Price is currently testing a key support area near the lower boundary of the channel.
📌 As long as price remains below the major resistance and inside the channel, the Bear Flag Continuation Pattern remains valid.
---
🐂 Bullish Scenario
A bullish outlook would only be confirmed if:
🟢 Price successfully holds above the red trendline support.
🟢 A strong rebound emerges from the current support zone.
🟢 Price breaks out and closes above the upper channel resistance.
🟢 Market structure begins forming a new Higher High.
🎯 Bullish Targets:
🚀 0.01180
🚀 0.01230
🚀 0.01300
💡 If the channel breakout is confirmed, the Bear Flag setup would lose validity and could transition into a short-term reversal structure.
---
🐻 Bearish Scenario
The scenario currently carrying the higher probability is:
🔴 Price fails to hold the lower trendline support.
🔴 A confirmed breakdown occurs below the Bear Flag channel.
🔴 An 8H candle closes beneath the key support zone.
If the breakdown is confirmed, the next downside targets are located at the horizontal support levels highlighted on the chart.
🎯 Bearish Targets:
📉 0.01025
📉 0.00995
📉 0.00945
⚠️ The 0.00945 area represents the primary Bear Flag target based on the projected downside move illustrated on the chart.
---
📌 Conclusion
ZKUSDT remains trapped within a Bear Flag Pattern 🐻🚩, which is technically considered a bearish continuation structure following the previous sharp decline.
⚠️ The lower trendline support is the key decision zone for the next major move.
📉 A confirmed breakdown could open the path toward 0.01025 – 0.00945.
📈 On the other hand, a breakout above the channel resistance would invalidate the Bear Flag and potentially trigger a recovery toward the 0.01200–0.01300 region.
🎯 For now, as long as price remains inside the channel and below major resistance, the overall market bias remains bearish.
---
#ZKUSDT #ZK #Crypto 🚀 #Cryptocurrency #TechnicalAnalysis 📊 #PriceAction #BearFlag 🐻🚩 #BearishPattern #ChartAnalysis #Altcoins #CryptoTrading #FuturesTrading #SupportAndResistance #Breakdown 📉 #TrendFollowing #MarketStructure #TradingSetup #CryptoSignals #BullishScenario 🐂 #BearishScenario 🐻
ZKUSDT 1D#ZK is currently trading within a falling wedge pattern on the daily chart. The price has bounced from the wedge support and is now moving toward the wedge resistance.
In case of a breakout above the wedge resistance, the following upside targets could come into play:
🎯 $0.01343
🎯 $0.01629
🎯 $0.02019
🎯 $0.02335
🎯 $0.02651
🎯 $0.03100
⚠️ Always remember to use a tight stop-loss and maintain proper risk management.
#ZKUSDT - Don't waste this opportunity!#ZK
The price is moving within a descending channel on the hourly timeframe. It has reached the lower boundary and is trending towards a bounce. A retest of this boundary is expected.
The Relative Strength Index (RSI) indicates a downward trend, and this trend is likely to continue due to the overbought condition.
A key support zone has been identified in green at 0.01350. The price has bounced off this zone several times, making it a strong support level.
The price is trending towards the 100-period moving average, which we are approaching. This trend supports an upward move.
Entry Price: 0.01440
First Target: 0.01474
Second Target: 0.01515
Third Target: 0.01578
You can close at the second target or wait for the third target to be reached. The choice is yours.
Stop Loss: At the resistance zone in green.
Remember this simple rule: Money Management.
Any questions? Please leave a comment.
Thank you.
ZK Local Trend. Wedge. Reversal Zone and %. 2025 12 27Logarithm. 3-day timeframe.
Main trend for clarity (lower zone of the descending channel).
Declines from the high ("funds are buying 458 million worth of nothing") - 90%.
The long squeeze, due to the extremely low liquidity of the former hyped "saving the world" instrument, was carried out by a phenomenal -93% on a half-empty order book.
Secondary and local trends .
The key is a breakout of the descending wedge and local resistance zone.
Reversal zones and % of key support/resistance levels for building a trading plan and risk management.
Most market participants find it very unpleasant and difficult (they can't bring themselves to) to buy low (fear) and sell high (greed). For them, it's the other way around.
Manage your risks and stick to your trading plan. Don't get caught up in market and news noise, which shapes the opinions and illogical actions of the majority, who are doomed to lose in the future.
ZKUSDT Forming Bullish WaveZKUSDT is forming a clear bullish wave pattern, a classic bullish reversal signal that often indicates an upcoming breakout. The price has been consolidating within a narrowing range, suggesting that selling pressure is weakening while buyers are beginning to regain control. With consistent volume confirming accumulation at lower levels, the setup hints at a potential bullish breakout soon. The projected move could lead to an impressive gain of around 90% to 100% once the price breaks above the wedge resistance.
This bullish wave pattern is typically seen at the end of downtrends or corrective phases, and it represents a potential shift in market sentiment from bearish to bullish. Traders closely watching ZKUSDT are noting the strengthening momentum as it nears a breakout zone. The good trading volume adds confidence to this pattern, showing that market participants are positioning early in anticipation of a reversal.
Investors’ growing interest in ZKUSDT reflects rising confidence in the project’s long-term fundamentals and current technical strength. If the breakout confirms with sustained volume, this could mark the start of a fresh bullish leg. Traders might find this a valuable setup for medium-term gains, especially as the wave pattern completes and buying momentum accelerates.
✅ Show your support by hitting the like button and
✅ Leaving a comment below! (What is your opinion about this Coin?)
Your feedback and engagement keep me inspired to share more insightful market analysis with you!
ZK: hunting the dip? key levels and targets for todayZK
Catching the ZK dip or did you already panic sell the bottom? L2 and restaking narratives are back on headlines according to market chatter, and speculative capital keeps rotating into smaller caps after the recent moves in majors. Today ZK printed a sharp bounce right as sentiment turned and funding cooled a bit, which is usually when smart money starts hunting discounts.
On the 4H chart price is reacting cleanly from that big orange demand block after an oversold RSI bounce, with buyers stepping in on rising volume. As long as we hold this zone, I’m leaning toward a corrective push up into the first red supply band above, where previous longs got trapped. I might be wrong, but this looks more like a relief rally brewing than a dead-cat bounce.
My base plan: ✅ look for dips inside the orange area for low-leverage longs, targeting the mid to upper part of the red zone as take-profit, scaling out on the way up. If price loses the bottom of the orange block and RSI rolls over again, then I flip the script and expect a deeper flush to the next untested levels below. I’m stalking entries, not chasing green candles here.
ZK Facing Critical Breakout LevelZK continues to trade inside a large descending channel on the 8H timeframe, maintaining the broader bearish structure that has been in place since the previous highs. Price has consistently respected the upper trendline as resistance while gradually drifting toward the lower channel support.
Recently, the market formed a rounded bottom near the 0.0177 support area, indicating a slowdown in bearish momentum and the beginning of a short-term accumulation phase. Price is now pushing back toward the 0.020–0.021 resistance zone, which aligns with both a horizontal resistance level and the descending trendline.
This area becomes the key decision level for the next move.
Bullish scenario:
A clean breakout and sustained move above 0.021 could confirm the rounded bottom structure and trigger a recovery toward 0.024–0.026, potentially testing the mid-to-upper region of the channel.
Bearish scenario:
If price fails to break the descending resistance, rejection from this zone could send ZK back toward 0.018–0.0177 support, keeping the asset trapped inside the broader bearish channel.
ZKUSDTZKUSDT is still trading inside a falling parallel channel, but a few early bullish signs are starting to appear 👀
MACD is trying to turn up on the logarithmic chart, while price action has started to move sideways after a long downtrend. That’s not confirmation yet, but it can be an early sign of accumulation.
The POC shows the price level with the highest traded volume in this range, making it an important zone to watch. If price can break above 0.0364 USDT, momentum could slowly start shifting upward 📈
I’m not saying this is super bullish yet — just that the chart is becoming more interesting. I’m accumulating slowly on spot and staying patient 🤝
ZK: dip buying or falling knife? key levels to watch todayZK - dip buying or just catching a falling knife? L2 names are still in the spotlight, but according to the market the latest headlines are more about unlocks and profit taking than fresh hype, and you can see it in this bleed. Today we got a violent wick down and instant bounce, classic “stop hunt in a downtrend” behavior.
On the 4H chart price is still locked in a clean down channel, trading under the broken support around 0.020 - now my main resistance. RSI just ripped from oversold back to mid range and volume spiked on that wick, which for me screams relief rally, not trend change. I might be wrong, but I still see any bounce into the high volume node around 0.0205-0.0215 as a place where sellers are waiting.
My base plan: look for exhaustion signs in that 0.0205-0.0215 zone and build a short, targeting first the recent low near 0.018 and, if momentum stays heavy, extension toward 0.016 ✅. If buyers somehow reclaim 0.022 on a strong 4H close, I scrap the short idea and then a squeeze toward the next supply around 0.024+ opens up. For now I’m flat and waiting for price to come to my level, not the other way around.
#ZK /USDT - Don't waste this opportunity!
#ZK
The price is moving within a descending channel on the hourly timeframe. It has reached the lower boundary and is heading towards a breakout, with a retest of the upper boundary expected.
The Relative Strength Index (RSI) is showing a downward trend, approaching the lower boundary, and an upward bounce is anticipated.
There is a key support zone in green at 0.02654. The price has bounced from this level several times and is expected to bounce again.
The RSI is showing a trend towards consolidation above the 100-period moving average, which we are approaching, supporting the upward move.
Entry Price: 0.02827
Target 1: 0.02887
Target 2: 0.03017
Target 3: 0.03142
Stop Loss: Below the green support zone.
Remember this simple thing: Money management.
For any questions, please leave a comment.
Thank you.
ZKUSDT 1D#ZK is trading within a falling wedge pattern on the daily chart and has bounced from the wedge support with strong volume. Wait for a clean breakout above the wedge resistance and the daily SMA50 before entering. If confirmed, the potential upside targets are:
🎯 $0.03534
🎯 $0.04483
🎯 $0.05250
🎯 $0.06017
🎯 $0.07109
🎯 $0.08500
⚠️ Always apply tight stop-losses and maintain strict risk management.
ZKUSDT Forming Bullish PennantZKUSDT is forming a clear bullish pennant pattern, a classic bullish reversal signal that often indicates an upcoming breakout. The price has been consolidating within a narrowing range, suggesting that selling pressure is weakening while buyers are beginning to regain control. With consistent volume confirming accumulation at lower levels, the setup hints at a potential bullish breakout soon. The projected move could lead to an impressive gain of around 190% to 200% once the price breaks above the pennant resistance.
This bullish pennant pattern is typically seen at the end of downtrends or corrective phases, and it represents a potential shift in market sentiment from bearish to bullish. Traders closely watching ZKUSDT are noting the strengthening momentum as it nears a breakout zone. The good trading volume adds confidence to this pattern, showing that market participants are positioning early in anticipation of a reversal.
Investors’ growing interest in ZKUSDT reflects rising confidence in the project’s long-term fundamentals and current technical strength. If the breakout confirms with sustained volume, this could mark the start of a fresh bullish leg. Traders might find this a valuable setup for medium-term gains, especially as the pennant pattern completes and buying momentum accelerates.
✅ Show your support by hitting the like button and
✅ Leaving a comment below! (What is your opinion about this Coin?)
Your feedback and engagement keep me inspired to share more insightful market analysis with you!
$ZK 1D CHART UPDATE
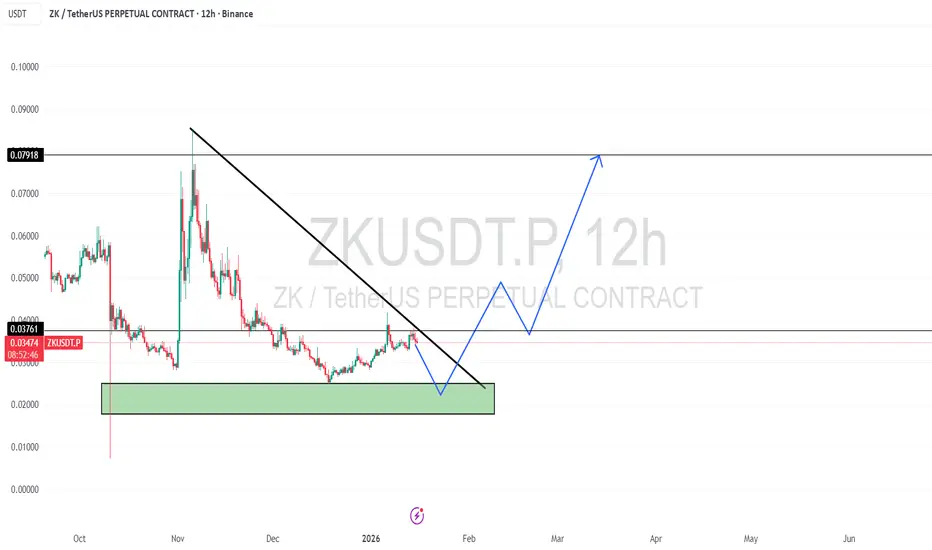
📌 CFI:ZK Technical Analysis: The market has recently experienced a massive price dump, sliding from approximately $0.084 down to the $0.025 - $0.035 range. While the long-term trend remains weak, we are seeing signs of stabilization near historical lows.
📌 The Path to Bullish Confirmation: To see a sustainable move toward the upside, the following three technical conditions must be met:
Touch the Support Zone: The price needs to drop and interact with the primary Green Support Zone to find necessary liquidity.
Hold the Support: Buyers must step in and prevent the price from closing below this zone on the daily candle.
Breakout Trendline: A decisive breakout above the long-term descending trendline is required to shift the market structure from bearish to bullish.
📌 Indicator Check (1D Timeframe):
Relative Strength Index (RSI): Currently sitting in the neutral zone. This is healthy as it shows there is no immediate "overbought" pressure, leaving plenty of room for a price rally once a breakout occurs.
Moving Averages: The 50-day SMA is currently sloping upward and acting as a potential dynamic support. However, the 200-day SMA is still positioned above the current price, acting as a major long-term resistance that bulls need to reclaim.
ZK is approaching its lows. I'm expecting a rebound. Full plan.ZK is slowly approaching its lows. It is dangerous to enter at the current level because the RSI clearly shows that we are approaching it.
I have marked the approximate buy zone in green and indicated the stop zone. Please proceed with caution.
I have also shown the targets for taking profits on the chart, so you can make informed decisions. Personally, I will exit at the first zone and move the stop to BU. If it goes up, great! If not, we've already made money with stops at BU.
ZKUSDT 8H#ZK has broken above the falling wedge pattern on the 8H timeframe. It is currently facing the SMA50, and a retest is in progress. In case of a successful bounce and a breakout above the SMA50, the potential targets are:
🎯 $0.04322
🎯 $0.05040
🎯 $0.05619
🎯 $0.06199
🎯 $0.07025
⚠️ Always remember to use a tight stop-loss and maintain proper risk management.
ZK/USDT - Falling Wedge – Breakout or Breakdown Ahead?ZK/USDT is entering a critical phase after a prolonged decline since early November. Price is now holding right above the 0.0347–0.0320 demand zone, the same area that previously triggered a strong bullish reaction. At the same time, sellers have been compressing price into a falling wedge structure, a pattern that historically carries a high probability of triggering major trend reversals.
This narrowing wedge signals that volatility is being compressed to its maximum point. The tighter the structure becomes, the stronger the potential breakout. If buyers manage to break above the upper wedge trendline, ZK may release weeks of accumulated bearish pressure and shift into a new bullish phase.
But this demand zone is also the bulls’ final line of defense. A clean breakdown below 0.0320 would invalidate the structure and open the door for deeper downside toward previous lows.
---
Bullish Scenario (High Probability Reversal if Confirmed)
Bullish confirmation checklist:
1. A strong 4H candle closes above the upper wedge.
2. A successful retest of the trendline as new support.
3. Increased volume on the breakout (momentum confirmation).
If confirmed, ZK’s upside potential opens toward:
Target 1: 0.0405
Target 2: 0.0455
Target 3: 0.0540
Major extension: 0.0645 – 0.0685
This structure often appears just before mid-trend to major reversals.
---
Bearish Scenario (Trend Continuation if Support Fails)
Bearish confirmation checklist:
1. Price rejects the upper wedge and loses upward momentum.
2. A decisive 4H close below 0.0320.
3. Retest of 0.0320 acting as new resistance.
Downside targets if breakdown occurs:
Target 1: 0.0280
Target 2: 0.021–0.023 if bearish momentum accelerates.
A breakdown at this zone would re-establish a deeper bearish structure with new lower lows.
---
Why This Zone Matters
1. The 0.0347–0.0320 demand zone has acted as a strong accumulation area before.
2. Falling wedges are often used by smart money as a transition pattern from distribution to accumulation.
3. Extended consolidation at support usually precedes large directional moves.
4. Low-volume dips into demand often indicate the final phase before reversal.
This makes the current price zone not just a support level, but a decision point for the next major trend.
#ZKSync #ZKUSDT #CryptoAnalysis #PriceAction #FallingWedge #DemandZone #BreakoutSetup #CryptoTrading #AltcoinAnalysis
#ZK/USDT - Don't waste this opportunity!#ZK
The price is moving in a descending channel on the 1-hour timeframe. It has reached the lower boundary and is heading towards breaking above it, with a retest of the upper boundary expected.
We have a downtrend on the RSI indicator, which has reached near the lower boundary, and an upward rebound is expected.
There is a key support zone in green at 0.03466. The price has bounced from this level multiple times and is expected to bounce again.
We have a trend towards consolidation above the 100-period moving average, as we are moving close to it, which supports the upward movement.
Entry price: 0.03580
First target: 0.03640
Second target: 0.03720
Third target: 0.03830
Don't forget a simple principle: money management.
Place your stop-loss order below the support zone in green.
For any questions, please leave a comment.
Thank you.
ZK: The Calm Before the ImpulseDespite the fact that the invalidation zones from my previous ZK idea were breached, the long setup didn’t break at all — it simply completed its final missing piece.
ZK is now shaping up for something big.
It really feels like the spring is getting tighter and about to snap upward.
🎯From the current price, my targets remain the same:
Target 1: 0.042
Target 2: 0.045
Target 3: 0.047
⚡️Risk/Reward:
• To T1 (0.042): ~2.6R
• To T2 (0.045): ~7.6R
• To T3 (0.047): ~11R
❌My idea gets cancelled only if price drops to 0.0399.
Until then, the structure looks clean, momentum is building, and an impulsive move seems close. 🚀
ZKUSDT swing trade or spot investmentZKsync stopped being a "raw" L2 solution and started playing in an adult league. After the Atlas upgrade, the network accelerated to 15,000 TPS, confirmations were reduced to a second, and the architecture became ready for tokenization of real assets and corporate use. Additionally, public praise from Vitalik Buterin: “ZKsync has done a lot of underrated and valuable work in the Ethereum ecosystem.” As a result in early November, the price has growth by 200% and there is still a lot of space for growth. I would personally wait for $0.5-0.8$ price in the bullish trend