Jump in this Massive buy in ZORAusdtHello Traders!
Market is now ready to go Bullish. Patterns are changing and market is turning bullish. This is a massive move. It will take time to achieve Target but it will be at our target before going anywhere else.
Stoploss 0.01268(-11.6%)
Target 0.0175(+23%)
My aim is to achieve highest win rate in tradingview trading community :) and we will definitely do that.
Trade Analysis Based On:
• A1000x Master Reversal Strategy
• A1000x Secret S/R Strategy
• Candlestick Patterns
• A1000x Stop Loss & Target Strategy
We trade using carefully developed strategies and disciplined market analysis, always seeking the best possible accuracy while remembering that ultimate success comes only by the will of Allah.
In some trades, you may notice a relatively larger stop loss or a risk-to-reward ratio that may appear unusual at first glance. However, every trade is taken with proper planning and calculated analysis, not random entries.
Before entering any position, we perform detailed calculations and market evaluation. Based on this analysis, we carefully determine our stop loss and target levels.
I personally apply one of my specialized stop-loss and target strategies, designed to place the stop loss at a logical market level where price is less likely to reach before moving toward the intended target — InshaAllah.
Trading always involves risk, but with discipline, patience, and proper strategy, we aim for consistent and responsible decision-making.
Feel free to share your thoughts, leave a comment, or contact me.
In-depth trading ideas
Buy the Zora NowHello Traders!
We are ready to go for a buy in Zorausdt and we will achieve the target soon. There are strong bullish patterns and its ready to move upside.
Stoploss 0.0164(-4.3%)
Target 0.01837(+7%)
My aim is to achieve highest win rate in tradingview trading community :) and we will definitely do that.
Trade is analyzed with
A1000x master reversal strategy
A1000x secret S/R strategy
Candlestick pattern
A1000x Stop loss and target strategy
We trade using some of the most powerful methods in the market, designed to achieve exceptionally high accuracy.
In some trades, you may notice a relatively large stop loss or an unfavorable risk-to-reward ratio. However, there is no need to worry about that. We do not enter trades randomly or take positions that are likely to hit the stop loss.
Before entering any trade, we perform detailed calculations and analysis. Based on these calculations, we carefully set our stop loss and target levels.
I personally use one of my specialized stop-loss and target strategies, ensuring that the stop loss is placed at a level where the market is highly unlikely to reach before hitting the target.
Feel free to Share, Comment or to contact me.
ZORA continues to fall.... when bottom?ZORA is still trading within a clear downtrend, with price continuing to respect lower highs and lower lows.
We’re currently sitting at a key demand area, but this alone isn’t a reason to get aggressive. Location matters, confirmation does more.
Above price sits a heavy overhead supply zone that previously acted as support. Until that area is reclaimed and held, any upside move should be treated as corrective, not a trend shift.
For now:
• Bearish structure remains intact
• Price is at an important area, not a signal
• Patience > prediction
• Waiting for structure before risk
This is a zone to watch, not force. Let price do the work first.
Not financial advice.
Long trade
Trade Details
Pair: ZORAUSDT
Bias: Buy-side
Date: Fri 2nd Jan 2026
Session: Tokyo Session PM
Entry: 0.03916
TP: 0.04421 (~19.94%)
SL: 0.03868 (~1.49%)
RR: 13.36
Trade Journal — Context & Thesis
🧭 Market Context
ZORAUSDT was transitioning out of a prolonged rotational and sell-side dominant phase into a potential bullish re-pricing environment. Higher-timeframe price action showed repeated failures to sustain downside continuation, with sell-side liquidity progressively absorbed below prior range lows.
The broader structure suggested a late-stage bearish auction, where further downside attempts were increasingly inefficient and met with responsive demand.
📦Value, VWAP & Fair Price Assessment
Anchored VWAP and deviation bands provided a clear fair value reference. Price acceptance back above:
VWAP
Lower deviation bands
Prior internal range support
confirmed a failed bearish auction and marked the shift toward bullish value acceptance.
This acceptance above value was the primary institutional signal supporting the buy-side thesis.
📐 Structure & PD Array Confluence
The trade aligned with multiple bullish PD arrays:
Reclaimed VWAP value
Mitigated downside FVGs
Internal range low support
Discounted price relative to prior distribution leg
Structure shifted intraday with higher lows forming post-reclaim, validating early bullish structure development.
Short trade
📘 ZORAUSDT continues to trade in a rotational environment, with liquidity cycling between premium and discount. Precision execution at PD arrays is favoured over directional bias until a higher-timeframe break of structure occurs.
🧭 Higher-Timeframe Context
The market remains structurally corrective, not trending.
Price is oscillating between well-defined premium and discount zones, repeatedly respecting FVGs and session highs/lows. No sustained HTF BOS → rotational environment dominates.
Primary read: This is a dealer-style market, rewarding precision entries rather than directional conviction.
💧 Liquidity & Behavioural Narrative
Multiple sell-side executions at a premium have played out successfully, indicating:
Buy-side liquidity is being engineered above short-term highs.
Smart money is selling into strength. Downside moves consistently pause and react at discount/demand zones, confirming: Responsive buyers, not trend continuation sellers.
🧠 Interpretation: Liquidity is being cycled, not accumulated for a trend. Each leg is being used to rebalance the range.
🟦 TAB 15 — What Price Is Targeting
Primary draw:
Open Price Zone
Secondary draw:
Prior internal equal lows
ZORA Sell/Short Setup (2H)Add this pair to your watchlist; if it reaches our entry zone, we’ll take a position
The price shows strong confirmations for a drop | the short-term trendline has been broken, and the supportive order blocks have failed.
The market has been ranging for a while, but the price seems likely to break out to the downside.
Targets, stop-loss, and entry zone are marked on the chart.
For risk management, please don't forget stop loss and capital management
When we reach the first target, save some profit and then change the stop to entry
Comment if you have any questions
Thank You
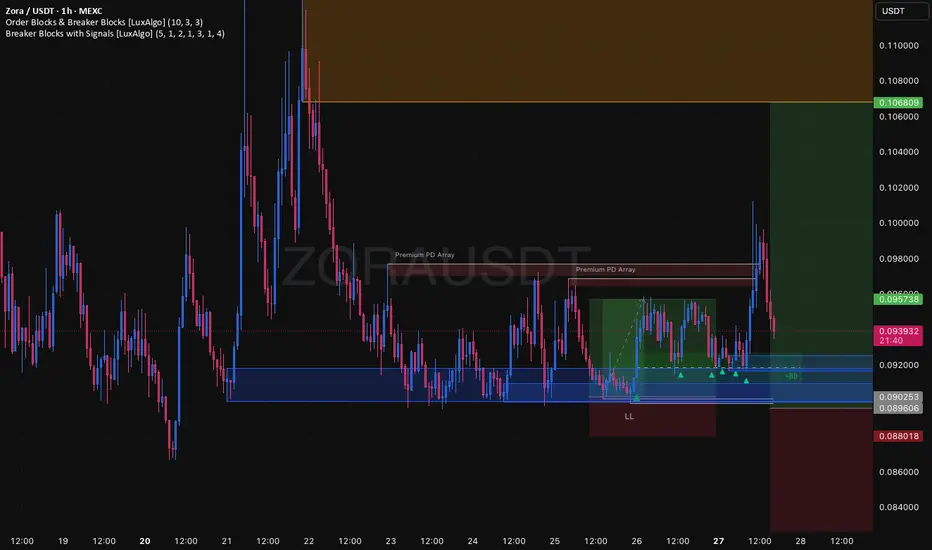
ZORAUSDT – Trade Setup Analysis (MEXC)Clear bullish momentum spotted on ZORAUSDT (1h, MEXC). Setup leans on structure and reaction to recent levels.
Analysis:
Trend: Price is showing near-term bullish continuation, supported by higher lows and rejection wicks on current candles.
Support Zone: Strong buying interest near the 0.0935–0.0940 region. Recent candles confirm buyers stepping in.
Resistance: Next clear resistance around 0.0950–0.0960 as shown by previous highs and market reactions.
Volume: Slight uptick on green candles, indicating healthy participation.
Trade Plan:
Long Bias
Entry: 0.0941–0.0942 (on retest or minor dip)
Stop: Below 0.0935 (invalidate if price closes below recent support)
Target(s): First TP at 0.0950, extended target near 0.0960
Invalidation: Setups invalid if breakdown below 0.0935 area on strong volume.
Reasoning:
Setup is based on price structure, reaction at support, and minor volume confirmation. No confirmation = no trade. Risk should be strictly managed.
Disclaimer: Not financial advice. Purely an analytical setup for study purposes.
ZONAUSDT Coin Analysis and CommentaryZONAUSDT Coin Analysis and Commentary
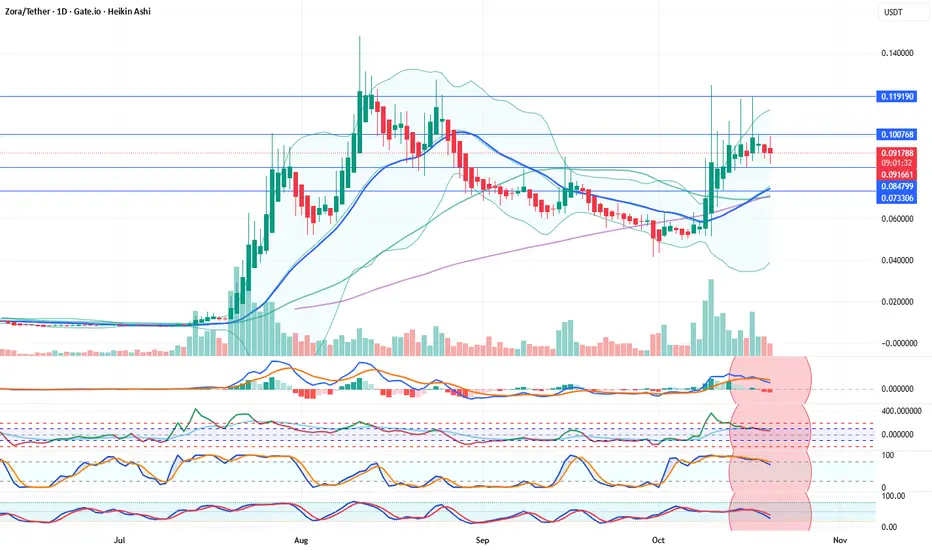
ZORA Coin indicators are currently in a negative condition. In the daily technical outlook, selling pressure is expected to continue. In a possible pullback, the 0.08479 support level will be monitored. If this level is broken downward, a decline toward the 21-day moving average (0.074807) may occur. If the price stabilizes around this average, it could create an opportunity for another upward move in the coming weeks. In a potential positive scenario, the 0.100768 resistance level is significant, and the price must break above it. Due to the negative indicators, our overall outlook for ZORA Coin remains bearish.
Resistance: 0,100768 - 0,119190
Support: 0,084799 - 0,73306
We’d appreciate it if you could boost our posts and share them on your social media. 🚀
Legal Disclaimer:
The information, comments, and recommendations contained herein do not constitute investment advice. Investment advisory services are provided only within the framework of an investment advisory agreement to be signed between the investor and authorized institutions such as brokerage firms, portfolio management companies, and non-deposit banks.
The opinions expressed here are personal views and may not be suitable for your financial situation, risk profile, or return preferences. Therefore, no investment decisions should be made based solely on the information and opinions presented on this page.
ZONAUSDT Coin Analysis and CommentaryZONAUSDT Coin Analysis and Commentary
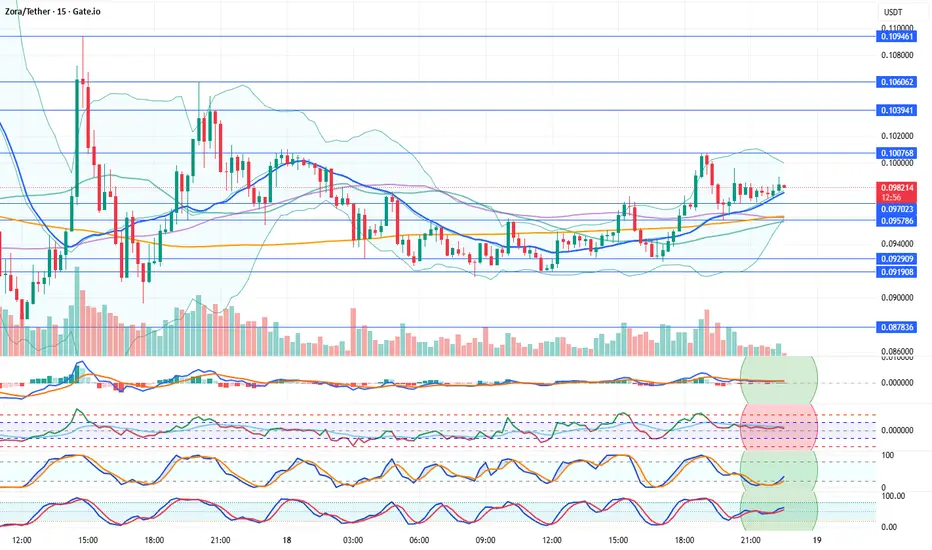
ZORA Coin has broken above its 21-hour moving average (0.097681) on the 15 min. technical chart. Indicators appear to have turned positive. If the support holds, upward price movements may occur.
Resistance: 0.103941 – 0.100768
Support: 0.097023 – 0.095786
We’d appreciate it if you could boost our posts and share them on your social media. 🚀
Legal Disclaimer:
The information, comments, and recommendations contained herein do not constitute investment advice. Investment advisory services are provided only within the framework of an investment advisory agreement to be signed between the investor and authorized institutions such as brokerage firms, portfolio management companies, and non-deposit banks.
The opinions expressed here are personal views and may not be suitable for your financial situation, risk profile, or return preferences. Therefore, no investment decisions should be made based solely on the information and opinions presented on this page.
ZORAUSDT Coin Analysis and CommentaryZONAUSDT Coin Analysis and Commentary
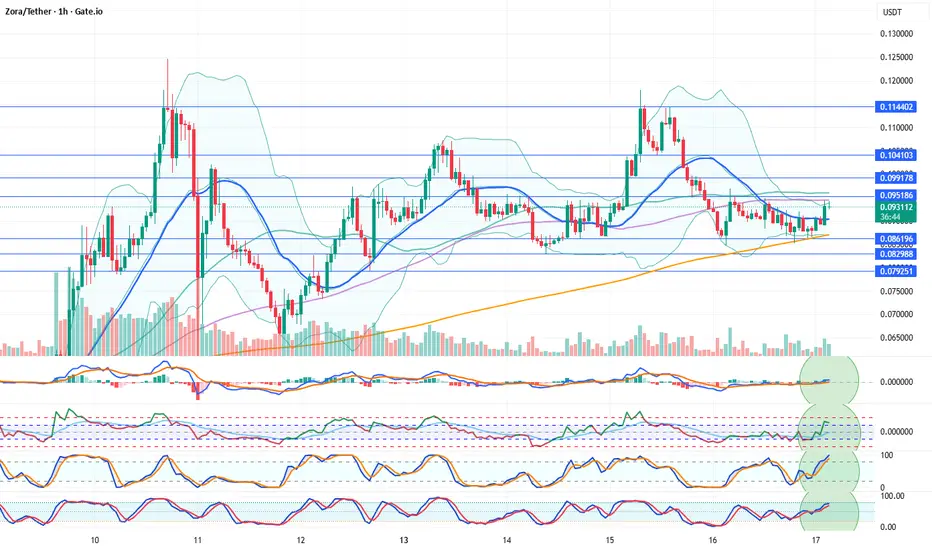
ZORA Coin has broken above its 21-hour moving average (0.090380) on the 1-hour technical chart. Indicators appear to have turned positive. If the support holds, upward price movements may occur.
Resistance: 0.095186 – 0.099178 – 0.104103 – 0.114402
Support: 0.086196 – 0.082988 – 0.079251
We’d appreciate it if you could boost our posts and share them on your social media. 🚀
Legal Disclaimer:
The information, comments, and recommendations contained herein do not constitute investment advice. Investment advisory services are provided only within the framework of an investment advisory agreement to be signed between the investor and authorized institutions such as brokerage firms, portfolio management companies, and non-deposit banks.
The opinions expressed here are personal views and may not be suitable for your financial situation, risk profile, or return preferences. Therefore, no investment decisions should be made based solely on the information and opinions presented on this page.
ZORAUSDT Coin Analysis and CommentaryZORAUSDT Coin Analysis and Commentary
Indicators for Zora Coin are currently negative. On the 15-minute technical chart, selling pressure is increasing. The coin has turned downward from the 0.106 resistance level, entering a negative phase. Additional selling may occur in the short term. In this situation, support levels will be closely monitored.
Resistances: 0.106062 – 0.109461
Supports: 0.099848 – 0.096459 – 0.091048 – 0.087836
We’d appreciate it if you could boost our posts and share them on your social media. 🚀
Legal Disclaimer:
The information, comments, and recommendations contained herein do not constitute investment advice. Investment advisory services are provided only within the framework of an investment advisory agreement to be signed between the investor and authorized institutions such as brokerage firms, portfolio management companies, and non-deposit banks.
The opinions expressed here are personal views and may not be suitable for your financial situation, risk profile, or return preferences. Therefore, no investment decisions should be made based solely on the information and opinions presented on this page.
Zora still looking strong despite the market dumpZORA is still looking strong, but without the rest of the market getting a turn around it will be difficult for Zora to sustain the move up, never mind continue. The current consolidation is symmetrical-triangular in nature; however, the strong wick sell pressure and the signs of divergence on momentum do not look good. Being defensive of any gains would be wise.
$ZORA — Rebound Loading?BYBIT:ZORAUSDT | 12h
After a sharp -12% flush, ZORA found temporary footing at $0.065, then bounced back toward $0.1072.
Bulls are actively defending this zone. A clean breakout above $0.107 could propel price toward $0.126, or even a retest of the $0.150 highs.
Momentum remains bullish above $0.060. We can expect some sideways movement between $0.060 and $0.107.
ZORAUSDT – Potential Continuation Ahead After Friday’s market carnage, ZORA has shown impressive resilience.
While many altcoins sold off sharply, ZORA managed to hold key structure and maintain its uptrend from last week.
Momentum is gradually returning, and the price action suggests a potential continuation move toward the 161.8% Fibonacci extension, provided volume remains elevated and market sentiment stabilizes.
Targets:
• 1️⃣ 127.2% fib extension → short-term resistance zone
• 2️⃣ 161.8% fib extension → main target if trend continues
Reminder: Manage your risk — volatility is still high after Friday’s flush.
Good luck and trade smart. 💪
Long trade
1Hr TF overview
Trade Journal Entry – ZORAUSDT.P (Zora Protocol)
Direction: Buyside
Date: Tuesday, 30th September 2025
Time: 4:00 PM
Session: NY → London PM
Timeframe: 1-hour
Trade Parameters
Entry: 0.04869
Profit Level: 0.09297 (+114.63%)
Stop Level: 0.04295 (−5.53%)
Risk–Reward Ratio (RR): 18.07
🔹Technical Breakdown
Market formed a downward channel structure before a decisive
liquidity sweep beneath prior NY & London lows.
🔹Volume delta confirmed capitulation with aggressive buy absorption
at the discount zone (0.045–0.047).
🔹Breaker block and FVG retracement (50–61.8%) confluence validated the buy entry.
🔹EMA alignment (50 > 200) indicated shift in short-term structure to bullish continuation.
🔹Volume spike at breakout candle (1H) confirmed institutional re-entry and short squeeze.
🔹Target achieved above prior range high around 0.090–0.093 zone, clearing resting liquidity.
15min TF overview
Fundamental Context (from Coingecko / Coinglass / CoinStats)
Price: $0.0856 (+52.8% 24h)
Market Cap: ≈ $384 M
Fully Diluted Valuation: ≈ $857 M
24h Trading Volume: ≈ $27 M
Circulating Supply: 4.47 B ZORA (Max 10 B)
Top Exchanges: Binance, Bybit, Bitget
Funding Flows: Net long bias ≈ +119% inflow (CoinGlass data).
Recent Catalyst: ZORA token listed on Robinhood and Binance, driving +50% daily surge.
Project Narrative
Zora was launched in 2020 as an Ethereum-based NFT auction protocol, evolving into a Web3 social platform where creators can mint, earn, and trade digital assets directly on-chain.
The ZORA token (ERC-20) powers network incentives, creator rewards, and protocol governance. Its strong community engagement and integration with Base Network (CoinStats source) underpin current momentum.
Sentiment & Momentum
Social engagement: Rising as ZORA trends on X (Twitter) and major NFT circles.
Market positioning: Post-listing accumulation phase transitioning to early expansion cycle.
Heatmap: Binance dominates >70% of volume — indicating institutional liquidity pools.
Bias: Bullish as long as 0.045–0.050 zone holds (re-accumulation area).
| Horizon | Projection | Notes
| --------------------- | ----------- | -------------------------------------------------------------------
| **1-Week** | 0.090–0.100 | Continuation toward upper liquidity pool
| **1-Month** | 0.120 | Expansion if NFT/creator narrative sustains
| **4-Month (Q1 2026)** | 0.145–0.160 | Potential rotation target if trend persists & macro -------------- crypto sentiment holds |
Summary Insight
This ZORAUSDT setup combined technical exhaustion, fundamental catalysts, and strong liquidity inflows. The trade represents an ideal confluence between smart money structure (breaker/FVG) and macro event catalyst (exchange listing + social traction).
ZORA/USDT Analysis. Long setup
The asset is consolidating near a key level. A strong volume spike and local selling absorption were detected. A breakout is expected, and if the price secures above resistance, the potential target lies near $0.074.
The most conservative entry would be on a retest and reaction from ~$0.057 (bid/ask imbalance).
This publication is not financial advice.
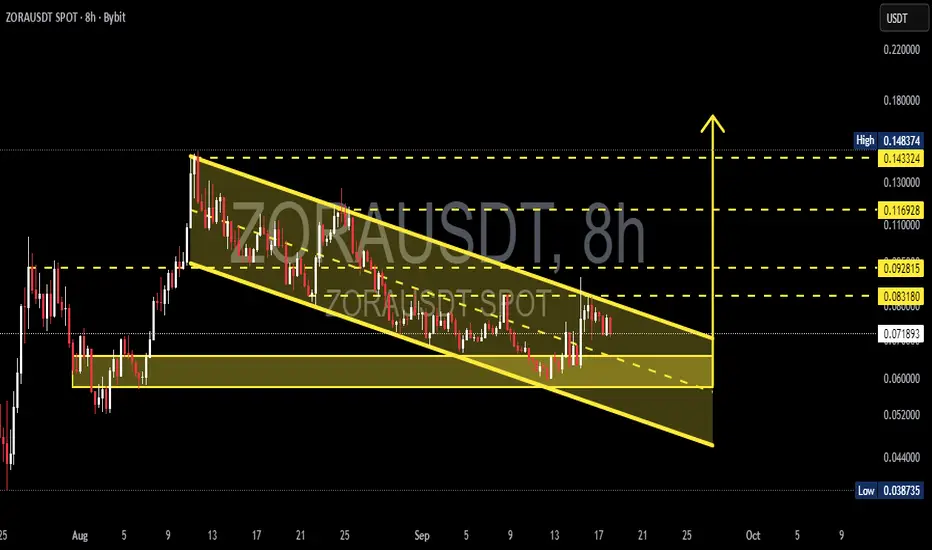
ZORA/USDT — Descending Channel Reaching Decision Point?Currently, ZORA/USDT is trading inside a well-defined descending channel, formed since the mid-August peak. The structure shows a sequence of lower highs and lower lows, reflecting mid-term bearish control. However, this pattern also resembles a falling wedge, which often signals a potential bullish reversal if a breakout occurs.
---
🔹 Technical Structure
Main Pattern: Descending channel (slightly converging, similar to a falling wedge).
Current Price: ~0.0719 USDT
Demand Zone: 0.055 – 0.062 (strong accumulation area tested multiple times).
Key Support: 0.0387 (chart low).
Resistance Levels:
0.0831 → first breakout trigger
0.0928 → next psychological resistance
0.1169 → mid-term target if momentum holds
0.1433 – 0.1483 → major resistance zone / previous rally high
---
🔹 Bullish Scenario
1. Price must close above the channel’s upper trendline and 0.0831 on the 8H timeframe.
2. A valid breakout should be confirmed with strong volume + successful retest of the upper channel as new support.
3. If confirmed, bullish targets are:
🎯 Target 1 → 0.0928
🎯 Target 2 → 0.1169
🎯 Target 3 → 0.1433 – 0.1483
📍 Note: A failed breakout (false breakout) could send price back into the channel.
---
🔹 Bearish Scenario
1. If price gets rejected at the upper channel or fails to close above 0.0831, downside pressure may return.
2. A strong breakdown below the demand zone (0.055–0.062) opens the path toward 0.0387.
3. Bearish outlook is invalidated if the price sustains above 0.0831 with confirmation.
---
🔹 Conclusion
ZORA/USDT is approaching a critical decision zone.
The descending channel structure provides two clear paths:
🚀 Bullish breakout above 0.0831 → upside targets 0.0928 – 0.1433.
📉 Breakdown below 0.055–0.062 → potential continuation toward 0.0387.
Key decision levels: 0.0831 (resistance) and 0.055–0.062 (support zone).
---
📢 Trading Notes
Always wait for 8H/1D candle close for confirmation before execution.
Risk management is crucial — never enter without a stop loss.
Descending channels often lead to explosive moves once a breakout is confirmed — be prepared.
---
ZORA/USDT is consolidating inside a descending channel. 0.0831 is the breakout trigger for a bullish reversal, while 0.055–0.062 remains the key demand zone. Breakout → targets 0.0928 – 0.1433. Breakdown → risk toward 0.0387. Watch candle close + volume for confirmation.
---
#ZORA #ZORAUSDT #Crypto #Altcoins #TechnicalAnalysis #TradingView #ChartPattern #Breakout #SupportResistance #PriceAction
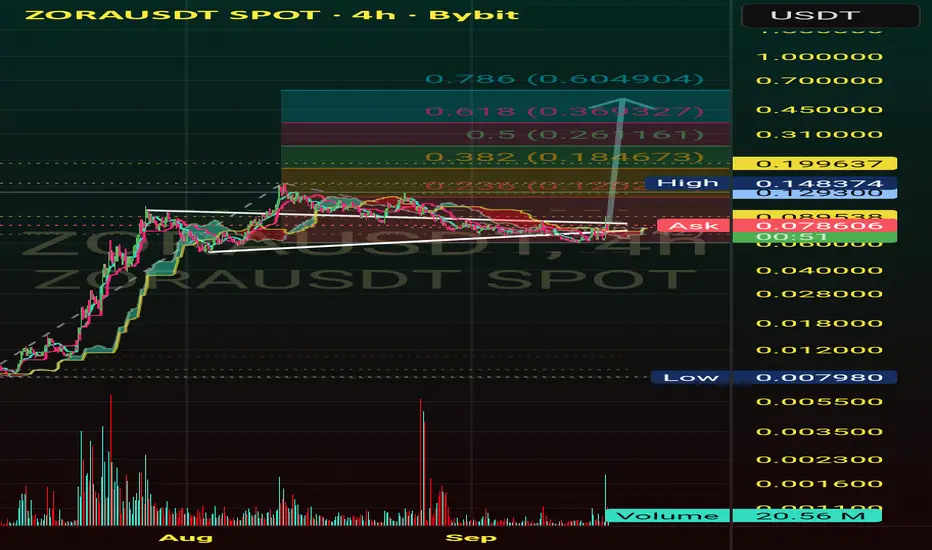
ZORAUSDT 12H#ZORA is moving within a descending channel on the 12H timeframe. Consider buying at the current price and near the support zone. If it breaks out above the channel resistance, the potential targets are:
🎯 $0.092253
🎯 $0.102969
🎯 $0.113685
🎯 $0.126943
🎯 $0.148374
⚠️ Always remember to use a tight stop-loss and follow proper risk management.