XMR (Monero) — Key Technical Levels | Is a Major Breakout Ahead?XMR (Monero) — Key Technical Levels | Is a Major Breakout Ahead?
Monero (XMR) is a privacy-focused cryptocurrency designed to provide secure, decentralized and confidential transactions. Unlike transparent blockchains, Monero uses advanced cryptographic technologies to protect transaction details, including sender, receiver and transaction amounts.
Fundamental Perspective
Monero remains one of the most established privacy-oriented cryptocurrencies, supported by its focus on financial privacy,
LayerZero/USD Tether Spot
No trades
No trades
In-depth trading ideas
ZROUSDT Chart: Expecting to see a drop herePrice is currently sitting around 1.86 USDT after tagging the 0.5 Fibonacci level and getting rejected right at the top of the descending channel.
We are still moving inside a clear macro downtrend channel that started forming back in October.
The projected path shows a rejection leading to a drop toward the lower trendline, with a potential deeper sweep into the 1.10 - 1.20 region before any real bottoming process begins.
Bias remains bearish unless price can reclaim and hold the 2.
#ZROUSDT Holding $1.16 Is Key to Bullish Continuation#ZRO
ZRO has been trading above the 200-day Moving Average (MA200) on the daily timeframe recently, representing a positive technical signal. This comes after the price successfully broke above the moving average and turned it from previous resistance into dynamic support, helping support price action and limit selling pressure.
The current technical setup becomes even more significant as the 200-day Moving Average coincides with an important horizontal support zone around $1.16. This level al
ZRO (LayerZero) — Key Technical Levels | Is a Major Move DevelopZRO (LayerZero) — Key Technical Levels | Is a Major Move Developing?
LayerZero (ZRO) is a blockchain interoperability protocol designed to connect different networks through secure cross-chain communication. Its technology enables decentralized applications to transfer data and assets across multiple blockchains.
Fundamental Perspective
LayerZero operates in the growing blockchain infrastructure, interoperability and tokenization sectors.
The project continues to expand its ecosystem, with i
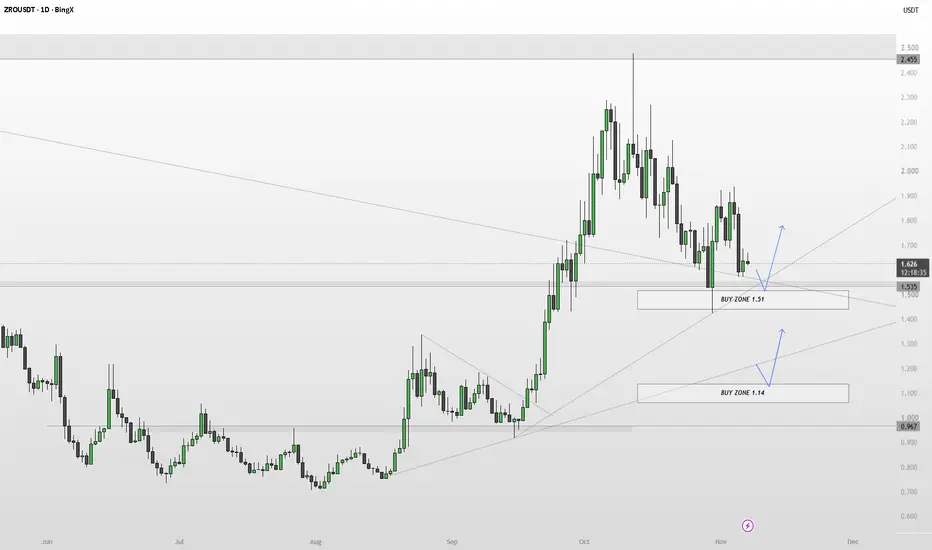
CRYPTO - $ZROZRO is currently trading around $1.62 after experiencing a significant correction from its recent high near $2.25. The daily chart shows a series of lower highs, indicating that selling pressure remains dominant in the short term.
I'm watching the first buy zone around $1.51, corresponding to the 61.8% Fibonacci retracement. This area also has confluence with the descending trendline and ascending support, making it an interesting location for a potential reaction.
If price sweeps this zone, w
HOW-TO: read Harmonic's Extreme Oversold on 4H, a ZRO exampleHarmonic Oscillator blends several momentum readings into one composite line from 0 to 100. When it closes a 4 hour candle at 15 or below, it prints Extreme Oversold. The tempting reading is "this is the bottom". We measured what the print actually told you.
What we measured
Every Extreme Oversold print on the 4 hour chart of 65 crypto perpetual futures on Bybit, April 2025 to October 2026: 731 of them. For each one: how far had price already dropped, and did the print candle's low hold for
ZROUSDT 1H | Bullish Divergence + Fibonacci Golden Zone# ZRO | Bullish Divergence + Fibonacci Golden Zone – Potential Long Opportunity
## Market Outlook
#ZRO is approaching an interesting potential buying zone on the 1-hour timeframe, where multiple technical factors are aligning to create a possible bullish reversal opportunity.
Price is currently trading around a key horizontal support level while forming a potential bullish divergence on the RSI. Additionally, the price is positioned within the Fibonacci Golden Zone (0.5–0.618), an area that t
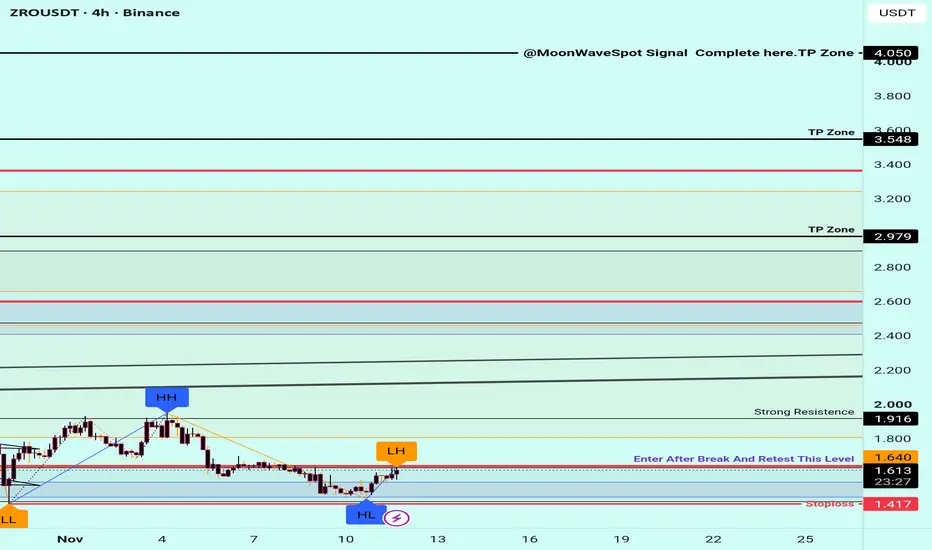
ZROUSDT Analyses-87, November 1, 2026Trade Journal | Bullish Breakout
BINANCE:ZROUSDT
What changed?
ZRO recovered from 1.460, broke the 1.775 resistance, and established a short-term bullish structure. The 4H chart also shows improving momentum.
Where did I enter?
My strategy's confirmation candle triggered a buy at 1.856, with the stop placed at 1.821.
What's the plan?
The primary target is 1.926 (R/R:2). Further upside levels are 1.951 and 2.050. Losing 1.821 invalidates the setup.
Maximum risk: 1%. Most profits are
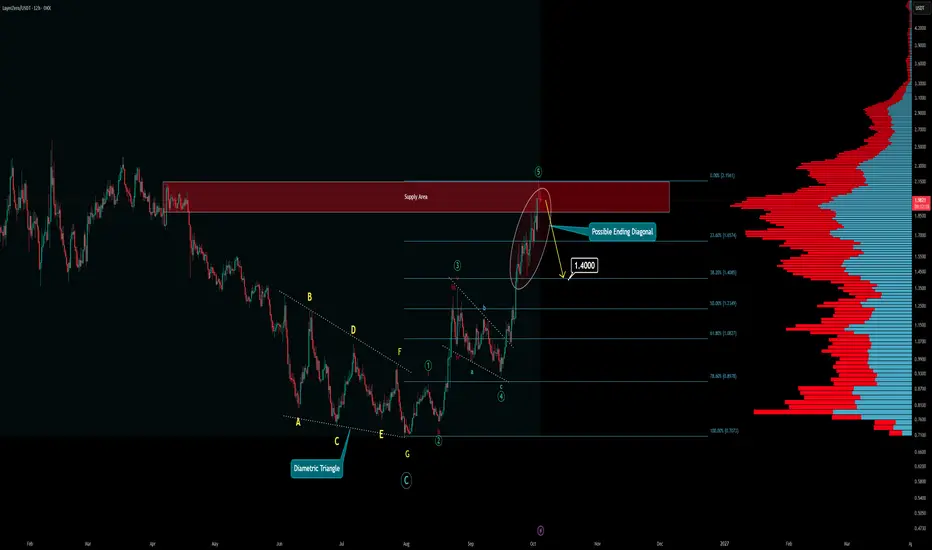
Wave Analysis - ZRO (Multi Time Frame)After a long deep dive, ZRO has finally created enough momentum for a fresh new trend.
Examine what happened before to understand what may happen next:
In the main chart (12H), there is a pattern known as a "Diametric." This pattern sometimes forms instead of a classic Ending Diagonal. Ending Diagonals strictly consist of 5 legs, but this one decided to extend sideways and formed a 7-leg structure. According to NEoWave Principles, this is classified as a Diametric.
Why does it matter? Well, th
ZROUSDT Forming Bearish BreakdownZROUSDT has confirmed a clean bearish breakdown on the daily timeframe after losing its local horizontal support shelf. Following a sharp distribution phase from recent highs, price action carved out a series of lower highs and pushed directly through the shaded support band. Rather than seeing any meaningful buying response, consecutive red candles confirmed the breakdown, effectively converting this former floor into fresh overhead resistance. With structural support lost, the chart's measured
HOW-TO: size a SuperTrend flip. Typical run BTC 2.9%, ZRO 12.6%SuperTrend is one of the ten systems in OmniDeck. It flips when price closes through a band set by ATR, the coin's normal candle size. OmniDeck runs three bands, at 2, 3 and 4 ATR, and flips when two of the three agree. A flip says the trend changed side. It doesn't say how far the move will go, so we measured that.
What we measured
Every SuperTrend flip on the 4 hour chart of 44 crypto perpetual futures on Bybit, 14 October 2025 to 25 October 2026, that was later followed by an opposite fli
ZROUSDT
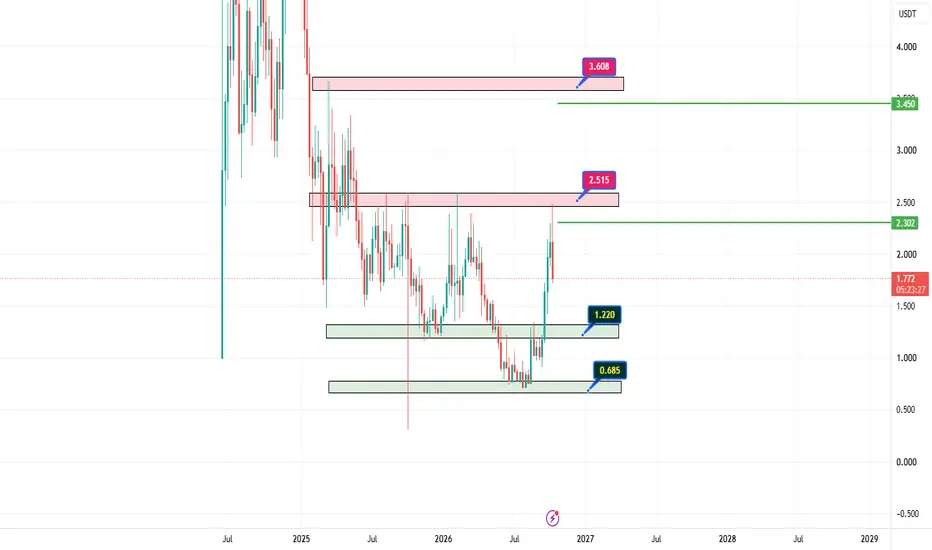
On the weekly timeframe, ZRO reacted to a static resistance zone and underwent a relatively healthy correction following a solid bullish move.
The first support zone to watch is around **$1.22**. As long as this support holds and the price remains above it, ZRO could continue its uptrend toward the previously identified targets.
**Disclaimer:** This is my personal market outlook, not financial advice. Always do your own research before making any trading decisions.
ZRO/USDT 4H: Head and Shoulders Short Setup Into Oct 20 UnlockZRO has formed a clear head and shoulders on the 4H chart, and price is now rolling over from the right shoulder.
📉 Plan (short)
• Entry: sell stop at 1.797, on a confirmed break below the support / neckline zone
• Stop loss: 2.057, above the right shoulder supply
• Target: 1.518, the measured move of the pattern, near the demand block
⚠️ Context
A token unlock of about 6.4% of market cap is scheduled for Oct 20, after a roughly 90% run in 30 days. Pumps before unlocks often fade. Risk to rewa
ZRO at Critical Resistance — Breakout or Another Rejection?LayerZero ( CSE:ZRO ) previously experienced a prolonged downtrend, forming a Descending Channel, a pattern in which price moves between two relatively parallel downward-sloping trendlines.
🔴 Upper Resistance: The descending red trendline connecting a series of lower highs. This area acts as dynamic resistance that price needs to break above to confirm a potential trend reversal.
🟢 Middle Trendline: The green trendline represents the central path of price movement within the channel. It can se
HOW-TO: tell whether a break above last week's high will holdA coin closes above last week's high. Is that a breakout, or a spike that will be back under the line by tomorrow? We measured it on the 50 most traded crypto coins on Bybit, over two separate years, and one number separated the two: how far the close landed above the line.
What we measured
Janus Atlas draws last week's high on the chart as pwH. We took every week, on all 50 coins, that opened below last week's high, and found the first 1 hour close above it. Then we checked one thing: was t
LayerZero (ZRO) enters the bullish zone (PP: 200%-650% mid-term)ZROUSDT (LayerZero) just entered the bullish zone this week. The low from November-December 2025 has been regained. Candle closure is needed for this signal to be true but the week is really young. We can count with a positive result.
How are you feeling today, still enjoying some sort of summer vacations?
Lucky you, the time is right to trade.
We are seeing good movement but not much. Yes, Bitcoin is moving but it takes a while before the energy flows from the big projects to the smaller one
ZRO Breakout: Wait for the Pullback Before the Next MoveAfter a strong move, ZRO entered a corrective phase and eventually formed a clear falling wedge. The correction is now broken to the upside, and the bullish structure is starting to continue.
The key point here is not to chase the current move. ZRO has already broken several resistance levels, so I would prefer to see a pullback into the marked support zone and confirmation from price action before taking new risk.
Setup:
Wait for ZRO to pull back into the 1.36–1.49 support zone, then loo
$ZRO PRICE PREDICTION: 20-MONTH DOWNTREND BREAKING, TARGET $15?CSE:ZRO PRICE PREDICTION: 20-MONTH DOWNTREND BREAKING, NEXT TARGET $15?
#ZRO crashed 90% from its December 2024 ATH of $7.47 to the 2026 low of $0.707. It has since rallied more than 150%, and ZRO is now breaking out of a major weekly trendline that has held for 20 months.
ZRO TECHNICAL ANALYSIS (1W):
✅ Liquidity swept at the $0.70 cycle low
✅ First HTF Change of Character since the ATH
✅ Price breaking the 20-month descending trendline
✅ A weekly close above the trendline confirms the breako
ZRO: through a level, on heavy volumeZRO closed the 30 Sep 10:00 (Rome) 4H bar at 1.795, a second close above a level it had just broken, with episode volume at 4.18 times the median.
I read this as acceptance above that level, not a price target and not a buy signal. Price has since given back part of the move toward the level, so the reading still stands but with less room. My dataset has no on-chain coverage for ZRO, so this note leans on the indicator alone.
What would prove me wrong: ZRO falls back under 1.712, just below th
ZRO UPDATE NEW....Đây là bài đăng ngắn gọn bằng tiếng Anh, bạn copy dán vào TradingView:
Title: ZROUSDT – One More Push to 1.80, Then a Deep Pullback?
Description:
ZRO has rallied strongly from the 0.70 zone, breaking above the 1.216–1.257 resistance and holding well above EMA21 (1.188) on the daily chart. The 1.606 target from the previous setup has been hit.
My scenario:
Price may make one final push toward 1.75–1.80 to sweep liquidity above the recent high.
After that, I expect exhaustion and a strong rev
ZRO will drop to -80% As I wrote today in the main market plan, in my opinion, most of the current growth impulses are not the start of a trend and are false. In this regard, I want to look at individual coins that are showing growth.
In particular, for ZRO, the current growth wave is not the start of a trend. Against the backdrop of an attempt to reverse the trend, Binance announced support for the rebranding of STG to ZRO, which triggered speculative activity. Technically, the growth potential has been exhausted s
ZRO 1D PLANT NEXT 2 MONTHZRO/USDT — Short-Term Pullback, Long-Term Growth
1D · Binance | Current Price: 1.102 USDT (+1.19%) | EMA21: 0.924 | EMA50: 0.897
Main Thesis
After a prolonged decline of nearly 65% from a high near 2.0 down to a low around the 0.7–0.8 zone, ZRO just printed a strong reversal candle, pushing price decisively through both EMA21 and EMA50 in a single session. This marks the first time since the downtrend began that EMA21 has crossed above EMA50 — the first golden cross on the daily timeframe.
H
ZRO at a Critical Turning Point — Breakout or Rejection?📊 Technical Analysis
💵 Coin: CSE:ZRO / USDT
⏳ Time Frame: 5D
📐 Pattern: Descending Channel
💰 Current Price: ~1.138 USDT
🔴 Major Resistance: 1.225 USDT
🟢 Immediate Breakout Level: 1.225 USDT
🎯 Upside Potential: 10%+ if the breakout is confirmed
📐 Pattern Explanation — Descending Channel
ZRO has been moving inside a long-term Descending Channel, characterized by a series of lower highs and lower lows.
🔴 The upper red trendline acts as dynamic resistance, repeatedly rejecting price dur