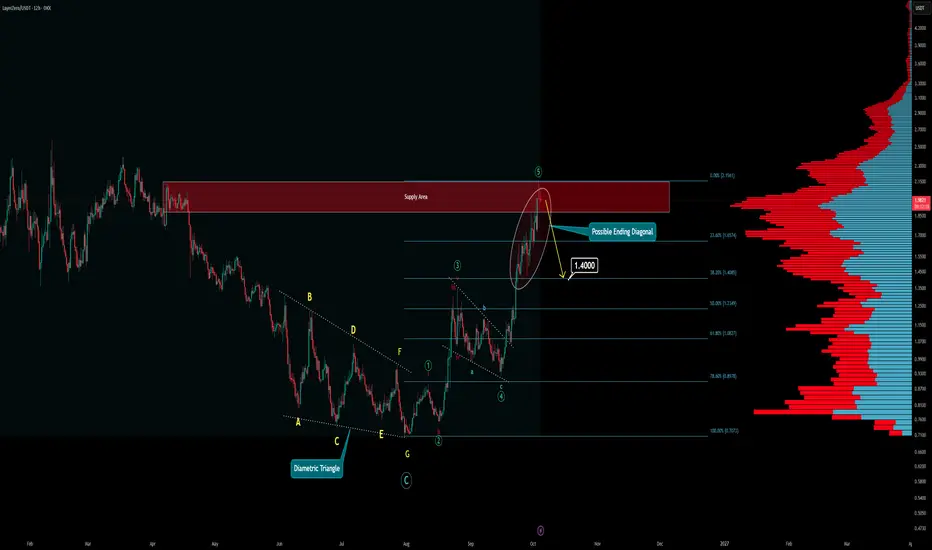
Wave Analysis - ZRO (Multi Time Frame)After a long deep dive, ZRO has finally created enough momentum for a fresh new trend.
Examine what happened before to understand what may happen next:
In the main chart (12H), there is a pattern known as a "Diametric." This pattern sometimes forms instead of a classic Ending Diagonal. Ending Diagonals strictly consist of 5 legs, but this one decided to extend sideways and formed a 7-leg structure. According to NEoWave Principles, this is classified as a Diametric.
Why does it matter? Well, th
In-depth trading ideas
ZRO will drop to -80% As I wrote today in the main market plan, in my opinion, most of the current growth impulses are not the start of a trend and are false. In this regard, I want to look at individual coins that are showing growth.
In particular, for ZRO, the current growth wave is not the start of a trend. Against the backdrop of an attempt to reverse the trend, Binance announced support for the rebranding of STG to ZRO, which triggered speculative activity. Technically, the growth potential has been exhausted s
$ZRO PRICE PREDICTION: 20-MONTH DOWNTREND BREAKING, TARGET $15?CSE:ZRO PRICE PREDICTION: 20-MONTH DOWNTREND BREAKING, NEXT TARGET $15?
#ZRO crashed 90% from its December 2024 ATH of $7.47 to the 2026 low of $0.707. It has since rallied more than 150%, and ZRO is now breaking out of a major weekly trendline that has held for 20 months.
ZRO TECHNICAL ANALYSIS (1W):
✅ Liquidity swept at the $0.70 cycle low
✅ First HTF Change of Character since the ATH
✅ Price breaking the 20-month descending trendline
✅ A weekly close above the trendline confirms the breako
ZRO: through a level, on heavy volumeZRO closed the 30 Sep 10:00 (Rome) 4H bar at 1.795, a second close above a level it had just broken, with episode volume at 4.18 times the median.
I read this as acceptance above that level, not a price target and not a buy signal. Price has since given back part of the move toward the level, so the reading still stands but with less room. My dataset has no on-chain coverage for ZRO, so this note leans on the indicator alone.
What would prove me wrong: ZRO falls back under 1.712, just below th
ZRO Breakout: Wait for the Pullback Before the Next MoveAfter a strong move, ZRO entered a corrective phase and eventually formed a clear falling wedge. The correction is now broken to the upside, and the bullish structure is starting to continue.
The key point here is not to chase the current move. ZRO has already broken several resistance levels, so I would prefer to see a pullback into the marked support zone and confirmation from price action before taking new risk.
Setup:
Wait for ZRO to pull back into the 1.36–1.49 support zone, then loo
ZRO UPDATE NEW....Đây là bài đăng ngắn gọn bằng tiếng Anh, bạn copy dán vào TradingView:
Title: ZROUSDT – One More Push to 1.80, Then a Deep Pullback?
Description:
ZRO has rallied strongly from the 0.70 zone, breaking above the 1.216–1.257 resistance and holding well above EMA21 (1.188) on the daily chart. The 1.606 target from the previous setup has been hit.
My scenario:
Price may make one final push toward 1.75–1.80 to sweep liquidity above the recent high.
After that, I expect exhaustion and a strong rev
#ZROUSDT is currently strongly bullish#ZRO
The price is moving within a descending channel on the 1-hour timeframe and has reached the lower boundary. It is now poised for a bounce and is expected to retest this boundary.
The Relative Strength Index (RSI) indicates a downward trend, which is likely to continue given the overbought conditions.
There is a key support zone in green at 0.8654, and the price has bounced off this zone several times, making it a strong support level.
The price is trending towards the 100-period moving
ZRO 1D PLANT NEXT 2 MONTHZRO/USDT — Short-Term Pullback, Long-Term Growth
1D · Binance | Current Price: 1.102 USDT (+1.19%) | EMA21: 0.924 | EMA50: 0.897
Main Thesis
After a prolonged decline of nearly 65% from a high near 2.0 down to a low around the 0.7–0.8 zone, ZRO just printed a strong reversal candle, pushing price decisively through both EMA21 and EMA50 in a single session. This marks the first time since the downtrend began that EMA21 has crossed above EMA50 — the first golden cross on the daily timeframe.
H
ZRO at a Critical Turning Point — Breakout or Rejection?📊 Technical Analysis
💵 Coin: CSE:ZRO / USDT
⏳ Time Frame: 5D
📐 Pattern: Descending Channel
💰 Current Price: ~1.138 USDT
🔴 Major Resistance: 1.225 USDT
🟢 Immediate Breakout Level: 1.225 USDT
🎯 Upside Potential: 10%+ if the breakout is confirmed
📐 Pattern Explanation — Descending Channel
ZRO has been moving inside a long-term Descending Channel, characterized by a series of lower highs and lower lows.
🔴 The upper red trendline acts as dynamic resistance, repeatedly rejecting price dur
ZROUSDT - Trade Analysis (M15 Entry / Daily Bias)Daily Context: Price formed a confirmed bullish divergence at the lows (RSI made higher low while price made lower low, clearly marked on chart). This triggered an accumulation phase between 1.0080 and 1.1163. Price has now broken out of that accumulation zone with strong momentum and volume (16.57M on the breakout candle). Daily Alligator lines are beginning to fan upward. Daily resistance zone sits at 1.3800-1.4000, which is the next major target.
4Hr and 1Hr also Bullish.
M15 Bias: Bullish.
#ZROUSDT is currently strongly bullish#ZRO
The price is moving within a descending channel on the 1-hour timeframe and has reached the lower boundary. It is now poised for a bounce and is expected to retest this boundary.
The Relative Strength Index (RSI) indicates a downward trend, which is likely to continue given the overbought conditions.
There is a key support zone in green at 0.8600, and the price has bounced off this zone several times, making it a strong support level.
The price is trending towards the 100-period moving
$ZRO | 1H | BUY SETUP |Hey traders 👋
What are your thoughts on BINANCE:ZROUSDT here — is this recovery ready to keep running?
The chart is showing a bullish recovery reaction into a demand zone. After pulling back, price found buyers around the $1.159–$1.144 order block, and that kind of sharp bounce off a demand area usually points to real buying interest stepping in rather than just noise.
The key level here is $1.159. This sits right at the top of the order block and marks the entry zone, making it the line th
#ZROUSDT is currently strongly bullish#ZRO
The price is moving within a descending channel on the 1-hour timeframe and has reached the lower boundary. It is now poised for a bounce and is expected to retest this boundary.
The Relative Strength Index (RSI) indicates a downward trend, which is likely to continue given the overbought conditions.
There is a key support zone in green at 0.8418, and the price has bounced off this zone several times, making it a strong support level.
The price is trending towards the 100-period moving
LayerZero (ZRO) enters the bullish zone (PP: 200%-650% mid-term)ZROUSDT (LayerZero) just entered the bullish zone this week. The low from November-December 2025 has been regained. Candle closure is needed for this signal to be true but the week is really young. We can count with a positive result.
How are you feeling today, still enjoying some sort of summer vacations?
Lucky you, the time is right to trade.
We are seeing good movement but not much. Yes, Bitcoin is moving but it takes a while before the energy flows from the big projects to the smaller one
ZRO Surges on Technical BreakoutCSE:ZRO A malicious actor exploited a vulnerability in The Sandbox’s SAND token bridge on the Base network, which utilizes LayerZero's infrastructure. The attacker minted approximately 14.9 billion unbacked BCBA:SAND tokens, though the actual extracted value was about $675,000. The Sandbox team contained the incident by disabling bridges and isolating affected networks. This follows other 2026 breaches involving LayerZero-powered bridges. This is bearish for LayerZero's perception because it
ZRO/USDT H1: Testing the upper boundary of the range🎯 TP1: $0.876135 (+1.29%) │ TP2: $0.864669 (+2.58%)
🛑 SL: $0.908446 (-2.35%) │ R/R: 1 : 1.1
⚠️ SL is placed beyond the nearest candle tails to reduce the risk of accidental stop-outs.
FUNDAMENTAL BACKGROUND
ZRO is trading without its own catalysts—there are no recent project updates. The asset is moving in line with the broader crypto market, where BTC and ETH show moderate recovery. The Fear & Greed Index at 60 indicates neutral-greedy sentiment but no overheating. The Federal Reserve (FOMC) M
ZRO is sitting at a key decision point after months of persistePrice is attempting to build a base along major support, but the broader structure is still bearish with ZRO trading below its key moving averages. The recent rejection also shows buyers haven't fully regained control yet.
What makes this interesting is the Synergy Signal. Momentum is forming a clear bullish divergence, with the oscillator producing higher lows while price continues to struggle near the lows. That suggests bearish momentum may be weakening.
There is also a large volume node di
#ZROUSDT may continue its trend after correction#ZRO
The price is moving within a descending channel on the 1-hour timeframe and has reached the lower boundary, heading towards a breakout. A retest of this boundary is expected.
The Relative Strength Index (RSI) indicates a downward trend, and this trend is likely to continue due to the overbought condition.
There is a key resistance zone (in green) at 0.9100, which the price has bounced off several times, making it a strong support level.
A consolidation trend is observed above the 100-pe
ZRO LONG — 12H ALMA Re-entry (WR 78% · avg RR 2.2)█ SETUP
BINANCE:ZROUSDT · 12H · long only.
(Context: LayerZero — cross-chain / omnichain messaging beta; trades with alt liquidity and bridge-narrative flows.)
ALMA Averaging Strategy: ALMA 3 / σ2, SD band 2, min diff 6 bars to add / 3 bars to exit, 25% per bar, up to 4 adds, hard stop −10% from average entry.
Strategy Tester (ZRO 12H):
Win rate 78% · profit factor 3.4 · max drawdown 5%
Avg winning trade +21.9% · avg losing trade −9.8%
Typical hold ~16×12H bars on winners — infra / brid
#ZROUSDT is currently strongly bullish#ZRO
The price is moving within a descending channel on the 1-hour timeframe and has reached the lower boundary. It is now poised for a bounce and is expected to retest this boundary.
The Relative Strength Index (RSI) indicates a downward trend, which is likely to continue given the overbought conditions.
There is a key support zone in green at 0.6889, and the price has bounced off this zone several times, making it a strong support level.
The price is trending towards the 100-period moving