#ZROUSDT 1D#ZRO has broken above the wedge resistance on the daily timeframe and is now testing the 50-day EMA. A confirmed breakout above the EMA could trigger a bullish move toward the following upside targets:
🎯 $0.972
🎯 $1.105
🎯 $1.213
🎯 $1.321
🎯 $1.474
🎯 $1.669
⚠️ Always use a tight stop-loss and apply proper risk management.
In-depth trading ideas
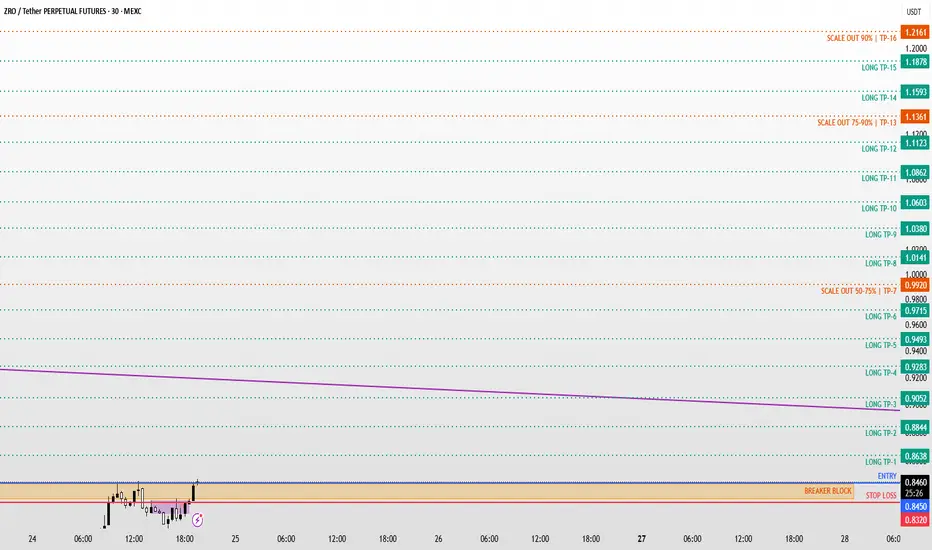
ZRO / ZROUSDT Long Setup | Breaker Block ReclaimMARKET ANALYSIS
ZRO is currently reacting from a key technical area highlighted on the chart.
As long as the protected support zone remains intact, the bullish market structure remains valid and higher liquidity targets may continue to attract price action.
A breakdown below the invalidation level would weaken the current bullish scenario and require a reassessment of market conditions.
📍 Entry, Stop Loss and Take Profit levels are marked directly on the chart.
━━━━━━━━━━━━━━
⚠️ DISCLAIMER
This publication is provided solely for educational and market observation purposes.
Nothing contained in this analysis should be considered financial advice, investment advice, or a recommendation to buy or sell any financial instrument.
All trading and investment decisions remain solely the responsibility of the individual trader.
Always conduct your own research and apply proper risk management before entering any position.
━━━━━━━━━━━━━━
🎯 PARALOG
▪️Crypto Market Analysis
▪️BTC Futures Signals
▪️Bitcoin & Altcoin Market Analysis
Precision • Momentum • Timing
━━━━━━━━━━━━━━
Exchange: #MEXC Futures
#bitcoin #btc #crypto #futures #technicalanalysis
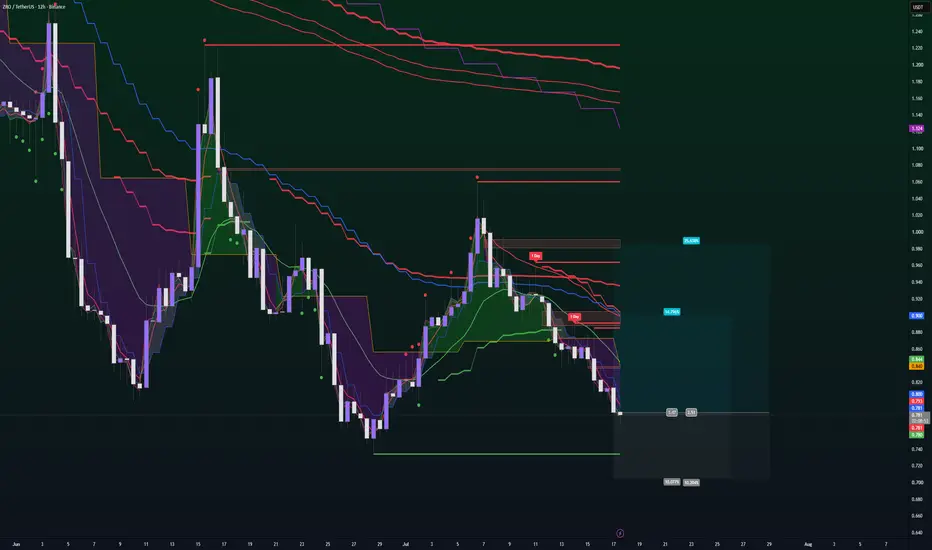
ZRO LONG — 12H ALMA Setup (WR 78%)█ SETUP
BINANCE:ZROUSDT · 12H · long only.
(Context: LayerZero — cross-chain / infra beta; trades with alt liquidity and bridge-narrative flows.)
ALMA Averaging Strategy: ALMA 3 / σ2, SD band 2, min diff 6 bars to add / 3 bars to exit, 25% per bar, up to 4 adds, hard stop −10% from average entry.
Strategy Tester (ZRO 12H):
Win rate 78% · profit factor 3.4 · max drawdown 13%
Avg winning trade +21.9% · avg losing trade −9.8%
Typical hold ~19×12H bars on winners — infra / bridge mean-reversion grid · 40-trade sample
═
█ WHY NOW
Friday 12-hour cluster — two ALMA long lots on the same 78% WR template:
· 17 Jul 00:00 UTC ~ $0.813
· 17 Jul 12:00 UTC ~ $0.784 (second add · pyramid 2 of 4)
Working blend ~ $0.7985 . Bar-close scale-in into the BTC risk-off wash — not a discretionary LayerZero roadmap trade.
Hard stop zone −10% from blended average ~ $0.719 . Exits follow Pine ALMA flip + min diff or the hard stop.
═
█ MACRO
Sector: ZRO = LayerZero omnichain messaging / OFT rails — beta to bridge volume, alt liquidity, and interoperability share vs Chainlink CCIP / Wormhole / Axelar.
Fundamental (30d → 18 Jul): Partnerships still Bid — Robinhood Chain named LayerZero as native cross-chain bridge (01–02 Jul · ZRO +~10% 24h); 14 Jul LayerZero Labs joins Linux Foundation x402 as General Member (AI-agent payments). Competitive overhang: >$7.2B announced migrations LayerZero → Chainlink CCIP since May · Mantle Super Portal (~$2.5B MNT) OFT→CCT Jul 9–15. Reputation tape: Bonzo/Hedera exploit loot bridged via LayerZero (11 Jul · not a protocol bug) · Executor-wallet scare then clarified as routine ops (15 Jul). Supply: ~25.71M ZRO unlock ~20 Jul (~2.6% supply · ~$24M notional). Price path in window: ~$0.735 (28 Jun) → ~$1.01 early Jul → ~$0.78–0.81 into fills.
Tape (17 Jul): Bitcoin under ~$62.5K on Iran / US-equities pressure — alt/infra beta soft with BTC; unlock day is still ahead of the fill cluster.
Window read: mixed — Robinhood + x402 +, CCIP exodus + unlock + security headlines + macro beta −.
Execution is 12H ALMA at the ~$0.78–0.81 cluster — not a roadmap, migration, or unlock forecast.
═
█ OUTLOOK
Positive factors
- 78% WR · PF 3.4 · avg win +21.9% vs avg loss −9.8% · ~19×12H bars — solid payoff skew in a 40-trade sample
- Fresh twin adds inside the 24h window on the same Averaging template
- Fundamental — partnership stack: Robinhood Chain native-bridge narrative + x402 Foundation membership keep the long-cycle infra story alive under the wash
- ALMA — 4H / 1D stretch below: 4H Signal SHORT · S:4 vs SAvg:3.5 · OVERHEAT-S · 1D Signal SHORT · S:10 vs SAvg:4.0 · OVERHEAT-S — time stretched below the band into the add (mean-reversion fuel)
- EMA — below-session stretch: 1H Below · 1H Cur S:49 vs Avg S:6.5 · +1.4% dev · 4H Below · 4H Cur S:36 vs Avg S:13.5 · +7.7% · 3D Below · 3D Cur S:31 vs Avg S:9.8 · +42% — sell-time overheated on the execution ladder
- SMC — demand at the add: 4H FVG Raid Bull ~ $0.784 (17 Jul) — bid-side tag on the second fill print
- 1W EMA deep Below: 1W Cur S:109 · +115% stretch — slow mean still far overhead; discount context for the 12H grid
Negative factors
- Fundamental — CCIP share loss: >$7.2B migrations to Chainlink · Mantle portal exit — market-share / OFT narrative headwind into any bounce
- Supply calendar: ~25.71M ZRO unlock ~20 Jul (~2.6% supply) sits inside a typical ~19×12H hold — vesting overhang before “Zero” L1 narrative (fall 2026)
- Reputation tape: Hedera loot routed via LayerZero + mid-Jul Executor scare (later clarified) keep bridge-risk headlines sticky
- ALMA — slow grids not fully stretched: 3D Signal SHORT · S:3 vs SAvg:4.1 — young below-session on the 3D clock; bounce may not be mature there
- EMA — daily below still young vs average: 1D Below · 1D Cur S:9 vs Avg S:13.8 · +13.9% — daily sell-time not overheated yet; downside can extend before mean-reversion completes
- SMC — daily bull FVG referenced higher: 1D FVG Enter Bull ~ $0.821 — demand pocket sits above spot; reclaim needed for a clean expansion
- PA: HTF bear FVG formed + fractal low broken — two-way housekeeping, not a clean one-way reclaim
- 12H bars can gap on geo / BTC headline risk — stop slippage on BINANCE spot
- Past backtest ≠ live fills; 40-trade sample is thin vs large-cap equity templates
Takeaway: the 12H ALMA strategy and 78% WR skew support the long into a stretched 4H/1D short-phase band, and Robinhood/x402 keep a constructive partnership floor — but CCIP exodus, the ~20 Jul unlock, young 1D/3D below-sessions, and weekly bear OB near ~$0.775 cap upside — net read is a strategy-backed mean-reversion grind into a mixed fund + risk-off window, not a clean multi-TF reclaim; nominal risk stays on the −10% hard stop / Pine exit path.
Base case: 12H ALMA holds · 4H/1D OVERHEAT-S mean-reverts · drift toward the ~$0.82 daily FVG shelf if alt-beta stabilises with BTC after the unlock print.
Bear case: fail 12H ALMA · unlock / CCIP headlines extend · weekly bear OB ~$0.775 reasserts · −10% from ~$0.7985 blend toward ~$0.719 · BTC geo headline whipsaw through the spot book.
Chart: BINANCE:ZROUSDT 12H — ALMA Averaging Strategy.
Educational idea. Live position — past backtest ≠ future results. NFA.
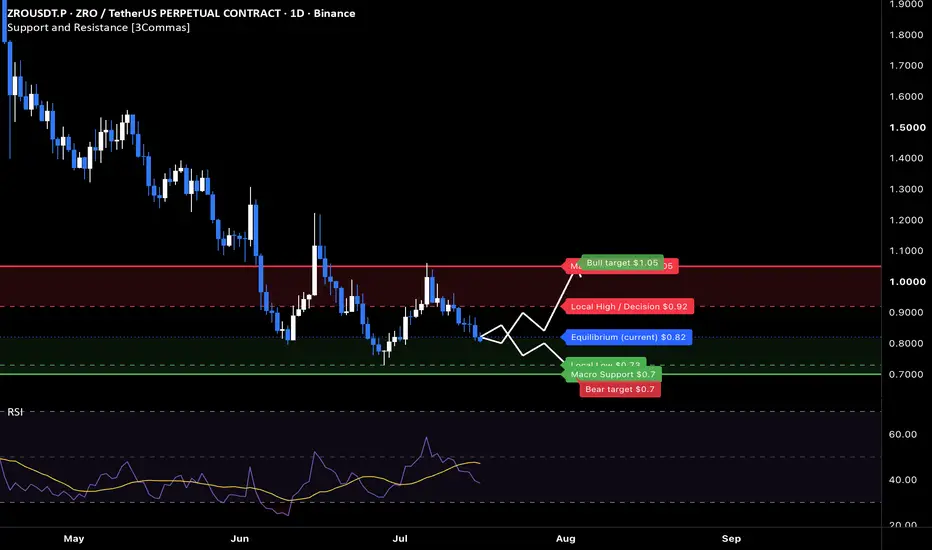
ZRO: liquidity sweep before the next leg downThe Macro Picture 🗺️
ZRO has been in a controlled downtrend since the $1.90 May top — a clean staircase of lower highs and lower lows. The July bounce topped at $1.05 (another lower high) and price is already rolling back over toward $0.82, with RSI failing under 50 and turning down. Structure still favors the sellers.
The Setup ⚙️
The Lower High 🔴
$0.92–1.05 is the supply band that keeps rejecting price. Until buyers reclaim it on a daily close, every rally into this zone is a fresh short opportunity, not a trend change.
The Breakdown Path 📉
Losing the $0.82 equilibrium puts the $0.73 June low back in play. A sweep of that low — where late longs pile their stops — is the liquidity the next leg down is likely to hunt.
The Roadmap 🛣️
Reject at $0.92 → lose $0.82 → flush the $0.73 low → extend toward $0.70. Invalidation is a clean daily close back above $0.92 — that breaks the lower-high sequence.
More setups in profile.
#ZRO #LayerZero #crypto #trading #TA #3Commas
#ZROUSDT is currently strongly bullish#ZRO
The price is moving within a descending channel on the 1-hour timeframe and has reached the lower boundary. It is now poised for a bounce and is expected to retest this boundary.
The Relative Strength Index (RSI) indicates a downward trend, which is likely to continue given the overbought conditions.
There is a key support zone in green at 0.7842. The price has bounced off this zone several times, making it a strong support level.
The price is trending towards the 100-period moving average, which we are approaching. This trend supports an upward move.
Entry Price: 0.8610
Target 1: 0.8751
Target 2: 0.8998
Target 3: 0.9321
Stop Loss: At the resistance zone in green
Remember this simple rule: Money management.
Any questions? Please leave a comment.
Thank you.
#ZROUSDT is currently strongly bullish#ZRO
The price is moving within a descending channel on the 1-hour timeframe and has reached the lower boundary. It is now poised for a bounce and is expected to retest this boundary.
The Relative Strength Index (RSI) indicates a downward trend, which is likely to continue given the overbought conditions.
There is a key support zone (in green) at 0.750. The price has bounced off this zone several times, making it a strong support level.
The price is trending towards the 100-period moving average, which we are approaching. This trend supports an upward move.
Entry Price: 0.0875
Target 1: 0.900
Target 2: 0.940
Target 3: 0.986
Stop Loss: At the resistance zone (in green)
Remember this simple rule: Money management.
Any questions? Please leave a comment.
Thank you.
ZRO LONG — 12H ALMA Setup (WR 83%)█ SETUP
LayerZero · BINANCE:ZROUSDT · 12H · long only.
ALMA Averaging Strategy: ALMA 3 / σ2, SD band 2, min diff 6 bar to add / 3 bar to exit, 25% per bar, up to 4 adds, hard stop −10% from average entry.
Strategy Tester (ZRO 12H):
Win rate 83% · profit factor 5.2 · max drawdown 5%
Avg winning trade +23.0% · avg losing trade −8.8%
Typical hold ~19 bars on winners · 30 trades in sample
Infrastructure / L2 beta — high avg win vs tight max DD in tester
█ WHY NOW
Sunday–Monday 12-hour cluster — two ALMA long lots on the same 83% WR template:
· 29 Jun 00:00 UTC ~ $0.776
· 29 Jun 12:00 UTC ~ $0.764 (second add on the next 12H bar)
Working blend ~ $0.770 ; mark ~ $0.818 (+5–7% MTM). Mean-reversion into a bounce off the late-June lows — not a breakout headline trade.
Hard stop zone −10% from blended average ~ $0.693 . Exits follow Pine ALMA flip + min diff or the hard stop.
═
█ MACRO
Sector: ZRO = cross-chain / L2 infrastructure — trades with alt-beta and bridge-narrative flows, not BTC mining economics.
Tape: Alts stabilised after the Iran/oil headline week; infrastructure names can lead when BTC holds and rotation leaves pure memes.
Risk: Token unlock / ecosystem headlines can gap 12H bars — %-stop discipline matters on BINANCE spot as much as perps.
Execution is 12H ALMA, not a protocol roadmap call.
═
█ OUTLOOK
Positive factors
- 83% WR · PF 5.2 · avg win +23.0% vs avg loss −8.8% · ~19 bars — strong payoff in a small 30-trade sample
- Two fresh adds inside 24h · open MTM already positive
- ALMA — execution ladder: 4H LONG · Cur L:2 vs LAvg:2.5 — young above-session, not time-overheated · 1D LONG · Cur L:1 vs LAvg:3.3 — first bar above, well under average length
- EMA — bounce vs slow bear: 15m/1H Above (−1.8% / −2.7% dev) — price reclaimed fast EMAs · 4H still Below with Cur S:32 vs Avg S:11.3 — extended sell-time on 4H, but mean-reversion long working if 12H holds
- RSI (29 Jun): daily board flagged oversold into the add window — aligns with discount entry, not stretched chase
- Hard −10% stop caps nominal script risk on the two-lot cluster
Negative factors
- 3D / 1W ALMA still SHORT: 3D Cur S:4 vs SAvg:4.0 · 1W Cur S:14 — slow grids below on higher TFs; 12H long needs faster TF follow-through
- EMA slow-stack risk: 1D Cur S:14 vs Avg S:14 (+21% dev) · 3D/1W deep Below — macro downtrend on slow EMAs not fully reversed
- 12H bar can gap on alt headline risk — stop slippage on BINANCE
- Past backtest ≠ live fills; 30-trade sample is thin vs large-cap equity templates
Base case: 12H ALMA holds · 4H/1D LONG boards extend · drift toward prior 4H resistance zone if alt-beta stays firm.
Bear case: fail 1D ALMA · 3D SHORT ALMA reasserts · −10% from ~$0.77 blend toward ~$0.69.
ZROUSDT 1D#ZRO is moving inside a falling wedge pattern on the daily chart, and there is a bullish divergence, which increases the probability of an upside breakout.
The setup looks promising, so keep an eye on it. In case of a breakout above the wedge resistance, the potential upside targets are:
🎯 $0.972
🎯 $1.105
🎯 $1.213
🎯 $1.321
🎯 $1.474
🎯 $1.669
⚠️ Always remember to use a tight stop-loss and maintain proper risk management.
#ZROUSDT is currently strongly bullish#ZRO
The price is moving within a descending channel on the 1-hour timeframe and has reached the lower boundary. It is now poised for a bounce and is expected to retest this boundary.
The Relative Strength Index (RSI) indicates a downward trend, which is likely to continue given the overbought conditions.
There is a key support zone (in green) at 0.814. The price has bounced off this zone several times, making it a strong support level.
The price is trending towards the 100-period moving average, which we are approaching. This trend supports an upward move.
Entry Price: 0.900
Target 1: 0.927
Target 2: 0.969
Target 3: 1.02
Stop Loss: At the resistance zone (in green)
Remember this simple rule: Money management.
Any questions? Please leave a comment.
Thank you.
#ZROUSDT is currently strongly bullish#ZRO
The price is moving within an ascending channel on the 1-hour timeframe and has reached the lower boundary, heading towards a breakout. A retest of this boundary is expected.
The Relative Strength Index (RSI) indicates a downward trend, and this trend is likely to continue due to the overbought condition.
There is a key resistance zone (in green) at 0.797, which the price has bounced off several times, making it a strong support level.
A consolidation trend is observed above the 100-period moving average, which we are approaching. This trend supports a decline towards this level.
Entry Price: 0.922
Target 1: 0.944
Target 2: 0.983
Target 3: 1.036
Stop Loss: At the resistance zone (in green).
Remember this simple rule: Manage your money wisely.
For any questions, please leave a comment.
Thank you.
#ZROUSDT may continue its trend after correction#ZRO
The price is moving within a descending channel on the 1-hour timeframe and has reached the lower boundary, heading towards a breakout. A retest of this boundary is expected.
The Relative Strength Index (RSI) indicates a downward trend, and this trend is likely to continue due to the overbought condition.
There is a key resistance zone (in green) at 1.38, which the price has bounced off several times, making it a strong support level.
A consolidation trend is observed above the 100-period moving average, which we are approaching. This trend supports a decline towards this level.
Entry Price: 1.14
Target 1: 1.10
Target 2: 1.05
Target 3: 0.997
Stop Loss: At the resistance zone (in green).
Remember this simple rule: Manage your money wisely.
For any questions, please leave a comment.
Thank you.
#ZROUSDT is currently strongly bullish#ZRO
The price is moving within a descending channel on the 1-hour timeframe and has reached the lower boundary. It is now poised for a bounce and is expected to retest this boundary.
The Relative Strength Index (RSI) indicates a downward trend, which is likely to continue given the overbought conditions.
There is a key support zone (in green) at 1.03, and the price has bounced off this zone several times, making it a strong support level.
The price is trending towards the 100-period moving average, which we are approaching. This trend supports an upward move.
Entry Price: 1.11
First Target: 1.145
Second Target: 1.17
Third Target: 1.20
You can stop at the first and second targets and close the price, or continue towards the third target. Stop Loss: At the resistance zone (in green).
Remember this simple rule: Money Management.
Any questions? Please leave a comment.
Thank you.
#ZROUSDT is currently strongly bullish#ZRO
The price is moving within a descending channel on the hourly timeframe. It has reached the lower boundary and is trending towards a bounce. A retest of this boundary is expected.
The Relative Strength Index (RSI) indicates a downward trend, and this trend is likely to continue due to the overbought condition.
A key support zone (in green) was found at 1.17. The price has bounced off this zone several times, making it a strong support level.
The price is trending towards the 100-period moving average, which we are approaching. This trend supports an upward move.
Entry Price: 1.26
First Target: 1.28
Second Target: 1.32
Third Target: 1.36
You can close at the second target or wait for the third target to be reached. The choice is yours.
Stop Loss: At the resistance zone (in green).
Remember this simple rule: Money Management.
Any questions? Please leave a comment.
Thank you.
#ZROUSDT could be another strong contender#ZRO
The price is moving within a descending channel on the hourly timeframe. It has reached the lower boundary and is trending towards a bounce. A retest of this boundary is expected.
The Relative Strength Index (RSI) indicates a downward trend, and this trend is likely to continue due to the overbought condition.
A key support zone (in green) has been identified at 1.15. The price has bounced off this zone several times, making it a strong support level.
The price is trending towards the 100-period moving average, which we are approaching. This trend supports an upward move.
Entry Price: 1.25
First Target: 1.28
Second Target: 1.32
Third Target: 1.36
You can close at the second target or wait for the third target to be reached. The choice is yours.
Stop Loss: At the resistance zone (in green).
Remember this simple rule: Money Management.
Any questions? Please leave a comment.
Thank you.
#ZROUSDT is currently strongly bullish#ZRO
The price is moving within a descending channel on the 1-hour timeframe and has reached the lower boundary. It is now poised for a bounce and is expected to retest this boundary.
The Relative Strength Index (RSI) indicates a downward trend, which is likely to continue given the overbought conditions.
There is a key support zone (in green) at 1.175, and the price has bounced off this zone several times, making it a strong support level.
The price is trending towards the 100-period moving average, which we are approaching. This trend supports an upward move.
Entry Price: 1.29
First Target: 1.323
Second Target: 1.36
Third Target: 1.40
You can stop at the first and second targets and close the price, or continue towards the third target. Stop Loss: At the resistance zone (in green).
Remember this simple rule: Money Management.
Any questions? Please leave a comment.
Thank you.
#ZROUSDT could be another strong contender#ZRO
The price is moving within a descending channel on the 1-hour timeframe and has reached the lower boundary. It is now poised for a bounce and is expected to retest this boundary.
The Relative Strength Index (RSI) indicates a downward trend, which is likely to continue given the overbought conditions.
There is a key support zone (in green) at 1.32, and the price has bounced off this zone several times, making it a strong support level.
The price is trending towards the 100-period moving average, which we are approaching. This trend supports an upward move.
Entry Price: 1.46
First Target: 1.49
Second Target: 1.53
Third Target: 1.57
You can stop at the first and second targets and close the price, or continue towards the third target. Stop Loss: At the resistance zone (in green).
Remember this simple rule: Money Management.
Any questions? Please leave a comment.
Thank you.
#ZROUSDT could be another strong contender#ZRO
The price is moving within a descending channel on the 1-hour timeframe and has reached the lower boundary. It is now poised for a bounce and is expected to retest this boundary.
The Relative Strength Index (RSI) indicates a downward trend, which is likely to continue given the overbought conditions.
There is a key support zone in green at 1.37, and the price has bounced off this zone several times, making it a strong support level.
The price is trending towards the 100-period moving average, which we are approaching. This trend supports an upward move.
Entry Price: 1.56
Target 1: 1.67
Target 2: 1.76
Target 3: 1.86
You can stop at the first and second targets and close the price, or continue towards the third target.
Stop Loss: At the resistance zone in green.
Remember this simple rule: Money Management.
Any questions? Please leave a comment.
Thank you.