**1 week chart ZRX outlook **Macro Downtrend & Compressed Price Action:
🔥🔥REVERSAL INCOMING🔥🔥
The price has been in a long-term macro downtrend since late 2024. It is currently trading right at the bottom edge of its historical range at $0.085701.
There is a dense cluster of multiple moving averages (the rainbow EMA/SMA ribbon) cascading downward directly above the current price, which will act as strong dynamic resistance on any relief rally. The price is trading well below a thick, red Ichimoku Cloud, confirming strong bearish momentum on the macro weekly timeframe.
Crucial Support Level: The price is testing a historical horizontal support zone marked by the red line around $0.091614, and the lower dashed red line near $0.077532.
Next Projection
The asset is in a critical "make or break" zone. Because it is highly extended to the downside and sitting on historical multi-year support, two scenarios present themselves:
1. Bullish Reversal / Relief Rally (Accumulation): If buyers defend this $0.077 – $0.085 range, a technical relief rally is projected to test the nearest major overhead horizontal resistance.
2. Bearish Breakdown: If the price weekly candle closes decisively below $0.077, it enters price discovery to the downside, targeting psychological levels like $0.050 or $0.030.
Key Price Targets (Upside)
If a reversal or relief rally begins from this support floor, the primary overhead targets:
• Target 1: $0.146175 — This matches the nearby key horizontal resistance level where the moving average ribbon begins to cluster.
• Target 2: $0.400584 — A major macro horizontal resistance line (the blue line on the chart) which served as a significant pivot point throughout 2023 and 2024.
• Target 3: $0.700000 — Psychological resistance and previous local highs.
Where to Put a Stop Loss
For managing risk on a long position at these current depressed levels:
• Tight Stop Loss: Below $0.077532
Placing a stop loss just below the lower red support line shown on the right axis ($0.077532) ensures you exit if the current multi-year floor completely breaks down.
• Conservative / Hard Stop: $0.070000
Giving it a slight buffer below the chart's immediate support to avoid getting wicked out before a potential recovery.
If the price breaks clears below $0.077, the immediate bullish thesis is invalidated.
Because a 1-Week (1W) macro chart, price movements on this scale take a significant amount of time to play out. Each single candle represents a full week of trading activity.
Based on the historical price cycles visible on the chart, here is the projected timeline for each target if the support floor holds:
⏱️ Target Timeline Breakdown
• Target 1 ($0.146175) — Short to Medium-Term (1 to 3 Months)
This is the most immediate technical target. Looking at previous historical bounces on this chart (like the ones in early 2023 and mid-2024), a relief rally off a major support floor usually takes a few weeks to a couple of months to stall out at the first layer of heavy moving average resistance.
• Target 2 ($0.400584) — Long-Term (6 to 12 Months)
Moving from the absolute floor up to the blue macro pivot line requires a massive structural trend shift. On the weekly timeframe, breaking through the dense dynamic moving average ribbon and the thick red Ichimoku Cloud takes months of accumulation or a broad crypto market bull cycle. Historically, major leg-ups on this chart have taken roughly 6 to 9 months to peak.
• Target 3 ($0.700000) — Macro Cycle / Extended Long-Term (12+ Months)
This level represents a complete multi-year reversal back to previous macro highs. Reaching this target requires sustained market-wide bullish momentum and would likely play out over a full market cycle lasting over a year.
⚠️ Critical Validation Note:
Because the price is currently sitting right on the edge of the multi-year support zone, the timeline only activates if the support holds.
In-depth trading ideas
ZRX/USD Main trend. Channel. Fractal.Logarithm. Time frame 1 month. Main trend. Idea for long-term trend orientation on a large timeframe.
0x is an infrastructure protocol that allows users to easily trade ERC20 tokens and other assets in the Ethereum blockchain without relying on centralized intermediaries such as traditional cryptocurrency exchanges.
The price has fallen by -93% from the high of pumping. Pump/dump channel. Possible fractal recurrence based on the logic of the previous secondary trend. The potential is quite significant.
Suitable for position trading. Rational to work from the average buy/sell price. The price is approaching the zone of previous lows, but the slippage can be by a significant percentage at the moment of “fear peak”.
Trading volume. Holder Addresses.
Pay attention to the minimum trading volume of the last year (this whole downtrend) compared to the past cycles. To understand why it is so, trace the main mass of large and medium addresses of this coin. Activity, time of creation.
This is what it looks like on a line chart if the “market noise” is removed.
Z
ZRX Linear Regression Trend pierces Bollinger Band Buy ZoneI use 3 Primary indicators to determine trade entries and exits
1) Pivot points - 1yr (Thinnest), 2yr (Medium), and 3yr (Thick Lines) are plotted with pivot in yellow, Resistance bands in Red / Pink hues, Support in Blue.
2) Fibonnaci Bollinger Bands - Midline in purple, 25% and 75% in yellow are buy and sell zones
3) Linear Regression - Linear regression dictates price action outside of major fundamental events.
For trades, I nearly always enter buys below the Bollinger midline and more typically like to buy in the bottom 25% of the Bollinger Band. I look for the linear regression channel to be intersecting price action, and usually target a pivot point for exits.
For ZRX Daily chart, we see the Red/Yellow LR channel has pierced the bottom 25% of the Bollinger Band, indicated by the thin yellow Bollinger Band. This is typically a reliable, low-risk entry. Once this occurs, I look for price action to travel through the linear-regression trend line as this indicates to me that sellers are exhausted and there is a solidly established price floor strong enough to push through the linear-regression line.
For ZRX, you can see that this has occurred several times in previous years, with a subsequent rise in price of 2-3 times the original buy zone.
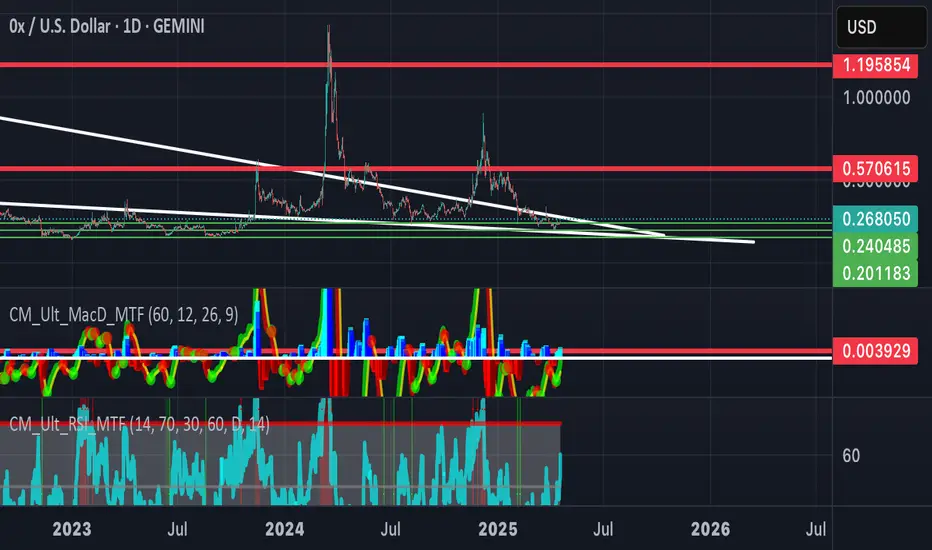
For this trade, I am going long at .26 with a target just below the 3-year pivot of .65, which is solidly in the middle of that 2-3x range. I typically trigger out just below major pivots to get the best chance of trade execution while locking in solid gains.
Stop loss set at .20, which is the recent low.
ZRX - importance of fibb 0.886 levelZRX up to now has been doing pretty predictable moves. Reversal always led to fibb 0.886 level test, be it to upside or downside. Only expection was in recent bull run of March 2024 where if failed to rech fibb 0.886 level. Hard to say what is importance of this and which implications has for the future but we are oversold, sitting at RSI support line which always brought reversal to upside. I expect strong push up where RSI should hit overbought range again. Potential targets are local fibb 0.886 level (carefull not to miss it again) and overextend to test major price resistance at 2.50$.
ZRX seems coiled for a good move.News on cross-chain is the perfectly timed catalyst with good momentum like weve had
Would love to see 1$ again.
ZLong
Only if you must long a shitcoinThis is the one.
It will make sense after the pump as usual, but i strongly believe that if mania continues across the market, this will go up.
Only if you must.
ZLong
ZRXUSD (1W) - buy the dipHi traders,
Here it is my idea for a long position on ZRXUSD (1 week time frame).
the price hit a local high in March 2024 and hit another high in November 2024, after that the price bounced back and is currently experiencing the pullback. The idea is to enter in the buy area, which is determined by a previous resistance zone that can be a support for a bounce up now. The best would be if the price will hit the SMA in the buy area and use it as a support too. The buy area is shown on the chart.
We will put our first target at the level of the last high. The second target will be at the level when the price hit a local high in October 2021.
Good luck!
Weekly bullish momentum-trade: OX USD or ZRX USD
Weekly timeframe ZRX USD on the back of Cryptocurrency hammering currently as accumulation expected to turn into breakout patterns anytime now and going forwards into 2025 for a strong rally.
This junior crypto had normal stochastic divergence on a weekly timeframe recently, it's RSI momentum is close to 50, it's Stochastic's has provided a bullish lift well above the oversold 20 level and the MACD ticks all boxes with a recent bullish cross-up.
Buy up until it's recent high about 0.3665. There is usually a poorer spread with this one in the buy-price but its' momentum I can assure truly makes up for any shortfall.
OX: ZRXUSD. Buying Demand Is Back & Now Above It's 50EMA.
Cryptocurrency seemed to love FOMC a couple of days ago, unlike the Gold-price that sent a nasty sell-signal to Long-holders, not even 1 hour after an interest rate reduction was announced. But that's Gold-trading where your screen can go from red to green at the blink of an eye and vice-versa before you get a chance to rub your eye-brow.
OX is ZRXUSD and its about to make a bullish cross on the Daily timeframe and it's really turned around as of late. I give it a Buy-signal.
If you're looking for something a bit more long term, consider OX maybe, 370% under it's 2024 March high. Unlike the Gold price, where you generally get zero % under yearly highs.
Another Crypto I went long-on several hours ago..the OX!
The smaller crypto's are supported by a bullish bitcoin currently which I have a distinct feeling may stay bullish this coming week. I've been going against the grain all weekend against the naysayer's on Bitcoin. See my other charts today.
I hope you're having a good weekend & doing something other than the markets like myself.
Cheers,
Chris
ZRX (Ox Protocol)I have been watching this develop for a while. Highly speculative and risky, of course, but I put this in front of some non traders and they saw it immediately. I plan to watch closely with stop losses around .2 to .25 initially. My exit will be somewhere between $2 and $2.5. Good Luck folks.
ZRXUSDTZRXUSDT is in strong bullish trend.
As the market is consistently printing new HHs and HLs.
currently the market is retracing a bit after last HH, which is 50% Fib retracement level and local support as well. if the market successfully sustain this buying confluence the next leg up could go for new HH.
What you guys think of this idea?