ZRX: local squeeze with $0.1016 destinationThe Macro Picture 🗺️
ZRX unwound from the $0.12884 macro ceiling into a range and is now balancing at $0.08636, in the middle of the band above the $0.07315 floor. The tape has flattened into rotation as it works off the downtrend.
The Setup ⚙️
The Range Floor 🟢
$0.07315 (Macro Support) is the de
Compare with ZRX/USDT
ZRXUSDT Forming Bullish MomentumZRXUSDT is forming a clear bullish momentum pattern, a classic bullish wave signal that often indicates an upcoming breakout. The price has been consolidating within a narrowing range, suggesting that selling pressure is weakening while buyers are beginning to regain control. With consistent volume
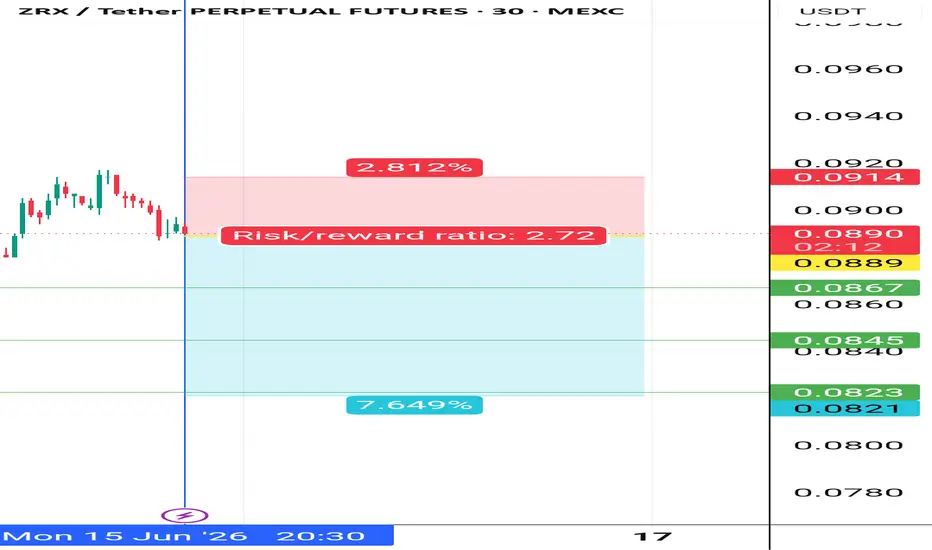
ZRXUSDT LONGInstructions:
Entry point: yellow
Stop loss: red
Take profit: green
👉Leverage x 5-10-20 for crypto
👉Leverage x 20-50-100 for commodities, stocks, indices, and forex
👉Margin 1-5% max.
Always practice risk and money management.
Invest a maximum of 5% on any trade or across all your trades.
Invest on
ZRX FROM 2017I think ZRX has hit the bottom of the price again since 2017. I expect the price to grow to $0.28 and if it can break the ceiling of the descending channel, it will definitely grow to $1.86. Currently, the monthly RSI and MACD are negative. The price has not touched the monthly Bollinger Bands, but
ShortInstructions:
Entry point: yellow
Stop loss: red
Take profit: green
👉Leverage x 5-10-20 for crypto
👉Leverage x 20-50-100 for commodities, stocks, indices, and forex
👉Margin 1-5% max.
Always practice risk and money management.
Invest a maximum of 5% on any trade or across all your trades.
Invest on
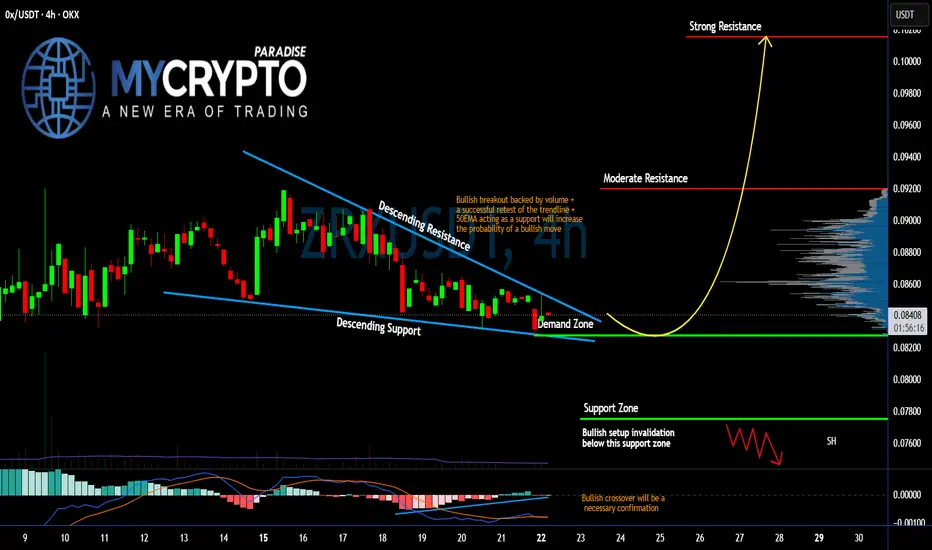
Is #ZRX Ready For a Short Term Recovery or Not? Key Levels Yello, Paradisers! Is #ZRX preparing a major bullish breakout from this compression pattern, or will impatient traders get shaken out? Let's view #OxProtocol trading setup:
💎#ZRXUSDT is currently trading inside a falling wedge structure on the 4H timeframe, where both resistance and support are gra
Zrxusdt shortInstructions:
Entry point: yellow
Stop loss: red
Take profit: green
👉Leverage x 5-10-20 for crypto
👉Leverage x 20-50-100 for commodities, stocks, indices, and forex
👉Margin 1-5% max.
Always practice risk and money management.
Invest a maximum of 5% on any trade or across all your trades.
Invest on
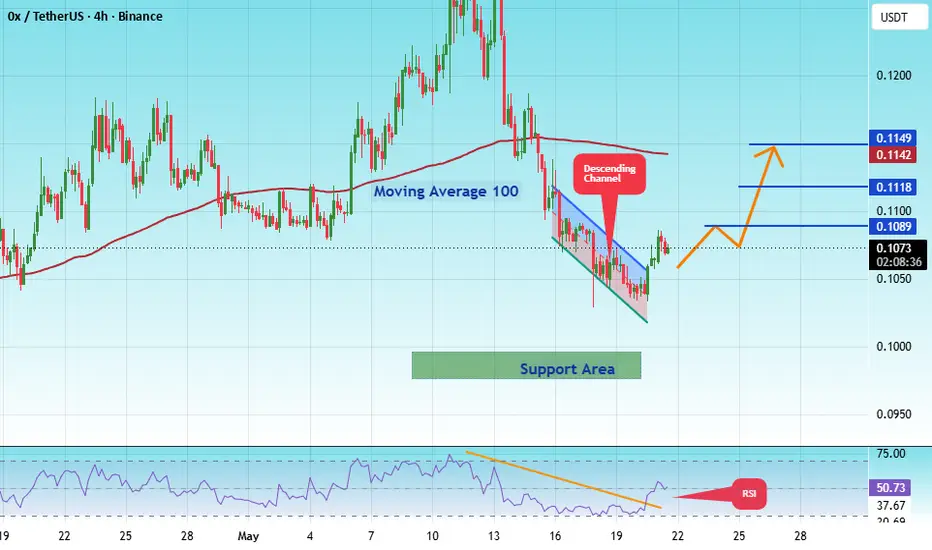
#ZRXUSDT Bullish Impulse, New All-Time High Late 2025#ZRX
The price is moving within a descending channel on the 1-hour timeframe and has reached the lower boundary. It is now poised for a bounce and is expected to retest this boundary.
The Relative Strength Index (RSI) indicates a downward trend, which is likely to continue given the overbought co
See all ideas
Summarizing what the indicators are suggesting.
Oscillators
Neutral
SellBuy
Strong sellStrong buy
Strong sellSellNeutralBuyStrong buy
Oscillators
Neutral
SellBuy
Strong sellStrong buy
Strong sellSellNeutralBuyStrong buy
Summary
Neutral
SellBuy
Strong sellStrong buy
Strong sellSellNeutralBuyStrong buy
Summary
Neutral
SellBuy
Strong sellStrong buy
Strong sellSellNeutralBuyStrong buy
Summary
Neutral
SellBuy
Strong sellStrong buy
Strong sellSellNeutralBuyStrong buy
Moving Averages
Neutral
SellBuy
Strong sellStrong buy
Strong sellSellNeutralBuyStrong buy
Moving Averages
Neutral
SellBuy
Strong sellStrong buy
Strong sellSellNeutralBuyStrong buy
Displays a symbol's price movements over previous years to identify recurring trends.
Frequently asked questions
The current price of ZRX(0X) / Tether USD (ZRX) is 0.0861 USDT — it has fallen −0.12% in the past 24 hours. Try placing this info into the context by checking out what coins are also gaining and losing at the moment and seeing ZRX price chart.
ZRX(0X) / Tether USD price has fallen by −0.35% over the last week, its month performance shows a 1.77% increase, and as for the last year, ZRX(0X) / Tether USD has decreased by −71.67%. See more dynamics on ZRX price chart.
Keep track of coins' changes with our Crypto Coins Heatmap.
ZRX(0X) / Tether USD (ZRX) reached its highest price on Apr 14, 2021 — it amounted to 2.3995 USDT. Find more insights on the ZRX price chart.
See the list of crypto gainers and choose what best fits your strategy.
ZRX(0X) / Tether USD (ZRX) reached the lowest price of 0.0739 USDT on Jun 25, 2026. View more ZRX(0X) / Tether USD dynamics on the price chart.
See the list of crypto losers to find unexpected opportunities.
The safest choice when buying ZRX is to go to a well-known crypto exchange. Some of the popular names are Binance, Coinbase, Kraken. But you'll have to find a reliable broker and create an account first. You can trade ZRX right from TradingView charts — just choose a broker and connect to your account.
Crypto markets are famous for their volatility, so one should study all the available stats before adding crypto assets to their portfolio. Very often it's technical analysis that comes in handy. We prepared technical ratings for ZRX(0X) / Tether USD (ZRX): today its technical analysis shows the sell signal, and according to the 1 week rating ZRX shows the sell signal. And you'd better dig deeper and study 1 month rating too — it's sell. Find inspiration in ZRX(0X) / Tether USD trading ideas and keep track of what's moving crypto markets with our crypto news feed.
ZRX(0X) / Tether USD (ZRX) is just as reliable as any other crypto asset — this corner of the world market is highly volatile. Today, for instance, ZRX(0X) / Tether USD is estimated as 2.96% volatile. The only thing it means is that you must prepare and examine all available information before making a decision. And if you're not sure about ZRX(0X) / Tether USD, you can find more inspiration in our curated watchlists.
You can discuss ZRX(0X) / Tether USD (ZRX) with other users in our public chats, Minds or in the comments to Ideas.