ZRX: local squeeze with $0.1016 destinationThe Macro Picture 🗺️
ZRX unwound from the $0.12884 macro ceiling into a range and is now balancing at $0.08636, in the middle of the band above the $0.07315 floor. The tape has flattened into rotation as it works off the downtrend.
The Setup ⚙️
The Range Floor 🟢
$0.07315 (Macro Support) is the demand base, with $0.07751 (Local Low) as the nearer shelf. Both have held, and that's the floor this range pivots on.
The Decision Point 🔴
$0.09461 (Local High) is the gate. A daily close above it flips the local structure bullish and opens the path to the $0.10159 measured-move target.
The Roadmap 🛣️
Hold above $0.07751 → break $0.09461 → run toward $0.10159. Invalidation is a clean daily close below $0.07315 — that breaks the base.
This is a GRID Range Play: a defined band to rotate, buying the lower half and scaling out into strength.
More setups in profile.
#ZRX #0x #crypto #trading #TA #3Commas #GRID
In-depth trading ideas
ZRXUSDT Forming Bullish MomentumZRXUSDT is forming a clear bullish momentum pattern, a classic bullish wave signal that often indicates an upcoming breakout. The price has been consolidating within a narrowing range, suggesting that selling pressure is weakening while buyers are beginning to regain control. With consistent volume confirming accumulation at lower levels, the setup hints at a potential bullish breakout soon. The projected move could lead to an impressive gain of around 20% to 30% once the price breaks above the key resistance zone.
This bullish momentum pattern is typically seen at the end of downtrends or corrective phases, and it represents a potential shift in market sentiment from bearish to bullish. Traders closely watching ZRXUSDT are noting the strengthening momentum as it approaches a critical breakout area. Good trading volume adds confidence to this setup, showing that market participants are positioning early in anticipation of a sustained upward move.
Investors’ growing interest in ZRXUSDT reflects rising confidence in the project's long-term fundamentals and current technical strength. If the breakout confirms with sustained buying volume, this could mark the beginning of a fresh bullish leg. The ongoing consolidation phase indicates that buyers are steadily gaining control while bearish momentum continues to weaken, creating favorable conditions for further upside.
Traders might find this a valuable setup for medium-term gains, especially as the bullish momentum pattern nears completion and buying pressure continues to build. A confirmed breakout above resistance could attract additional market participation and potentially drive the price toward its projected upside target over the coming weeks.
✅ Show your support by hitting the like button!
✅ Leave a comment below! (What is your opinion about this coin?)
Your feedback and engagement keep me inspired to share more insightful market analysis with you!
ZRXUSDT LONGInstructions:
Entry point: yellow
Stop loss: red
Take profit: green
👉Leverage x 5-10-20 for crypto
👉Leverage x 20-50-100 for commodities, stocks, indices, and forex
👉Margin 1-5% max.
Always practice risk and money management.
Invest a maximum of 5% on any trade or across all your trades.
Invest only what you can afford to lose, as no one is in control of the market.
👉Our analyses are primarily based on:
breakouts: two trend lines (ascending and descending) and a line indicating a horizontal breakout.
chart patterns: shoulders and head, triangle parttern, elliott impulse, etc etc.
We don't always have the time to track them at all times or to represent them visibly, given the numerous signals, the number of channels to manage, and especially because of the often rapid pace of market movements.
indicators: We associate at least two indicators with this technique.
👉Depending on the circumstances, we use specific indicators, often setting 3 or more take profit levels.
👉Indeed, there are good days in trading and also bad days. No one can promise to win every trade, and like all traders worldwide, we also experience stop-loss orders. However, we win more than we lose and remain positive.
👉You can close the position before or after the take profit orders indicated by the green lines if you are personally satisfied; the same applies to stop loss orders.
👉We must stay positive, clear-headed, and humble.
we cannot provide all instructions or all trades here on this channel.
Good luck to us all, and may God guide us. Amen
ZRX FROM 2017I think ZRX has hit the bottom of the price again since 2017. I expect the price to grow to $0.28 and if it can break the ceiling of the descending channel, it will definitely grow to $1.86. Currently, the monthly RSI and MACD are negative. The price has not touched the monthly Bollinger Bands, but with all these bad points, I believe that the growth season of this currency is starting. Good luck
ShortInstructions:
Entry point: yellow
Stop loss: red
Take profit: green
👉Leverage x 5-10-20 for crypto
👉Leverage x 20-50-100 for commodities, stocks, indices, and forex
👉Margin 1-5% max.
Always practice risk and money management.
Invest a maximum of 5% on any trade or across all your trades.
Invest only what you can afford to lose, as no one is in control of the market.
👉Our analyses are primarily based on:
breakouts: two trend lines (ascending and descending) and a line indicating a horizontal breakout.
chart patterns: shoulders and head, triangle parttern, elliott impulse, etc etc.
We don't always have the time to track them at all times or to represent them visibly, given the numerous signals, the number of channels to manage, and especially because of the often rapid pace of market movements.
indicators: We associate at least two indicators with this technique.
👉Depending on the circumstances, we use specific indicators, often setting 3 or more take profit levels.
👉Indeed, there are good days in trading and also bad days. No one can promise to win every trade, and like all traders worldwide, we also experience stop-loss orders. However, we win more than we lose and remain positive.
👉You can close the position before or after the take profit orders indicated by the green lines if you are personally satisfied; the same applies to stop loss orders.
👉We must stay positive, clear-headed, and humble.
we cannot provide all instructions or all trades here on this channel.
Good luck to us all, and may God guide us. Amen.
Is #ZRX Ready For a Short Term Recovery or Not? Key Levels Yello, Paradisers! Is #ZRX preparing a major bullish breakout from this compression pattern, or will impatient traders get shaken out? Let's view #OxProtocol trading setup:
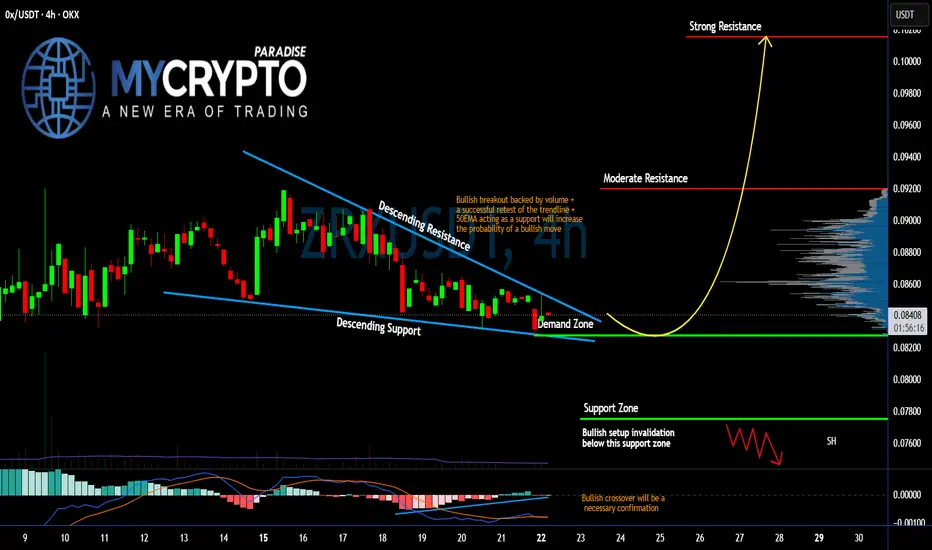
💎#ZRXUSDT is currently trading inside a falling wedge structure on the 4H timeframe, where both resistance and support are gradually converging. After several days of controlled selling pressure, the price has now reached a key demand zone around $0.082, where buyers have already started showing interest. This area represents the most important short-term support level and could become the foundation for the next bullish expansion.
💎The descending resistance trendline continues to cap upside attempts, but the bearish momentum has been weakening as price approaches the apex of the pattern. Historically, these types of structures often resolve with strong breakout moves once enough liquidity has been accumulated. The repeated defense of the demand zone suggests that sellers are struggling to push the price significantly lower despite multiple attempts.
💎The key confirmation for bulls will be a decisive breakout above the descending resistance trendline, ideally supported by increasing trading volume. Additional strength would come from the 50 EMA acting as dynamic support after the breakout. If this confirmation develops, the first upside objective is the moderate resistance zone around $0.091-$0.092. This level aligns with a significant supply area where some profit-taking activity may emerge.
💎Should buyers successfully overcome the moderate resistance zone, #ZRXUSD could quickly accelerate toward the next major target near $0.101. This represents the strongest resistance area on the chart and would likely become the primary upside objective for bullish traders if momentum continues to build.
💎From a momentum perspective, the MACD is showing early signs of improvement, with bullish momentum gradually recovering after an extended bearish phase. However, a confirmed bullish crossover is still required to strengthen the probability of a sustained upward move. This crossover would provide an important technical confirmation that buyers are regaining control. On the downside, traders should closely monitor the major support zone around $0.077. A breakdown below this level would invalidate the current bullish setup.
Trade smart, Paradisers. This setup will reward only the disciplined.
MyCryptoParadise
iFeel the success🌴
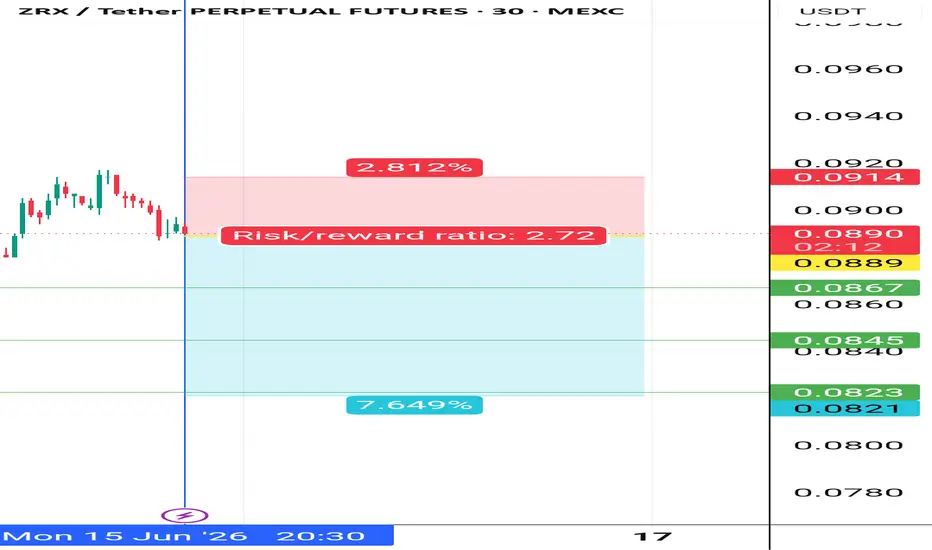
Zrxusdt shortInstructions:
Entry point: yellow
Stop loss: red
Take profit: green
👉Leverage x 5-10-20 for crypto
👉Leverage x 20-50-100 for commodities, stocks, indices, and forex
👉Margin 1-5% max.
Always practice risk and money management.
Invest a maximum of 5% on any trade or across all your trades.
Invest only what you can afford to lose, as no one is in control of the market.
👉Our analyses are primarily based on:
breakouts: two trend lines (ascending and descending) and a line indicating a horizontal breakout.
chart patterns: shoulders and head, triangle parttern, elliott impulse, etc etc.
We don't always have the time to track them at all times or to represent them visibly, given the numerous signals, the number of channels to manage, and especially because of the often rapid pace of market movements.
indicators: We associate at least two indicators with this technique.
👉Depending on the circumstances, we use specific indicators, often setting 3 or more take profit levels.
👉Indeed, there are good days in trading and also bad days. No one can promise to win every trade, and like all traders worldwide, we also experience stop-loss orders. However, we win more than we lose and remain positive.
👉You can close the position before or after the take profit orders indicated by the green lines if you are personally satisfied; the same applies to stop loss orders.
👉We must stay positive, clear-headed, and humble.
we cannot provide all instructions or all trades here on this channel.
Good luck to us all, and may God guide us. Amen.
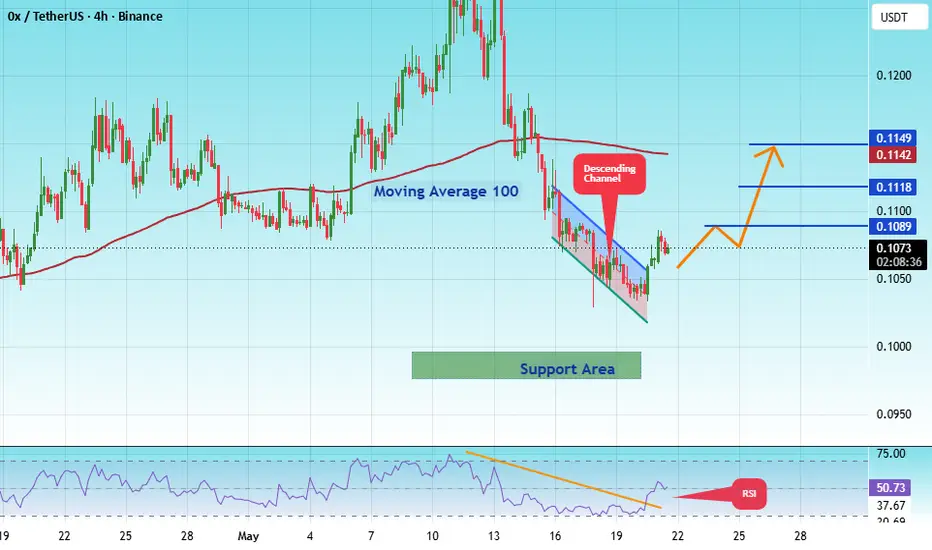
#ZRXUSDT Bullish Impulse, New All-Time High Late 2025#ZRX
The price is moving within a descending channel on the 1-hour timeframe and has reached the lower boundary. It is now poised for a bounce and is expected to retest this boundary.
The Relative Strength Index (RSI) indicates a downward trend, which is likely to continue given the overbought conditions.
There is a key support zone (in green) at 0.0979. The price has bounced off this zone several times, making it a strong support level.
The price is trending towards the 100-period moving average, which we are approaching. This trend supports an upward move.
Entry Price: 0.1070
First Target: 0.1089
Second Target: 0.1189
Third Target: 0.1149
You can stop at the first and second targets and close the price, or continue towards the third target. Stop Loss: At the resistance zone (in green).
Remember this simple rule: Money Management.
Any questions? Please leave a comment.
Thank you.
#ZRXUSDT Bullish Impulse, New All-Time High Late 2025#ZRX
The price is moving within a descending channel on the 1-hour timeframe and has reached the lower boundary. It is now poised for a bounce and is expected to retest this boundary.
The Relative Strength Index (RSI) indicates a downward trend, which is likely to continue given the overbought conditions.
There is a key support zone in green at 1042. The price has bounced off this zone several times, making it a strong support level.
The price is trending towards the 100-period moving average, which we are approaching. This trend supports an upward move.
Entry Price: 0.1100
First Target: 0.1118
Second Target: 0.1143
Third Target: 0.1173
You can stop at the first and second targets and close below them, or continue towards the third target. Stop Loss: At the resistance zone in green.
Remember this simple rule: Money Management.
Any questions? Please leave a comment.
Thank you.
ZRX/USDT — Downtrend Pressure Weakening, Potential Breakout?On the 3D timeframe, ZRX/USDT is still in a prolonged downtrend, clearly marked by a strong descending trendline (yellow line). Price continues forming lower highs & lower lows, indicating seller dominance.
However, current price action shows:
Consolidation at the bottom
Price beginning to respect support levels
Potential retest of the trendline as a key resistance
---
📉 Structure & Pattern Formation
🔻 Descending Trendline (Dynamic Resistance)
Main resistance since the start of the downtrend
Multiple touches → high validity
📦 Base / Accumulation Area
Price moving sideways around (~0.10 – 0.12)
Indicates a possible accumulation phase
📊 Potential Pattern: Descending Triangle / Early Falling Wedge
If selling pressure weakens → could evolve into a reversal pattern
---
🚀 Bullish Scenario
Bullish confirmation if:
✅ Price breaks and closes above the trendline
✅ Volume increases on breakout
✅ Successful retest (trendline turns into support)
🎯 Bullish Targets:
0.13250 (first resistance)
0.15000 (mid resistance)
0.18220 (major resistance)
0.21725 (strong resistance / main target)
💡 Strong momentum could signal the start of a mid-term trend reversal
---
🐻 Bearish Scenario
Bearish continuation if:
❌ Price fails to break the trendline
❌ Strong rejection at resistance
❌ Breakdown from consolidation support
🎯 Bearish Targets:
0.10500 (minor support)
0.08660 (previous low / strong support)
💡 A breakdown below these levels could extend the downtrend further
---
⚠️ Key Levels to Watch
Trendline resistance (directional trigger)
0.13250 & 0.15000 (important supply zones)
0.10500 – 0.08660 (strong demand zone)
---
🧩 Conclusion
ZRX is currently at a critical phase. Price is testing the descending trendline after a long consolidation.
Breakout = reversal opportunity, while rejection = continuation of the downtrend.
The next move will heavily depend on how price reacts at this trendline.
#ZRXUSDT #CryptoAnalysis #TechnicalAnalysis #Altcoin #CryptoTrading #BullishSetup #BearishScenario #PriceAction #Breakout #DescendingTrendline #CryptoMarket
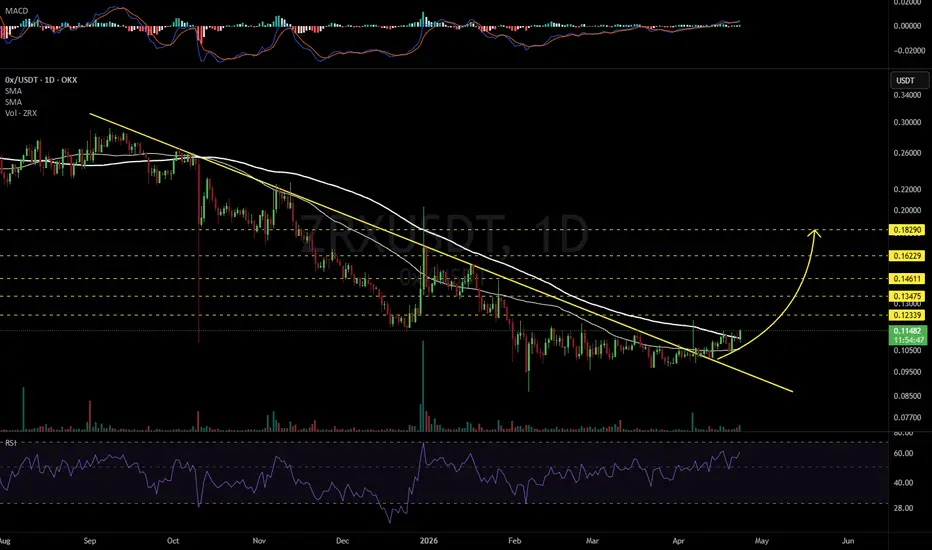
ZRXUSDT 1D#ZRX appears to have strong upside potential in the current market conditions. It is trading above the daily SMA50 and is also breaking out above the daily SMA100. Further upside movement is expected:
🎯 $0.12339
🎯 $0.13475
🎯 $0.14611
🎯 $0.16229
🎯 $0.18290
⚠️ Always remember to use a tight stop-loss and maintain proper risk management.
#ZRXUSDT Bullish Impulse, New All-Time High Late 2025#ZRX
The price is moving within a descending channel on the 4-hour timeframe. It has reached the lower boundary and is trending towards a bounce. A retest of this boundary is expected.
The Relative Strength Index (RSI) indicates a downward trend, and this trend is likely to continue due to the overbought condition.
There is a key support zone in green at 0.0970. The price has bounced off this zone several times, making it a strong support level.
The price is trending towards the 100-period moving average, which we are approaching. This trend supports an upward move.
Entry Price: 0.1000
Target 1: 0.1039
Target 2: 0.1063
Target 3: 0.1091
Stop Loss: At the resistance zone in green
Remember this simple rule: Money management.
Any questions, please leave a comment.
Thank you.
#ZRXUSDT Bullish Impulse, New All-Time High Late 2025#ZRX
The price is moving within a descending channel on the hourly timeframe. It has reached the lower boundary and is trending towards a bounce. A retest of this boundary is expected.
The Relative Strength Index (RSI) indicates a downward trend, and this trend is likely to continue due to the overbought condition.
There is a key support zone in green at 0.0993, and the price has bounced off this zone several times, making it a strong support level.
The price is trending towards the 100-period moving average, which we are approaching. This trend supports an upward move.
Entry Price: 0.1013.77
First Target: 0.1022
Second Target: 0.1037
Third Target: 0.1056
Stop Loss: At the resistance zone in green
Remember this simple rule: Money Management.
Any questions, please leave a comment.
Thank you.
#ZRX/USDT Bullish Impulse, New All-Time High Late 2025
#ZRX
The price is moving within a descending channel on the hourly timeframe. It has reached the lower boundary and is trending towards a bounce. A retest of this boundary is expected.
The Relative Strength Index (RSI) indicates a downward trend, and this trend is likely to continue due to the overbought condition.
There is a key support zone in green at 0.0993, and the price has bounced off this zone several times, making it a strong support level.
The price is trending towards the 100-period moving average, which we are approaching. This trend supports an upward move.
Entry Price: 0.1044
First Target: 0.1067
Second Target: 0.1097
Third Target: 0.1133
Stop Loss: At the resistance zone in green
Remember this simple rule: Money management.
Any questions, please leave a comment.
Thank you.
#ZRX/USDT Bullish Impulse, New All-Time High Late 2025#ZRX
The price is moving within a descending channel on the hourly timeframe. It has reached the lower boundary and is heading towards a breakout, with a retest of the upper boundary expected.
The Relative Strength Index (RSI) is showing a downward trend, approaching the lower boundary, and an upward bounce is anticipated.
There is a key support zone in green at 0.1020, and the price has bounced from this level several times and is expected to bounce again.
The indicator is showing a trend towards consolidation above the 100-period moving average, which we are approaching, supporting the upward move.
Entry Price: 0.1060
First Target: 0.1096
Second Target: 0.1141
Third Target: 0.1200
Stop Loss: Below the green support zone.
Remember this simple thing: Money management.
For any questions, please leave a comment.
Thank you.
ZRXUSDT 1D#ZRX is trading within a falling wedge on the daily chart. Entry is recommended only after a clean breakout above both the wedge resistance and the daily EMA50. If confirmed, the potential upside targets are:
🎯 $0.1542
🎯 $0.1792
🎯 $0.1993
🎯 $0.2195
🎯 $0.2483
🎯 $0.2849
⚠️ Always apply tight stop-losses and maintain strict risk management.
ZRX Prepping for a High-Probability Reversal? Yello Paradisers! Are you watching another panic phase… or the calm before a powerful expansion?
💎#ZRXUSDT is currently trading inside a textbook falling wedge, a classic bullish reversal structure. Price has now completed a liquidity sweep into the major support zone around $0.12–$0.125, an area that has historically attracted strong demand.
💎What strengthens this setup is the clear bullish divergence on the MACD. While the price printed lower lows, momentum failed to follow, indicating a strong signal that bearish pressure is weakening. When bullish divergence aligns with falling wedge compression at major support, the probability of an upside resolution increases significantly.
💎A decisive breakout above the descending wedge resistance would confirm the bullish scenario. If that happens, the first reaction target lies near the 0.1350 resistance (R). A successful reclaim of this level opens the path toward the strong resistance zone near $0.1700, which aligns with prior supply and volume profile resistance, a natural magnet for price during expansion phases.
💎On the downside, any sustained close below $0.1167 invalidates the bullish thesis and signals that the market is not ready yet. This level is a non-negotiable structure that always comes first.
Patience here is key. Liquidations clear emotion, structure reveals intent: trade probabilities, not predictions.
MyCryptoParadise
iFeel the success🌴
#ZRX/USDT Bullish Impulse, New All-Time High Late 2025#ZRX
The price is moving within a descending channel on the hourly timeframe. It has reached the upper boundary and is heading towards breaking it. A retest of this boundary is expected.
The Relative Strength Index (RSI) is showing an upward trend, as it has approached the upper boundary. A bearish reversal is expected.
There is a key support zone in green at 0.1362. The price has bounced from this zone several times and is expected to bounce again.
A consolidation trend is observed above the 100-period moving average, which we are approaching. This trend supports a decline towards this level.
Entry Price: 0.1445
First Target: 0.1477
Second Target: 0.1537
Third Target: 0.1583
Stop Loss: Above the green support zone.
Remember this simple thing: Money management.
For any questions, please leave a comment.
Thank you
0x · The 2026 bull marketI thought people were attracted to Crypto because it produces really wild bull markets. Is it that far fetched to think that the altcoins market is about to grow super strong? Is it that hard to see, or believe?
ZRXUSDT. There are four sections on this chart:
1) Green (up). A bullish cycle. Massive growth.
2) Red (down). A bearish cycle. All growth removed.
3) Green (up). A bullish period. Nice growth.
4) Red (down). A brutal bear market. A new all-time low.
The March 2020 low was activated once on a wick, then again as a shy higher low last month. Immediately after the shy higher low, the highest buy volume showed up in more than a year.
We have 0x trading at bottom prices with the highest volume ever. This is happening at a level that has already been shown, proven, to produce mega, hyper bullish growth. The 2020-2021 bull market. ZRXUSDT grew more than 2,000%.
All the conditions are present. The market cycle is clear. Up and down, up and down; next we go up. That's one. Then the bottom prices and the rest.
Ok. We have all these signals but what is missing? A project that moves first, before the pack, to reveal what is coming to the rest of the market.
Got it, we have plenty of those. We saw dozens of pairs hitting new all-time highs, and even now some pairs are ahead of the game.
This is all telling me that something is up. To me it is incredibly clear, but I understand. It is not easy to accept that something good can happen when the world continues to grow and evolve. If you look at life, all around you, for hundreds of years, everything gets better and better and better with each generation. If you don't believe me, ask the entire world. Where were we 100, 200, 300 or 400 years ago? No rights, slavery, discrimination, lack of opportunities, the money monopoly and so on.
Right now, we have the Internet, we have Crypto and there has never been this much freedom for the masses as we have today.
What I am trying to say is that the market is about to grow really strong, you can see this from the chart.
Namaste.
#ZRX/USDT#ZRX
The price is moving in a descending channel on the 1-hour timeframe. It has reached the lower boundary and is heading towards breaking above it, with a retest of the upper boundary expected.
We have a downtrend on the RSI indicator, which has reached near the lower boundary, and an upward rebound is expected.
There is a key support zone in green at 0.1415. The price has bounced from this zone multiple times and is expected to bounce again.
We have a trend towards stability above the 100-period moving average, as we are moving close to it, which supports the upward movement.
Entry price: 0.1440
First target: 0.1458
Second target: 0.1481
Third target: 0.1522
Stop loss: Below the support zone in green.
Don't forget a simple thing: capital management.
For inquiries, please leave a comment.
Thank you.