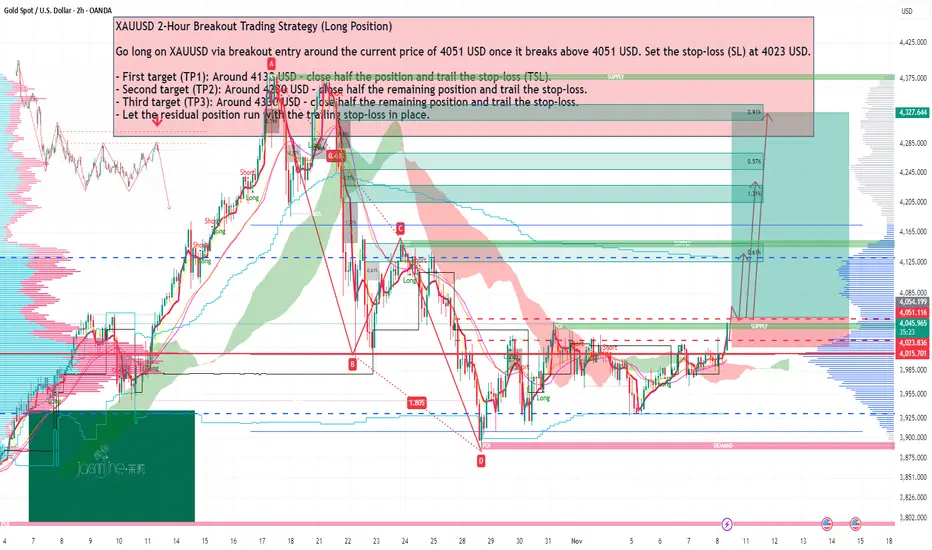
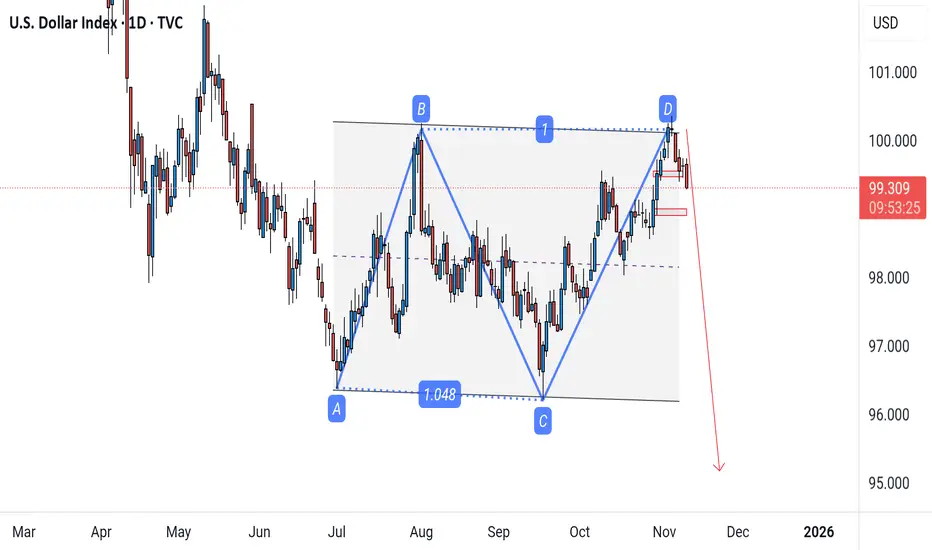
Watching the US$3,886 low closely right now!Whether Gold can hold onto its recent momentum is difficult to predict given the market uncertainty right now.
Not only is it a 50/50 bet whether the Fed pulls the trigger and cuts rates next month, but no one actually knows what US data we will be getting in the coming weeks, now that the US government shutdown has ended.
Additionally, it is still unclear when we will receive the data. September’s numbers will likely filter through next week and give us more of an idea of sentiment, but October’s data is tricky, particularly the jobs report!
Ultimately, the hawkish Fed rhetoric suggesting a potential pause next month will likely hinder upside in the yellow metal for now. You will note that Gold is down nearly 3.0% today, and if we see the unit engulf US$4,000 – a widely watched number – and the US$3,886 low formed in late October, this could trigger breakout selling to US$3,748, I believe: an AB=CD completion.
Consequently, while the trend clearly favours buyers in the longer term, we could be in for a little more pain to the downside, especially if we absorb US$3,886 bids.
Written by FP Markets Chief Market Analyst Aaron Hill
 Short
Short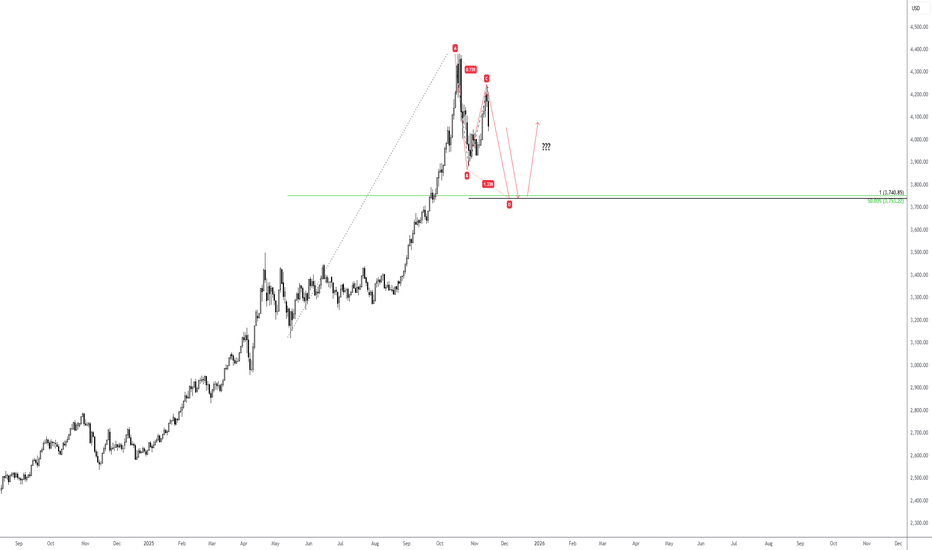
#XRPUSDT: Bullish Reversal Coming With Price Heading Back To 3.5## XRPUSDT Analysis: Long-Term Perspective
In the long term, we anticipate the XRPUSDT price to revert to its all-time high of 3.5. From a fundamental analysis standpoint, we maintain a positive outlook, with the potential for the price to surpass 3.5. We have identified a favourable trading opportunity, as illustrated in the chart.
Our approach is neutral, as the trend remains undecided. Based on the duration of your positions, you can set two targets:
1. **Short-Term Target:** If you intend to hold your positions for a short period, aim for a price level above 3.5.
2. **Long-Term Target:** For long-term investors, a target price of 4.0 or higher is plausible.
We are committed to providing comprehensive analysis and support. Should you have any inquiries or require further clarification, please do not hesitate to contact us.
Additionally, we would appreciate your insights on which cryptocurrency pair you would like to explore next.
Regards,
Team Setupsfx_  Long
Long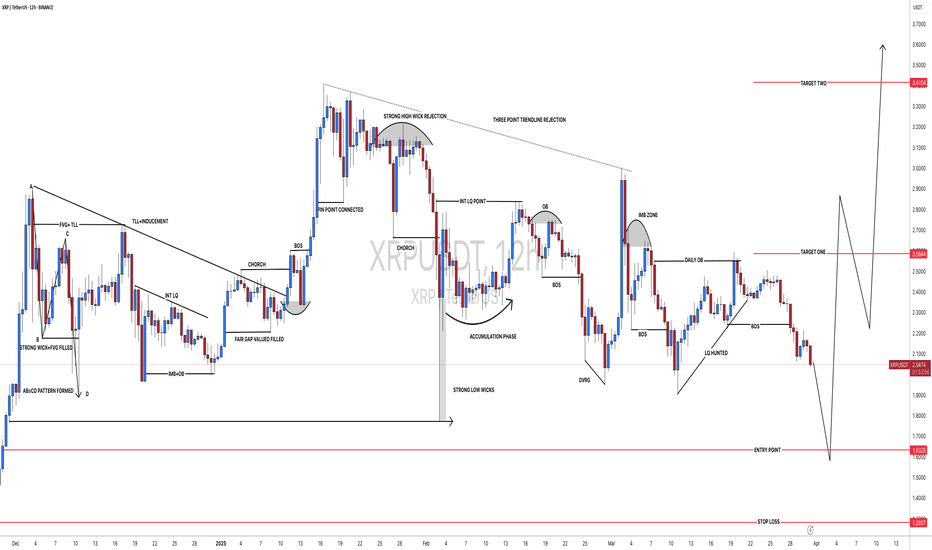
 Long
Long
Long 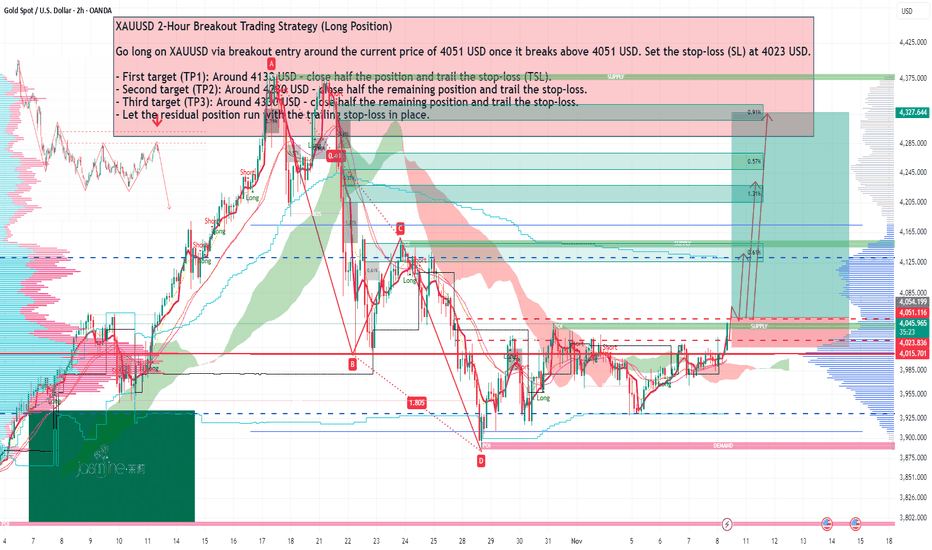
 Short
Short
 Long
Long
Long 
Long 
 Short
Short
Short 
Short 
Best Harmonic Patterns For Beginners in Forex Gold Trading
In the today's article, I will share with you 4 best harmonic patterns for beginners. We will discuss the structure of each pattern and the rules.
Harmonic ABCD Pattern
That pattern is based on 3 legs of a price movement:
AB leg - impulse leg,
BC leg - retracement with the range of XA leg,
CD leg - impulse leg that has the same direction, the same time horizon and the same length as the XA leg
AB and BC legs should be equal or almost equal, that makes the pattern harmonic.
The completion point of the pattern - D point can be applied for predicting a pullback.
ABCD pattern can be bullish and bearish.
In a bullish ABCD pattern, AB leg is bearish.
D point of the pattern will be a safe point to buy from.
In a bearish ABCD pattern, AB leg is bullish.
D point will be a safe place to sell from.
The next 3 patterns will be based on 4 legs of a move:
XA, AB, BC, CD and will have XABCD structure with the initial point of the pattern being X point.
D point will be a completion point of the pattern from where a pullback will be anticipated.
The type of the harmonic pattern will be identified with Fibonacci numbers. The exact placement of each point of the pattern will define the name of the pattern.
Harmonic Gartley Pattern
In Harmonic Gartley,
B point of the pattern should strictly be between 618 and 786 retracement of the XA leg.
C point should lie between 618 and 786 retracement of AB leg.
D point will be 1.272 extension of AB leg.
Bullish Gartley Pattern will be based on a bullish XA leg.
Bearish Gartley will be based on a bearish XA leg.
Harmonic Bat Pattern
In Harmonic Bat,
B point of the pattern should strictly be between 50 and 618 retracement of the XA leg.
C point should lie between 618 and 1 retracement of AB leg.
D point will be 886 retracement of XA leg.
Bullish Bat Pattern will be based on a bullish XA leg.
Bearish Bat will be based on a bearish XA leg.
Harmonic Cypher Pattern
In Harmonic Cypher,
B point of the pattern should strictly be between 382 and 618 retracement of the XA leg.
C point should lie between 1.272 and 1.414 extension of XA leg.
D point will be 786 retracement of XC leg.
Bullish Cypher will be based on a bullish XA leg.
Bearish Cypher will be based on a bearish XA leg.
These patterns are phenomenally accurate and they are very simple to recognize.
❤️Please, support my work with like, thank you!❤️
I am part of Trade Nation's Influencer program and receive a monthly fee for using their TradingView charts in my analysis.
Education 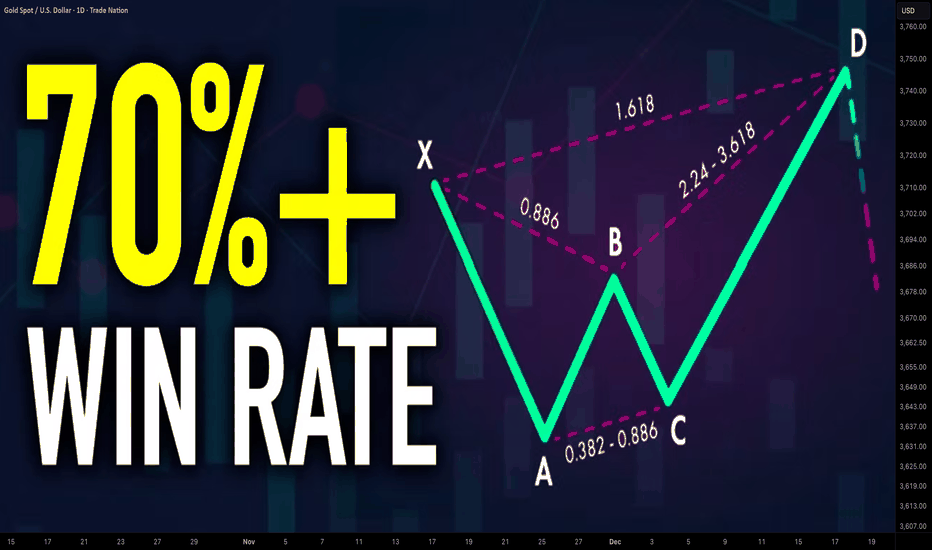
XAU/USD – 4H ABCD Harmonic Pattern | Possible Bullish ReversalXAU/USD – 4H ABCD Harmonic Pattern | Possible Bullish Reversal Toward 4850 🟡📈
Hey traders 👋
Gold has been on an impressive run recently, but now we’re entering a key retracement phase, setting up for what could become a textbook ABCD pattern completion.
The structure suggests that once price finishes its C-leg correction into the highlighted demand zone, there’s room for a strong bullish continuation — potentially extending all the way toward 4850.
🧩 Pattern Structure:
A → B: Strong impulsive move upward, defining the current bullish leg.
B → C: Deep retracement in progress — targeting the golden zone (0.618–0.65 fib retrace).
C → D: Expected next impulse, projected by the AB = CD symmetry and extended fib target (around 1.618).
Once C confirms support and holds within the shaded demand zone, we could see the next leg (D) launch.
📊 Technical Confluence:
Fibonacci retracement: 0.617 aligning with structural support — a high-probability reaction area.
Volume Profile: Strong buying interest clustered in this range, visible on the left-hand histogram.
RSI Divergence Indicator: Showing multiple bullish signals at local lows — early momentum hinting at buyer re-entry.
Market Structure: Uptrend intact on higher timeframes; current move appears corrective, not reversal.
This alignment gives weight to a bullish continuation scenario once the correction completes.
🎯 Trade Outlook
Entry Zone: Around projected “C” completion within the demand box.
Stop-Loss: Below the structural low / invalidation zone.
Take-Profit:
TP1: Near mid-structure resistance.
TP2: Previous high area.
TP3 / Final Target: 4850, projected from the full harmonic leg extension (AB = CD).
This setup offers a massive risk/reward potential, provided confirmation triggers (bullish candles, divergence hold, or breakout of minor structure).
⚠️ Key Notes
If price breaks below the green demand box, the pattern invalidates.
A retest confirmation or divergence hold will increase probability before entering long.
Watching the DXY for additional confirmation — a weakening dollar could accelerate this bullish scenario.
📌 Gold (XAU/USD) – 4H ABCD Setup Building Toward 4850 | Awaiting C-Leg Completion for Long Entry
Are you buying the dip at the C-zone or waiting for bullish confirmation first? Drop your view 👇
#XAUUSD #Gold #HarmonicPatterns #ABCDPattern #TechnicalAnalysis #PriceAction #SmartMoney #SwingTrade #BullishSetup Long 
Short 
Long