HOW-TO: read Plutus's 2 sigma breaches on WTI crude oil, 4HPlutus Flow tracks OBV, volume added on up closes and taken away on down closes, against its own average, with a band two standard deviations either side. When OBV pushes outside a band, Plutus calls it a breach. The script's notes call those zones the exhaustion legs. We measured what a breach tells you on WTI crude oil's 4 hour chart.
We defined turns strictly. A top is a 4 hour high with no higher high for 8 candles either side, that price then fell at least 3 ATR from within 20 candles. A b
Breadth Indicators
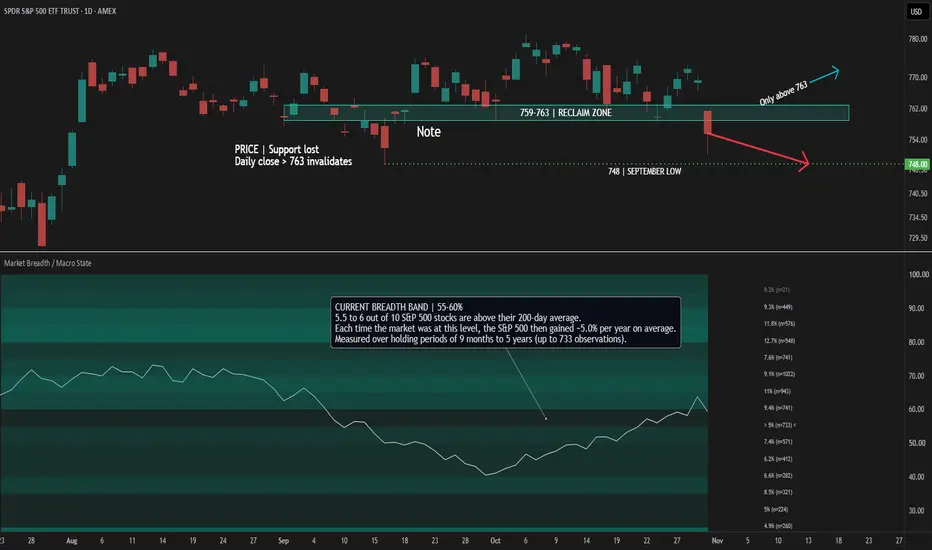
SPY Breaks Support: Breadth Signals CautionSPY has broken below 759-763. But the key message in the lower panel is not simply that breadth has recovered. It is the historical return backdrop associated with its current level.
THE CURRENT READING
Breadth is in the 55-60% band. Under the current settings, this band shows an annualized forward-return estimate of approximately 5.0%, with up to 733 historical observations per horizon. The neighboring 60-65% band shows 9.4% under the same settings.
This illustrates why a rising breadth curv
Renko Charts Are Well-Suited for Identifying Market Trends
Hello, traders!
Welcome, everyone.
By following me, you can always stay up to date with the latest information.
Have a great day!
-------------------------------------
To use Renko charts effectively, we need to understand three types of bricks: the current brick, the upward brick, and the downward brick.
The current brick refers to the brick where the price is currently located.
If the candle has not yet closed within the current brick, the brick will appear faded or semi-transparent.
NIFTY CHEMICALS• Timeframe and Security: Nifty Chemicals Index, Daily (1D) interval.
• Trend Analysis: The index exhibits a prominent bearish trend starting from its peak around August, characterized by a series of lower highs and lower lows, trading well below the Ichimoku cloud structure.
• Key Visual Levels:
• Monthly High: Marked at 30,907.75
• Weekly High: Highlighted at 28,611.1
• Daily High: Indicated at 28,374.4
• Daily Low: Placed at 27,812.95
• Support Zones: Two horizontal support bands are hig
BreakOn Group Examines How AI Companies Technology into RevenueBreakOn Group has published a new analytical article examining the business models used by artificial intelligence companies to generate revenue from AI-powered services, software platforms, and enterprise solutions. The article explores how technology providers convert advanced AI capabilities into commercial products while balancing customer demand, infrastructure expenses, and long-term profitability.
As artificial intelligence becomes increasingly integrated into business operations, compan
Complete Guide to MACD Strategy - Simple Accurate and ProfitableComplete Guide to MACD Strategy - Simple, Accurate, and Profitable Rules
A comprehensive and detailed guide explaining how to trade effectively using the Moving Average Convergence Divergence (MACD) indicator in alignment with overall market structure and price action.
Overview:
The MACD (Moving Average Convergence Divergence) is one of the most reliable momentum and trend-following indicators available to technical traders. While many beginner traders rely solely on generic indicator crosso
NAS100 — Bearish Divergence | Breakdown Sell SetupNAS100 1H: Price remains in a strong bullish structure, but bearish RSI divergence has developed as price pushes into the 30,700–30,770 resistance area, indicating weakening upside momentum. The setup is to sell only after a confirmed breakdown below 30,410.49, with TP1 at 30,063.60 and TP2 at 29,690.31, while Stop Loss is at 30,770.48. The trade is designed to capture a potential corrective move after the extended rally, with the breakdown level providing confirmation rather than entering solel
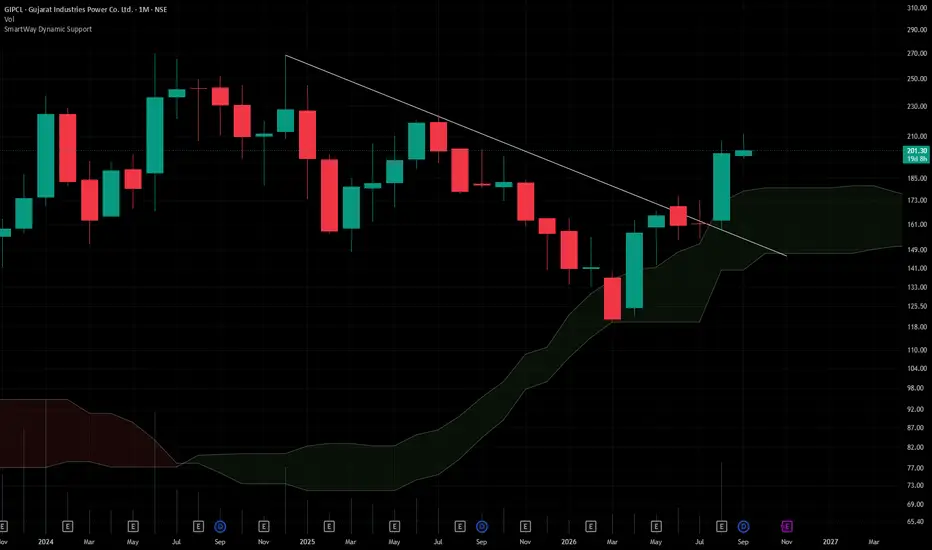
GIPCL## Gujarat Industries Power Company Ltd. (CMP ₹201.00, NSE: GIPCL)
**The SmartWay Research Desk | 11 September 2026**
A Vadodara‑based power generation company, incorporated in 1985. Gujarat Industries Power Company Ltd. (GIPCL) operates **thermal, gas‑based, and renewable power plants**, supplying electricity to Gujarat state utilities and industrial consumers. The company has diversified into **solar and wind energy projects** alongside its lignite‑based thermal stations.
**Promoter Ho
NR Agarwal Industries (NRAIL) - Major Multi-Year Breakout NR Agarwal Industries (NRAIL) - Major Multi-Year Breakout & Structural Turnaround NR Agarwal Industries Ltd. is staging a massive structural turnaround on the monthly chart. The price has successfully cleared its previous 2018 lifetime highs near the ₹530–₹540 zone, turning a 6-year resistance into a powerful new launchpad.
🔍 Key Technical ObservationsThe 2018 Breakout: The stock has finally taken out its major historical peak from 2018. Multi-year breakouts of this scale typically lead to str
Why breadth matters during intraday consolidationTwo consolidations can look pretty similar on the index, but the participation underneath them can be very different.
On the left, SPX spent most of the day chopping sideways after the morning move. Price itself wasn’t giving much away, but breadth remained strong during the consolidation. The range eventually resolved higher.
On the right, the price action looked similar at first: another long intraday consolidation. But participation was much weaker. That setup eventually broke the other way
THE KEY QUESTION: CAN IT ESCAPE THE SHORT-TERM BOTTOM ZONE?
Hello, traders.
If you follow me, you can stay updated with my latest market analysis and trading insights.
Have a great trading day.
━━━━━━━━━━━━━━━━━━━━━━━━━━━━━━━━━━
【 ETH ENTERS A VOLATILITY WINDOW 】
ETH is currently within a volatility window, which is expected to continue through August 28.
However, BTC's volatility window is expected to run from August 27 to August 29.
Therefore, it may be necessary to monitor ETH's price action through August 29 as well.
ETH is currently tradi
DOGE - CAN IT ESCAPE THE SHORT- AND MID-TERM BOTTOM ZONE???
Hello, traders!
If you follow me, you'll be able to catch new market updates and analysis as soon as they're posted.
Have a great day, and I wish you successful trading.
━━━━━━━━━━━━━━━━━━━━━━━━━━━━━━━━━━
Dogecoin (DOGE) is the original meme coin and remains one of the most iconic assets in the crypto market.
With more and more meme coins entering the market and competing for liquidity, it is worth taking a closer look at DOGE's current market structure.
The key question is whether DOG
LINK — Ready for a Full-Scale Bullish Trend???
Hello, traders.
If you "FOLLOW" me, you'll be able to quickly access my latest market updates and analysis.
Wishing you a successful trading day.
---
The most important price level to watch for LINK right now is:
> > > 11.064 <<<
Simply breaking above 11.064 is not enough.
The real question is:
"Can LINK hold above 11.064 and flip this level from resistance into support?"
If the price successfully establishes support above 11.064,
the market structure could begin preparing for a f
HYPE — CAN THE PRICE HOLD ABOVE 73.214?
Hello, traders.
If you "Follow" me, you can quickly receive updates whenever a new analysis is published.
Have a great day,
and I wish you successful trading.
==================================================
■ HYPE : WHAT IS THE MOST IMPORTANT LEVEL AT ATH?
==================================================
There are some coins that continue to move higher as trading activity increases, yet surprisingly, very few people around us seem to actually be trading them.
HYPE, currently ranke
Accumulation Complete??? BTC Is Moving Into the High-Price Zone.
Hello, traders!
If you "Follow" me, you'll be able to receive new market updates and analysis more quickly.
I hope you have a successful trading day.
━━━━━━━━━━━━━━━━━━━━━━━━━━━━━━━━━━
BTC has rebounded from the low-price accumulation zone and has now reached its first major high-price zone.
▶ Low Zone : 69,978.65
▶ 1st High : 71,280.01
In other words,
BTC began its upward move around 69,978.65 and has now touched 71,280.01, the first potential profit-taking level.
This suggests th
THE KEY IS WHETHER PRICE CAN HOLD ABOVE 381.59
Hello, traders.
If you "Follow" me, you'll be able to stay updated with my latest market analysis and trading ideas.
I hope you have a great day and successful trading.
==================================================
■ ASCENDING CHANNEL BREAKDOWN — PREPARE FOR A POSSIBLE CORRECTION
Unfortunately, the price has broken down from the ascending channel and is currently showing a corrective move.
The most important level to watch at this stage is 381.59.
If the price fails to reclaim 381
WHY DID THE MARKET RALLY, AND HOW LONG CAN IT LAST?
Hello, traders.
If you follow me, you'll be able to stay updated with my latest market analysis.
I hope you have a successful trading day.
==================================================
==================================================
Looking at the current crypto market, these are probably the two biggest questions:
"Why exactly is the market going up?"
"And how long can this rally continue?"
Price action alone cannot fully answer these questions.
However, by tracking Money Flo
Can Trend Lines Be Used to Estimate Volatility Windows???
Hello, traders.
If you follow me, you can always get new updates quickly.
I hope you have a great day and successful trading.
━━━━━━━━━━━━━━━━━━━━━━━━━━━━━━━━━━
Trend lines are one of the most basic tools in technical analysis.
But there is an important question:
"What can we actually learn from a trend line?"
When traders first begin studying technical analysis, they usually start with Moving Averages.
After that, their studies often move in one of two directions:
1. Indicator-ba
XRP : SUPPORT AT 1.1237 IS THE KEY
Hello, traders!
If you "Follow", you'll be able to catch my latest market updates quickly.
I hope you have a successful trading day.
---
---
##
XRP has moved above 1.1475 and is attempting to rebound from its short-term bottom area.
However, the current move alone is not enough to confirm a trend reversal.
The most important question in the current price structure is:
> > > CAN XRP ESTABLISH SUPPORT AROUND 1.1237? <<<
In other words, we need to see the following sequence:
1.147
BNB : What is the very important point???
BNB: What Is the Most Important Level from a Mid- to Long-Term Perspective???
---------------------------------------------------------------------
Hello, traders.
If you "Follow" me, you can always get the latest updates quickly.
Have a great day, and I wish you successful trading.
=====================================
The first key zone to watch for BNB is:
▶ 620.0 ~ 656.54
A recent bottom structure has formed across this range.
Therefore, whether BNB can hold this zone as suppo
What Is the Most Important Level at the Current Price???
Hello, traders.
If you follow me, you'll be able to receive new market updates and analysis quickly.
I hope you have a successful trading day.
================================================================
===================================================
The most important price level to watch right now is:
▶ 229,500
Whether price can hold above this level as support could play an important role in determining the next major direction.
More importantly, 229,500 corresponds to th
Time to Focus on Bitcoin's Volatility Window
Hello, traders.
If you follow me, you'll be able to receive new market analyses as quickly as possible.
Wishing you successful trading today.
============================================================
■ ETH VOLATILITY WINDOW
=======================
Ethereum's current Volatility Window is expected to
come to an end around August 13.
The next major ETH Volatility Window is expected around:
▶ August 27
============================================================
■ NOW IT'S TIME TO FOCUS
Is This a Good Area to Trade???
Hello, traders.
If you follow me, you'll be able to receive new market updates and analysis as soon as they're posted.
Wishing you a successful trading day.
==================================================
■ LONG-TERM WAVE STRUCTURE : STILL IN WAVE 1
From a long-term wave perspective,
the current bullish move can be interpreted as Wave 1 of a larger bullish cycle.
In other words, this does not appear to be a mature stage of the long-term uptrend.
Instead, the market may still be in t
Below 0.930: Entering the Mid- to Long-Term Investment Zone
Hello, traders.
If you follow me, you'll be able to receive new market updates and analysis as soon as they are posted.
Wishing you successful trading today.
━━━━━━━━━━━━━━━━━━━━━━━━━━━━━━━━━━
■ Mid- to Long-Term Outlook: Watch Below 0.930
As the price has fallen below the **1.50–1.9669 range**, the market is moving closer to a potential mid- to long-term accumulation area.
In particular,
▶ **Below 0.930**
a further decline could bring the price into a more significant **Mid- to Long-