XAUUSD: Wave 5 Downside Setup After Sell-Zone Retest
Gold is still trading inside a short-term descending channel, and the current structure remains controlled by sellers. From Kelly’s view, the market has already built a clear bearish sequence, and the next important setup is the potential wave 5 decline after price retests the sell zone.
The key idea is simple: do not chase the low. Wait for price to retest resistance, then observe whether sellers step back in.
⟡ Market structure
Price recently rejected from the upper channel area and started moving lower again, confirming that the broader intraday structure is still defensive. The market is now trading below the broken midline, while the marked sell zone around 4,455–4,465 remains the key reaction area.
The current decline appears to be developing in a clean Elliott structure. Price has already completed the early downside legs, and the chart is now preparing for a possible wave 4 retest before wave 5 expands lower.
➤ Key levels
◌ 4,455–4,465: sell zone retest and main reaction area
◌ 4,470: short-term invalidation area
◌ 4,420–4,430: first downside reference
◌ 4,345–4,355: main wave 5 target zone
◌ Above 4,470: area where the bearish setup loses quality
⌁ Elliott Wave view
From an Elliott Wave perspective, gold appears to be forming a bearish 5-wave decline inside the descending channel.
The current movement may be the wave 4 corrective retest into the sell zone. If price reacts from 4,455–4,465 and prints a clear rejection candle, that would support the idea that wave 5 lower is starting.
If wave 5 develops as expected, the downside path may open towards the lower channel target around 4,345–4,355.
▸ Trading scenario
Preferred scenario: wait for price to retest the 4,455–4,465 sell zone and confirm rejection.
Entry zone: 4,455–4,465 after bearish confirmation
Stop loss: above 4,470
Take profit 1: 4,420
Take profit 2: 4,380
Take profit 3: 4,345–4,355
If gold breaks above 4,470 and holds outside the channel pressure, the wave 5 sell setup would weaken and the structure should be reassessed.
⌁ Kelly’s view
For Kelly, this is a sell-the-retest structure, not a chase-the-breakdown setup. The trend is still bearish, but the cleaner entry comes from resistance confirmation, not from selling directly at the low.
If gold retests the sell zone and sellers defend it, wave 5 may begin from there.
Gold remains under downside pressure.
The best sell setup may come after the retest, not before it.
Share your view below.  Short
Short
GOLD - The bearish trend may continue...ICMARKETS:XAUUSD has entered a corrective phase after printing a new local low. Against the backdrop of a strong U.S. dollar, the bearish trend in gold may continue...
Gold has received temporary relief from ceasefire-related headlines, but pressure from the dollar and hawkish Fed expectations remains intact. The key event ahead is Friday’s Non-Farm Payrolls (NFP) report. Geopolitical developments continue to play a decisive role.
Technically, within both the global and local downtrend, gold is consolidating inside the 4425–4550 range. Due to the uncertainty factor, the market has entered a corrective phase and a liquidity-hunting stage, during which it may test either 4496 or 4540 before resuming its decline.
Resistance levels: 4496, 4540, 4589
Support levels: 4456, 4425, 4400
The U.S. dollar remains in stagnation (consolidation) within a bullish trend. The geopolitical backdrop continues to support the dollar and weigh on gold, which is currently in a corrective phase. A short squeeze at 4496 could trigger a decline toward 4425–4400. Additionally, if the market fails to react at 4496, gold may test 4540 before moving lower.
Best regards, R. Linda Short 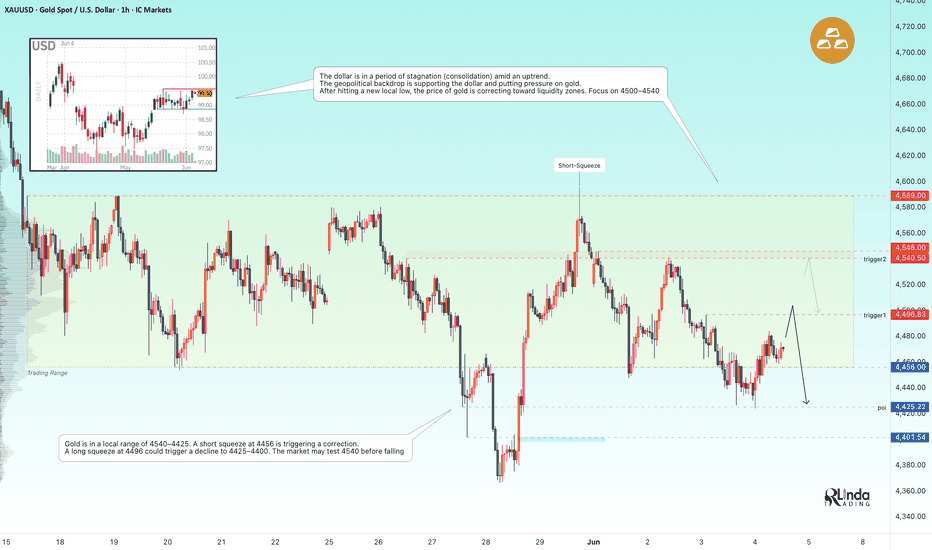
 Long
Long
 Long
Long
 Long
Long
 Long
Long
Short

Long 
XAUUSD Bullish Confirmation May Open the Next Upside Wave
Gold is starting to recover after reacting from the 4,446 buy zone, and the intraday structure is shifting more positively. From Kelly’s view, the main trend for today is leaning bullish, but the cleaner setup still needs confirmation before expecting a stronger move into the upper liquidity area.
The key idea is simple: gold is recovering from support, but buyers need to confirm above resistance before the next wave can expand.
⟡ Market structure
Price has broken away from the lower part of the descending channel and is now testing the upper structure. The reaction from the 4,446 buy zone shows that buyers are defending the lower support area, while the market is slowly building a recovery base.
The current zone around 4,483–4,496 is important because it acts as the bullish confirmation area. If price can reclaim this region with strength, the next upside path may open towards the high liquidity zone near 4,531.
➤ Key levels
◌ 4,446: buy zone and main intraday support
◌ 4,483: bullish confirmation zone
◌ 4,496: next breakout confirmation level
◌ 4,531: high liquidity zone and upside target
◌ Below 4,446: area where the bullish setup weakens
⌁ Elliott Wave view
From an Elliott Wave perspective, gold appears to have completed a bearish corrective sequence near the 4,420–4,446 area. The current rebound may be the beginning of a new bullish wave structure.
If buyers confirm above 4,483–4,496, the next upside phase could develop as a stronger impulsive move, with price targeting the high liquidity zone around 4,531.
If price fails below confirmation and returns under 4,446, the bullish wave count would lose quality and the structure may need to be reassessed.
▸ Trading scenario
Preferred scenario: wait for bullish confirmation above the 4,483–4,496 area before looking for continuation.
Entry zone: after confirmation above 4,483–4,496
Stop loss: below 4,446 or below the confirmed higher low
Take profit 1: 4,496
Take profit 2: 4,531
Take profit 3: 4,550 if momentum expands
Alternative scenario: if gold rejects from 4,496 and loses 4,446, the recovery structure weakens and price may rotate back into the lower channel.
⌁ Kelly’s view
For Kelly, this is a buy-after-confirmation structure, not a blind entry at support. The reaction from 4,446 is constructive, but the market still needs to prove strength above the confirmation zone.
If buyers reclaim 4,483–4,496, the next bullish wave may open towards the 4,531 liquidity area.
Gold is showing recovery signs.
The next clean move depends on confirmation above resistance.
Share your view below. Long 
 Long
Long
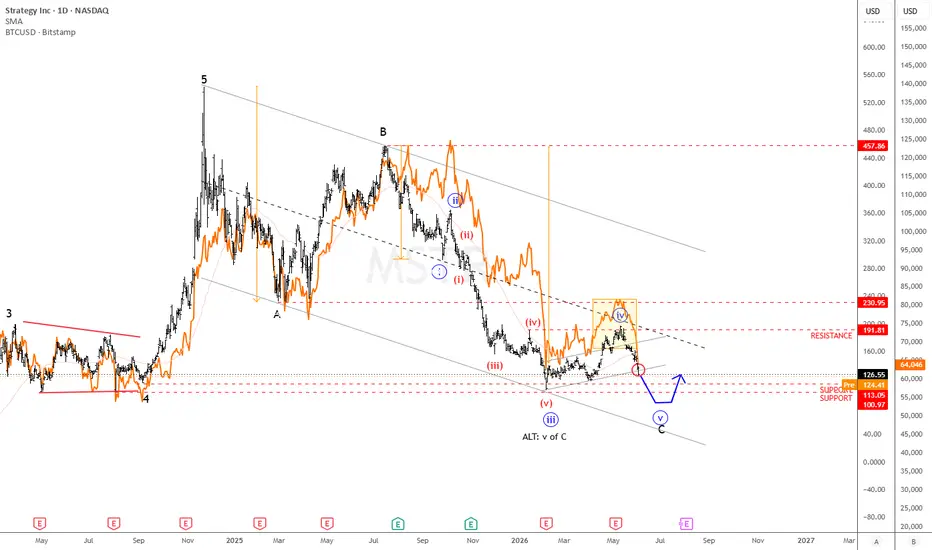
MSTR and BTC Wave Structures Signal Further Downside RiskMicroStrategy (MSTR) has experienced a deep retracement from its 2024 highs, declining by more than 80%, which reflects the extreme pessimism now embedded in the market. Typically, such large drawdowns can precede a reversal phase, and so far the structure does show three clear waves down from the peak. However, the subsequent rebound into the 200 area appears corrective rather than impulsive, suggesting it may represent a fourth wave within a broader bearish sequence rather than a trend reversal. If the current flag structure breaks to the downside on a daily close, it would open the door for a potential fifth wave decline toward the 100 level.
Bitcoin is also showing weakness due to a positive correlation with Microstrategy. It's declining impulsively along with MSTR after a three-wave corrective recovery. We could see another decline this year. If that happens, the key support remains around the 50k-48k area.
Adding to sentiment pressure, MicroStrategy recently sold 32 Bitcoin. While the amount is relatively small in the context of its holdings, it may still carry a psychological impact on market participants given the company’s historically strong association with aggressive Bitcoin accumulation.  Short
Short
Bitcoin Sold Off on News — But This Zone Could Trigger a BounceOver the past two or three days, Bitcoin ( BINANCE:BTCUSDT ) has largely been influenced by news, particularly news of Middle Eastern tensions between Iran and the U.S., and it has started to decline.
Currently, Bitcoin is moving near the support zone($66,400-$64,900) and the Potential Reversal Zone(PRZ) .
From an Elliott Wave Theory perspective, it appears that Bitcoin is completing its Wave 4, which may have a Zigzag correction(ABC/5-3-5).
I expect Bitcoin to rise from the PRZ and reach the Cumulative Short Liquidation Leverage($68,560-$67,550) .
First Target: Cumulative Short Liquidation Leverage($68,560-$67,550)
Second Target: $68,667
Third Target: $69,700
Stop Loss(SL): $65,377(Worst)
Cumulative Long Liquidation Leverage: $65,760-$64,920
What’s your view on Bitcoin? Will it continue its downward trend, or not?
💡 Please respect each other's opinions and express agreement or disagreement politely.
📌Bitcoin Analysis (BTCUSDT), 1-hour time frame.
🛑 Always set a Stop Loss(SL) for every position you open.
✅ This is just my idea; I’d love to see your thoughts too!
🔥If you find it helpful, please BOOST this post and share it with your friends.  Long
Long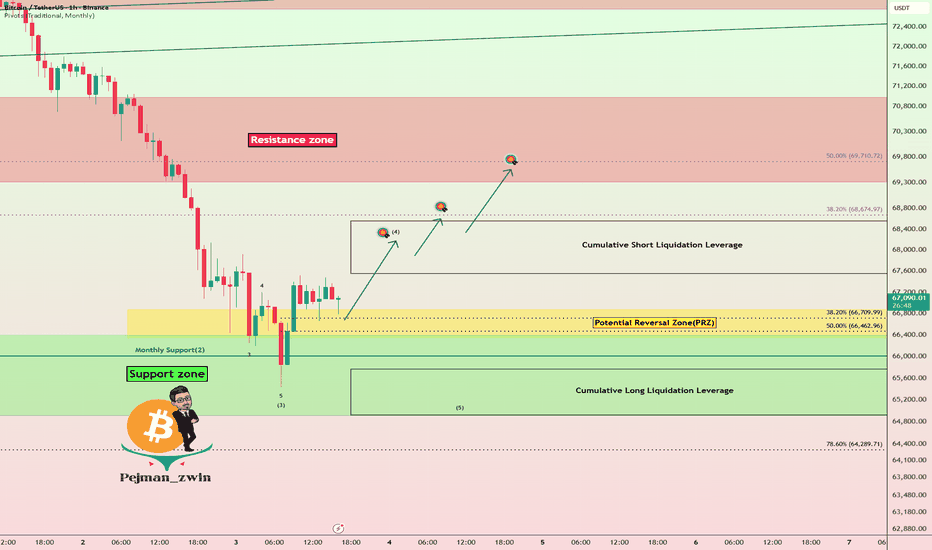
Long 

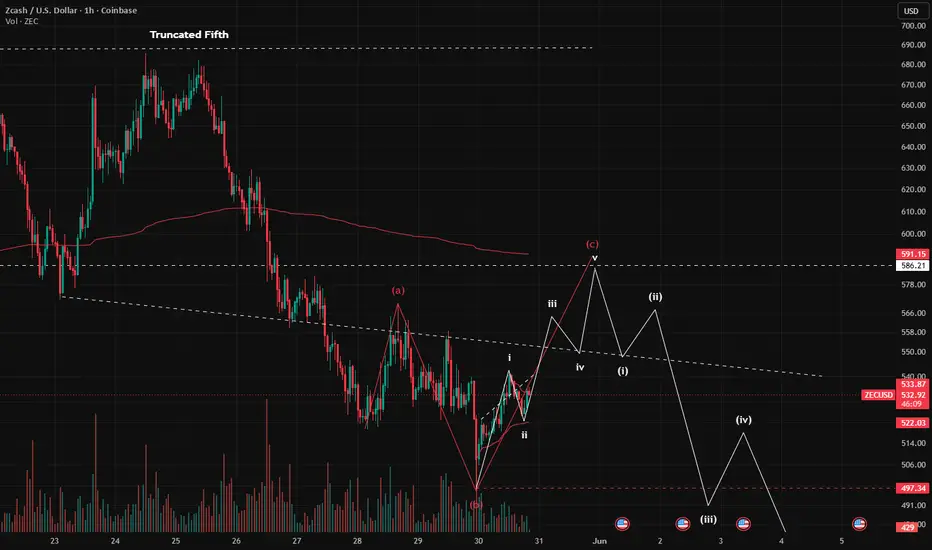
$ZEC - Don't Be FooledFull disclosure I am 1000% a CRYPTOCAP:ZEC bull, you'll find few people who are more bullish on this asset than I am. However, the short-term price action makes it clear, price is in a correctional expanded flat, therefore we're likely to see what looks like the beginning of an impulse but is actually the final C leg of a correctional wave completing before more downside, so caution do not be fooled.
So if you're Zidelined - stay there, likely you'll be able to get some for cheaper prices in the near-term, how bloody we go I am unsure, but I believe it is the perfect spring/correction to happen before we break through solidly into the 4-figure area.
Wave-Count Confidence: Average
Note: My short term count of i - ii may be too early, could see price hit a newer local low such as $516 before taking off.
Heed my warning my fellow zillionairs, I called the last bottom and I am predicting a short-term top in the near future. But of course, I'm not selling any.  Short
Short

 Long
Long