Trading Roadmap | Wave Analysis · Lesson 10 — DiagonalsLesson 10 - Leading and Ending Diagonals
Difficulty: (Advanced)
There is one structure in the whole framework that is allowed to break a rule you have been treating as absolute since Lesson 4. It looks like a wedge, it overlaps where an impulse never should, and it shows up in exactly two places in a sequence. Reading it correctly is often the difference between calling a trend early and calling a top late.
Five legs squeezed between two converging lines, each push covering less ground than the one before it. Waves 1 and 4 share price territory — the overlap that would invalidate a standard impulse. Here it is part of the definition, not a broken count.
🔵 QUICK RECAP FROM LESSON 9
Lesson 9 covered complex corrections — W, X, Y and Z as containers rather than single legs, and the connecting X wave as the place most counts come apart.
That lesson was about corrections growing larger than the label used for them. This one is about a motive structure that behaves, at first glance, exactly like a correction — and the checks that separate the two.
🔵 1. WHAT A DIAGONAL IS
A diagonal is a five-wave motive structure that develops inside converging or diverging boundary lines, and whose legs overlap.
Three features define it:
- Five legs — labelled 1-2-3-4-5 in a motive position, or A-B-C-D-E when it appears as wave C of a correction
- Overlap — wave 4 trades back into the price territory of wave 1, which a standard impulse does not do
- A wedge shape — the boundary line across the ends of 1 and 3 and the line across the ends of 2 and 4 are not parallel
It appears in exactly two positions: at the start of a move (a leading diagonal, in wave 1 or wave A) or at the end of one (an ending diagonal, in wave 5 or wave C). It is not something you will find in the middle of a trend.
🐳 Pro Tip: Position is doing most of the work here. A wedge in a wave 3 slot is more likely a mislabelled correction than a diagonal — the structure is defined by where it sits as much as by how it looks.
🔵 2. THE RULES, AND THE ONE EXCEPTION
Lesson 4 gave three rules. Diagonals keep two of them and are the recognised exception to the third.
- Rule 1 holds — wave 2 does not retrace beyond the start of wave 1
- Rule 2 holds — wave 3 is not the shortest of waves 1, 3 and 5
- Rule 3 is relaxed — wave 4 may enter wave 1 territory, and in a contracting diagonal it typically does
Two working guidelines come with it: in a contracting diagonal each leg tends to be shorter than the one two places before it (3 shorter than 1, 5 shorter than 3), and wave 5 commonly ends near the upper boundary rather than far beyond it.
This is why the exception matters in practice. A count that fails Rule 3 is not automatically dead — it may simply be a diagonal you have not named yet. What it cannot do is fail Rule 1 or Rule 2 and survive.
🐳 Pro Tip: Before using the diagonal exception to rescue a count, check the wedge. Overlap plus converging boundaries plus a first or fifth wave position is a diagonal. Overlap on its own is usually a correction.
🔵 3. THE LEADING DIAGONAL
A leading diagonal takes the wave 1 position of an impulse, or the wave A position of a zigzag. It says the previous trend may be over and a new one may be starting — while most of the market is still reading the move as a bounce.
- Internally the legs commonly subdivide 5-3-5-3-5, though a 3-3-3-3-3 version is also recognised
- The structure often looks laboured and overlapping rather than decisive, which is why it is so frequently dismissed
- What follows is usually a deep wave 2 , often into the 61.8% – 78.6% area described in Lesson 6
- If it is a genuine leading diagonal, the move that follows the correction tends to travel well beyond the diagonal's own extreme
The same wedge in the two positions it can occupy. On the left it opens a sequence — a leading diagonal in the wave 1 slot, followed by a deep second wave and then a far larger third. On the right it closes one, as wave 5 of the advance. Same shape, opposite message, and the only thing separating them is what came before.
🐳 Pro Tip: A leading diagonal is rarely tradeable while it forms — it looks too much like a correction from the inside. Its practical value comes afterwards: it argues that the deep pullback which follows may be a wave 2 rather than a resumption of the old trend.
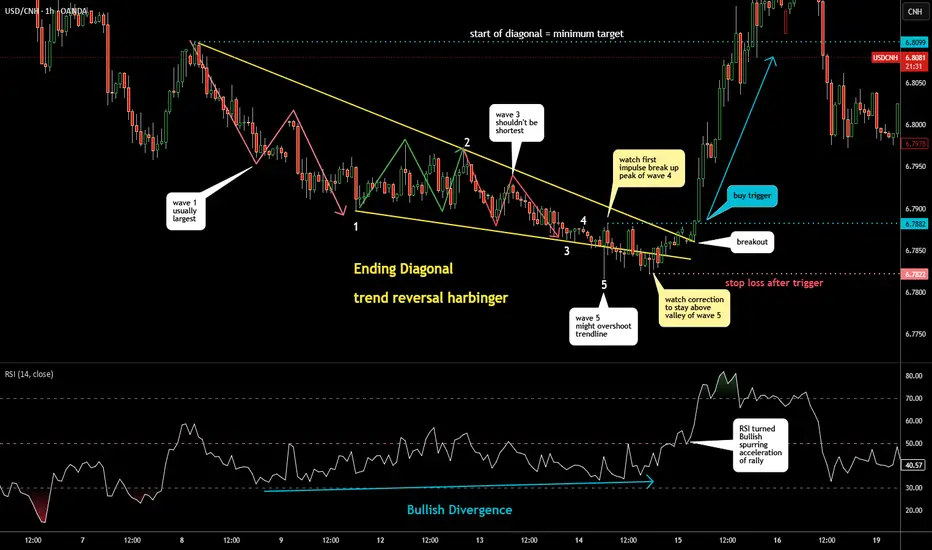
🔵 4. THE ENDING DIAGONAL
The more useful of the two, and the more common. An ending diagonal occupies the wave 5 position of an impulse, or the wave C position of a correction. It says the move is running out of room.
- Its legs subdivide 3-3-3-3-3 — every one of the five is a three-wave structure
- It typically forms after an extended, tiring move, and often shows momentum divergence throughout
- Volume and range usually contract as the wedge narrows
- What follows tends to be sharp — frequently a retracement back to the level where the diagonal began, and often in a fraction of the time the diagonal took to build
That last point is the practical one. The correction after an ending diagonal is generally faster and deeper than the corrections seen earlier in the same sequence.
🐳 Pro Tip: The 3-3-3-3-3 subdivision is the cleanest test available. If the legs of your suspected ending diagonal are subdividing into clean fives, the structure is more likely still a normal impulse — and the top may not be where you think it is.
🔵 5. CONTRACTING AND EXPANDING
Both diagonal types come in two shapes.
Contracting — the boundaries converge, each leg covers less ground than the one two places before it, and wave 5 finishes near the upper line. This is the version encountered most often, in both leading and ending positions.
Expanding — the boundaries diverge, each leg is larger than the one before it, and wave 5 makes a dramatic new extreme. Considerably rarer, harder to work with, and prone to false breaks in both directions — the same character the expanding triangle showed in Lesson 8.
Contracting on the left, expanding on the right. In the contracting version each push loses ground and the boundaries close; in the expanding version each push gains ground and they open. The five-leg count is identical in both — only the proportions change.
🐳 Pro Tip: Expanding diagonals are where stops get taken in both directions before the structure resolves. When the boundaries are widening rather than narrowing, position size tends to matter more than precision on the entry.
🔵 6. THE THROW-OVER
Wave 5 of a contracting diagonal often pushes briefly beyond the upper boundary before the structure resolves. That overshoot is called a throw-over .
- It commonly comes with a spike in volume and a fast, emotional final push
- It frequently produces the momentum divergence that had been building through the wedge
- Price usually returns inside the boundaries quickly — and a decisive move back inside is often the first structural argument that the diagonal is complete
- The subsequent move tends to retrace at least to the origin of the diagonal , and it often gets there far faster than the wedge took to form
Wave 5 pierced the upper boundary, then closed back underneath it within a few bars. The dashed level marks where the diagonal began — the area the decline reached shortly afterwards. The overshoot lasted a fraction of the time the wedge took to build, which is characteristic rather than unusual.
🐳 Pro Tip: A throw-over on its own is not a signal — a wedge can throw over and keep going. It becomes more interesting when price closes back inside the boundaries, because that combination is where the structure and the momentum reading tend to agree.
🔵 7. DIAGONAL OR CORRECTION?
This is where most of the practical difficulty sits. A diagonal overlaps, drifts, and looks messy — which is also a fair description of a correction. A short checklist:
- Position — is this a first or fifth wave slot? A wedge anywhere else deserves suspicion
- Boundaries — do two reasonably clean lines contain the structure? If they take several attempts to draw, they may not be there
- Leg count — five, not three. A three-legged wedge is a correction wearing the wrong name
- Subdivision — 3-3-3-3-3 for an ending diagonal; a leading diagonal may show fives in its motive legs
- What follows — a completed diagonal produces a sharp move in the opposite direction. A correction resolves back into the prior trend
Two structures that look similar at a glance. On the left, five legs contained by two converging lines — a diagonal. On the right, three legs drifting inside a shape that can be made to look like a wedge if you draw the lines generously enough. The leg count is the check that separates them, and it is the one that takes the least judgement.
When more than one of these fails, treating the structure as a correction and waiting is usually the better decision than forcing the diagonal label onto it.
🐳 Pro Tip: The cost of the mistake is asymmetric. Reading a correction as an ending diagonal invites a position against a trend that is still intact — which is a more expensive error than missing a top.
🔵 8. MEASURING A DIAGONAL
The tools from Lesson 6 still apply, with different readings.
- Wave 5 of a contracting diagonal is commonly around 0.618 of wave 3 — a shorter final leg than the equality reading used in a standard impulse
- Wave 4 frequently retraces 61.8% – 78.6% of wave 3, far deeper than the 23.6% – 38.2% typical of a normal fourth wave. That depth is what creates the overlap
- The retracement after an ending diagonal is usually measured against the whole wedge — the origin is the first area to watch, and deeper is common
- Invalidation is unchanged: wave 2 breaking the start of wave 1 ends the count, exactly as in Lesson 4
The two measurements that matter inside a contracting wedge. The fourth wave gave back most of the third — the depth that produces the overlap — and the fifth leg came in clearly shorter than the third rather than matching it. Both are tendencies rather than requirements, and both differ from the readings used on a standard impulse.
🐳 Pro Tip: The deep fourth wave is the tell that arrives earliest. When a fourth wave retraces most of the third and the boundaries are converging, the diagonal reading is worth putting on the chart before wave 5 completes.
🔵 9. READING THE STRUCTURE WITHOUT THE LABELS
Everything above rests on labels you placed yourself, on a structure whose defining feature is that it breaks the usual rule. That makes a second opinion more valuable here than anywhere else in the course.
Market structure is that second language. It asks only whether the market is still taking out its prior swings in the same direction.
What a diagonal looks like structurally.
Read this way, a contracting diagonal is a stretch where each new extreme is reached by a smaller margin than the one before it , while the pullbacks between them cut deeper into the previous leg. Structure is still breaking in the trend direction, but it is breaking by less each time, and being retraced by more. That combination — continuation with deteriorating margin — is a fairly precise structural description of exhaustion, and it does not require a single wave label.
The turn.
The move that follows a completed ending diagonal is usually the first change of character in the sequence: the first break of a swing low that the advance had been defending. It tends to arrive shortly after price closes back inside the boundaries, which is the same event described twice.
Levels that predate the count.
The origin of a diagonal is not only a wave label — it is usually the area where the prior leg accelerated away from, and it exists on the chart before any counting begins. That is part of why the retracement after an ending diagonal so often reaches it.
The same advance read in two languages. Above the candles, a five-wave count. Underneath it, no labels are needed: each new high registers as a break of structure in the same direction, the margins between them narrow as the advance matures, and the first break of a defended low — the change of character — arrives only after the sequence has already stalled. The horizontal zones were drawn from earlier structure, before any counting began. Neither reading proves the other; they describe the same exhaustion from different starting points.
🐳 Pro Tip: The bridge to Section 6 is direct. A throw-over that fails is, structurally, a new extreme that immediately gives way — a break of structure with no follow-through. The two languages call it different names and mark the same bar.
🐳 Pro Tip: Use the disagreements. If the count says an ending diagonal is complete but structure is still breaking cleanly upward by a healthy margin, the count is the reading to recheck first.
🔵 COMMON MISTAKES
- Calling any wedge a diagonal without checking its position in the larger sequence
- Using the Rule 3 exception to rescue a count that has no converging boundaries
- Reading a three-legged wedge as a diagonal when it is a correction
- Treating a throw-over as a top before price closes back inside the structure
- Expecting an ending diagonal's legs to subdivide into fives
- Shorting a leading diagonal as though it were an ending one
- Applying the standard wave 5 equality projection inside a contracting diagonal
- Letting the wave count be the only reading on the chart, so nothing independent can disagree with it
🔵 QUICK SELF-CHECK
- Find a completed trend and look at the final leg — does it wedge, and do waves 1 and 4 overlap?
- Count the legs inside each of the five: threes throughout, or fives?
- Draw the two boundaries and check whether they converge or diverge
- Measure wave 5 against wave 3 and see how close 0.618 came
- Mark the origin of the wedge and check where the move that followed reached
- Check whether wave 2 respected the start of wave 1 — the rule that still applies
- Describe the same stretch structurally: are the new extremes arriving by smaller margins?
🔵 WHAT IS NEXT
Lesson 11 — Counting Across Timeframes: how a count on the daily chart relates to the one on the hourly, what wave degree actually means in practice, and why most counting arguments turn out to be two people reading the same chart at different degrees.
Worth sitting with: the structures that break the rules are usually the ones the framework understands best. It is the ones that fit perfectly, in hindsight, that deserve the second look.
Full Trading Roadmap | Wave Analysis Course
Trading Roadmap | Wave Analysis · Lesson 01 — Wave Analysis Foundations
Trading Roadmap | Wave Analysis · Lesson 02 — Impulse Waves (5-Wave Structure)
Trading Roadmap | Wave Analysis · Lesson 03 — Corrective Waves (A-B-C)
Trading Roadmap | Wave Analysis · Lesson 04 — The Rules of Elliott
Trading Roadmap | Wave Analysis · Lesson 05 — Wave Personality
Trading Roadmap | Wave Analysis · Lesson 06 — Fibonacci with Elliott
Trading Roadmap | Wave Analysis · Lesson 07 — Extended Waves
Trading Roadmap | Wave Analysis · Lesson 08 — Corrective Triangles
Trading Roadmap | Wave Analysis · Lesson 09 — Combinations and Complex Corrections
Best Regards, BigBeluga 🐳  Education
AAPL 4H — Nested Structure or Final Diagonal?🍎 AAPL 4H — Nested Structure or Final Diagonal?
In this update, the main focus is on the current price structure and what the market needs to show to confirm the wave count.
The aggressive scenario is currently focused on a nested structure across two degrees:
1-2 / 1-2
In this interpretation, the current decline could be a three-wave corrective structure. If this decline completes in three waves and price then begins to advance again, that behavior could provide important confirmation of the nested 1-2 / 1-2 structure.
At the same time, the proportion and equality between these two structures could also support the possibility of an Expanded Leading Diagonal.
So for now, there is no need to make a final choice between these possibilities. What matters most is the Price Action and the development of the lower-degree subdivisions.
If we see another decline and that decline develops as a three-wave structure, the 1-2 / 1-2 scenario gains more credibility and could set the stage for a stronger advance of Wave 3.
The conservative scenario follows a different path.
Here, we assume that price is developing an Expanded Ending Diagonal. In this case, the current decline could continue, followed by the final wave of the ending diagonal.
An interesting point is that the appearance of the structure can also depend on the type of chart being used. On the Arithmetic chart, the structure may appear as an Expanded Ending Diagonal, while on the Logarithmic chart, due to the different price scale and Fibonacci relationships, the same movement may look more like a Converging Leading Diagonal.
So for now, we have a roadmap, not a fixed prediction.
Price action, Fibonacci relationships, and the completion of lower-degree waves will tell us which path is actually developing.
For now, I am focusing on the aggressive scenario and allowing the market to reveal the structure on its own. If the structure changes, our wave count must change with it.
This is where the Wave Principle really becomes meaningful:
We don't force the market to follow our count.
We learn to read the structure the market is actually creating.
Patterns whisper… and I listen.
— Mr. Nobody
Apple Inc
yesterday
AAPL: The Final Wave III?
 Long
Long
NASDAQ: The Wave Structure Is TalkingOn the larger degree, NASDAQ is still developing within a large impulsive structure, and what matters most right now is the Third Wave still unfolding. It has not yet reached a point where we can reasonably declare it complete simply based on wave proportions.
The daily chart tells a similar story on a lower degree. After Wave II, the market has continued developing impulsive structures, and more recently we can see several nested 1–2 structures. If this count remains valid, these nested structures could be preparing the market for a stronger Third Wave at lower degrees.
The channels and horizontal levels on the chart are not there simply as targets. They are structural decision points. The market needs to show whether it can respect the base channel, break previous highs, and continue developing impulsively while maintaining proper wave proportions.
Now comes the more interesting part.
When we look across the broader equity market, DAX, S&P 500, Apple, and Tesla are also showing structures that, according to their individual counts, can be interpreted as nested structures or diagonals.
This does not mean they have a 100% correlation or that their wave counts must be identical. Different markets can develop at different degrees and on different timelines. But when several major markets begin showing similar structural characteristics, they are worth watching as an important intermarket structural clue.
And this leads to one important question:
Is the diagonal Leading or Ending?
If the structure ultimately confirms a Leading Diagonal, it could become part of a larger impulsive advance, potentially followed by a stronger Third Wave.
But if the structure develops the characteristics of an Ending Diagonal, the story changes. The market could still make new highs, while simultaneously approaching the final stages of a larger structure.
So a new high alone is not enough to conclude that the market has entered a powerful Third Wave.
Structure matters more than price.
As long as NASDAQ maintains its channel and impulsive structure, and these nested 1–2 sequences develop into stronger Third Waves, the continuation scenario remains favored.
But if increasing overlap, corrective price action, and diagonal characteristics begin to appear, the conservative scenario deserves more weight.
So the roadmap is simple:
We follow the structure—not the prediction.
NASDAQ, DAX, S&P 500, Apple, and Tesla do not have to move in exactly the same way. But if their structures begin confirming the same larger idea, they may become different pieces of the same puzzle.
Ultimately, the market itself will decide whether we are witnessing a powerful Third Wave or the final stages of a diagonal structure.
— Mehdi Abbasi | Mr. Nobody EWP
US 100 Cash CFD
yesterday
NASDAQ: The Third Wave Isn’t Done
 Long
Long
Bitcoin Coils Inside a Triangle — Is a Major Breakout Coming?Bitcoin ( BINANCE:BTCUSDT ) is currently trading near the Support Lines while forming a Symmetrical Triangle close to the upper trendline of the Descending Channel.
Over the weekend, price action has remained compressed, suggesting that a larger directional move could be approaching.
Can Bitcoin hold the Support Lines and break above the Descending Channel?
Technical Analysis
From an Elliott Wave perspective, Bitcoin also appears to be forming a Contracting Triangle, which could complete Wave B and set the stage for the next Impulsive Wave.
Inside the triangle, BTC is trading near the key trading level of $63,345.
💡 Educational Note: A Contracting Triangle often develops during corrective phases and typically precedes the final move in the direction of the larger structure once price breaks out.
I expect Bitcoin to break above the upper trendline of the Descending Channel and rise at least toward $63,400.
If BTC successfully breaks the key trading level of $63,500, the bullish move could extend toward the Cumulative Short Liquidation Leverage zone.
Trade Setup
First Take Profit(TP): $63,400
Second Take Profit(TP): Cumulative Short Liquidation Leverage($63,680-$63,550)
Stop Loss(SL): $62,767
Key Trading Levels: $63,345 _ $63,500
Which level do you think Bitcoin will reach first?
🟢 $63,680
🔴 $62,767
📌 Bitcoin Analysis(BTCUSDT), 1-hour time frame.
🛑 Always use proper risk management and set a Stop Loss(SL) for every position.
🚀 If this analysis helps your trading plan, a BOOST would help more traders discover it.  Long
Long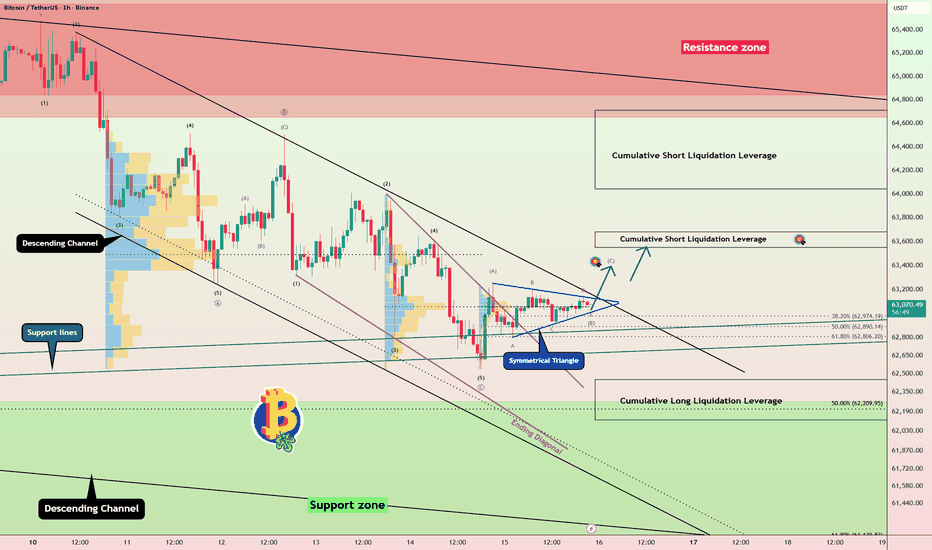
RBOB Gasoline | Wave II… or Something More?In this count, the initial motive structure is interpreted as a Classic Impulse, with Wave 5 completing as an Ending Diagonal after the sharp acceleration of Wave 4, ultimately reaching the peak at the beginning of 2026. From there, the market entered a corrective decline, and price is now approaching a critical structural area.
To complete a full eight-wave cycle, the internal structure of the correction becomes particularly important. In the current count, Wave A developed as an impulse, followed by Wave B forming a Double Zigzag. The decline that followed may have already completed in this area, meaning that Waves I and II of the higher degree could now be complete.
However, we cannot assume that Wave II is finished yet. The market must confirm this possibility through price action. If a clear impulsive advance develops from the current area—especially if the structure begins forming nested 1s and 2s across multiple degrees—it could provide the first meaningful confirmation that Wave II has ended and a powerful Wave III is beginning.
Under the aggressive scenario, we would expect such confirmation to be followed by a complete motive structure and then a correction proportional to the degree of the advance. Therefore, a simple rise in price is not enough for us. Structure, momentum, and the development of a clear 1–2 sequence followed by a powerful third wave are what truly matter.
The conservative scenario, however, still allows for further downside within the bearish structure. The current decline may represent only part of Wave C, meaning the market could require another Classic Zigzag to complete Wave II. We also cannot completely rule out the possibility of an Ending Diagonal or even a new sideways structure within Wave B. Until the final structure becomes clear, all of these possibilities remain open.
Therefore, the key distinction between the two scenarios will be price action from the current area. Under the aggressive scenario, we need to see a clear impulsive move—ideally one capable of revealing nested 1s and 2s across multiple degrees, followed by a powerful third wave. If the market fails to produce such a structure and instead continues lower, the conservative scenario and the possibility of a deeper correction will become increasingly important.
The behavior of crude oil is also an important factor. If crude oil enters a strong bullish advance, we would expect gasoline to eventually follow—whether simultaneously, slightly earlier, or with a modest delay. But if crude oil fails to establish a strong bullish market, any bullish move in gasoline should be examined more carefully, and the completion of Wave II would remain questionable.
For now, we do not want to force either count onto the market. The aggressive scenario considers Wave II complete and Wave III beginning; the conservative scenario remains focused on a deeper correction and further development of Wave II. What separates these scenarios will not be our prediction, but price action and the actual wave structure that unfolds next.
The market must provide the answer. If Wave III is truly beginning, its impulsive structure should gradually reveal itself. If Wave II is not yet complete, the complexity of the correction will eventually become visible through price structure.
Patterns whisper. I listen.
— Mr. Nobody
Gasoline
3 days ago
RBOB Gasoline | Is Wave III About to Begin?
Gasoline
Dec 28, 2023
Impulse Wave Now Three Waves Corrective
 Long
Long
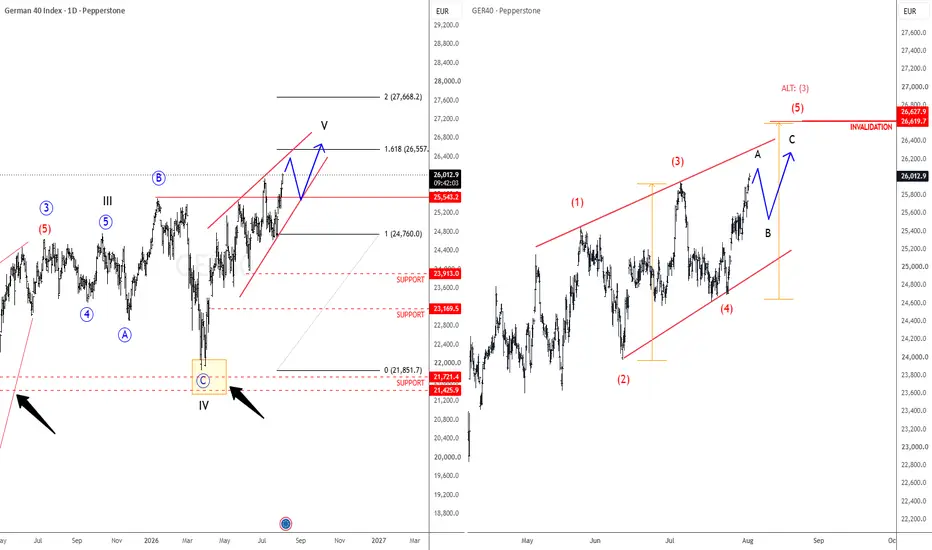
DAX Pushes Toward New Highs, But Wedge Pattern Can Limit UpsideThe German DAX continues to push higher and is now challenging the previous highs. While the current choppy recovery suggests that the upside move may not be finished yet, traders should remain cautious as the potential upside could be limited.
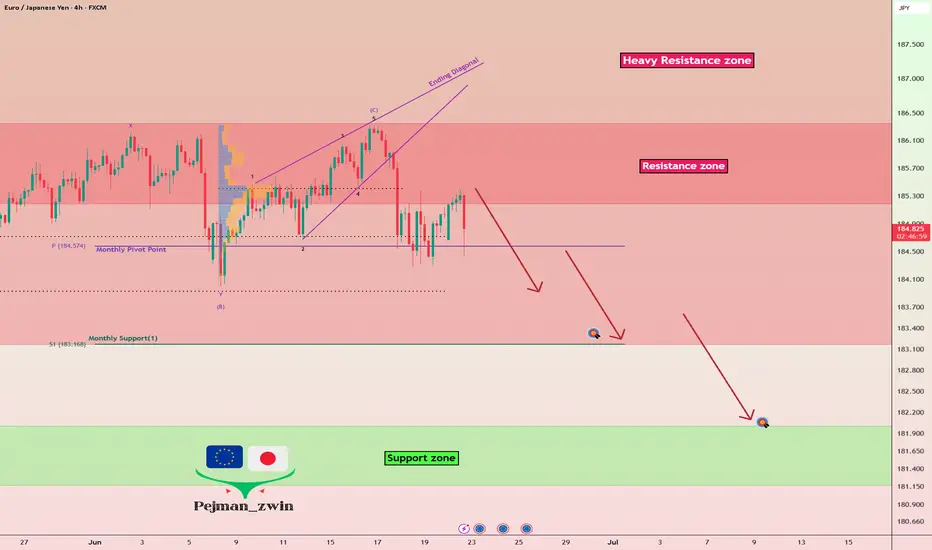
Looking at the latest price action, the structure increasingly resembles an ending diagonal a.k.a. wedge pattern. In this scenario, DAX would now be trading within the final wave five of this wedge formation, meaning that the remaining upside could be part of the last stages of the advance.
Important resistance is located around the 26,200–26,500 area, where the index could complete an ABC formation within the final fifth wave higher. If this scenario plays out, we could see a slowdown and a larger corrective phase after the pattern fully matures.
For now, momentum remains positive, but the current structure suggests that chasing the upside at these levels carries increasing risk, especially as price approaches the projected resistance zone.  Long
Long
S&P 500 at Potential Reversal Zone—Is a Bigger Correction Next?The S&P 500 ( FOREXCOM:SPX500 ) reacted strongly to the recent support zone($7,463-$7,430) and Support Lines, which led to another bullish move. However, the index is currently trading near the key trading level of $7,500 and the Potential Reversal Zone (PRZ) .
From an Elliott Wave perspective, Wave C appears to have been completed through an Ending Diagonal pattern. The lower trendline of this pattern has already been broken, and the S&P 500 is currently pulling back to retest it.
I expect the S&P 500 to break below the support zone($7,463-$7,430) and support lines in the coming sessions and decline at least toward the $7,413 level.
Target: $7,413
Stop Loss(SL): $7,548
Note: Since tensions in the Middle East continue to escalate, any related news could have an immediate impact on the S&P 500. Therefore, be sure to monitor geopolitical developments closely and manage your risk carefully.
Note: If the S&P 500 begins to decline with strong bearish momentum, it could have a rapid and direct impact on the cryptocurrency market, especially Bitcoin ( BINANCE:BTCUSDT ).
What’s your view on the S&P 500? Do you think it can print new all-time highs again, or should we expect a deeper correction?
💡 Please respect each other's opinions and express agreement or disagreement politely.
📌 S&P 500 Index Analyze (SPX500USD), 4-hour time frame.
🛑 Always set a Stop Loss(SL) for every position you open.
✅ This is just my idea; I’d love to see your thoughts too!
🔥 If you find it helpful, please BOOST this post and share it with your friends.  Short
Short
Impulse, Diagonal, or a Larger Correction?Crude Oil (USOIL)Crude Oil (USOIL) – 4H Elliott Wave Update
Impulse, Diagonal, or a Larger Correction?
The recent decline may have completed either Wave II of a developing bullish cycle or Wave b within a larger corrective structure. At this stage, both interpretations remain valid, and the market has not yet provided enough structural evidence to confirm either scenario.
If the bullish count is correct, the next advance could unfold in more than one form.
The most straightforward scenario is a classic five-wave Impulse. However, Elliott Wave Principle also allows another possibility that deserves careful attention: Wave III itself may develop as a Diagonal.
Depending on how the structure evolves, this diagonal could appear as:
A Leading Diagonal, particularly if it marks the beginning of a larger fifth wave.
An Ending Diagonal if the market gradually loses momentum.
An Extended Ending Diagonal.
A Contracting Ending Diagonal, which currently appears to be the more probable diagonal variation.
In each of these diagonal structures, the internal subdivision would follow the familiar 3-3-3-3-3 sequence rather than the traditional impulsive subdivision.
On the other hand, if geopolitical conditions, supply disruptions, or market psychology suddenly intensify, the advance may instead develop into a powerful classic Impulse, producing a much stronger acceleration than a diagonal would normally suggest.
The projected path shown on this chart represents only a schematic illustration of a possible bullish sequence. It should not be interpreted as the exact path price must follow. As the structure develops, each wave may become more complex and subdivide into additional internal degrees.
For now, the primary objective is much simpler.
The market should first reach the initial target zone and successfully break above the previous Wave B, currently labeled as Wave III on this count. Only after that structural confirmation will higher Fibonacci objectives become increasingly reliable.
Alternative Corrective Interpretation
Another possibility is that the correction is not developing as a Zigzag at all.
Instead, it may be forming a Flat Correction—possibly even an Expanded Flat.
One reason this scenario deserves consideration is that Wave A retraced nearly 90%, behavior that remains consistent with several Flat variations. Although the structure currently appears somewhat irregular, Elliott Wave guidelines recognize that Flats can often develop with a relatively "messy" internal appearance.
If this interpretation proves correct, the equality relationships between corrective waves may become more reliable than extended Fibonacci projections during the early stages of the new advance. Until the market clearly reveals the character of the next motive structure, these proportional relationships deserve close attention.
The Conservative Scenario Remains on the Table
Despite the increasing probability of a bullish reversal, the conservative scenario shared in my previous long-term analysis remains completely valid.
Under that interpretation, the entire decline may still represent only Wave (II) of a larger degree, unfolding as a Classic Zigzag before the next long-term bullish cycle begins.
For those interested in the broader context, I encourage reviewing my previous long-term Crude Oil analysis, where this conservative roadmap is discussed in greater detail.
Final Thoughts
At this stage, the objective is not to predict the exact path of the market.
It is to recognize the structures that remain valid, identify the levels that confirm or invalidate each scenario, and allow price action to reveal the true character of the developing trend.
Sometimes the market advances through a clean Impulse.
Sometimes it progresses through a slow and overlapping Diagonal.
The difference is not only in price—it is in the character of the wave.
Patterns whisper. I listen.
— Mr. Nobody  Long
Long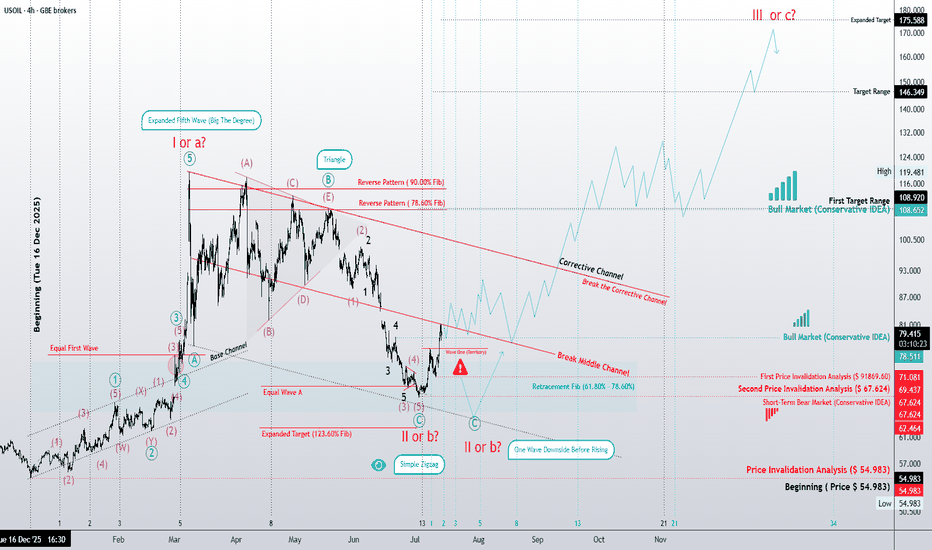
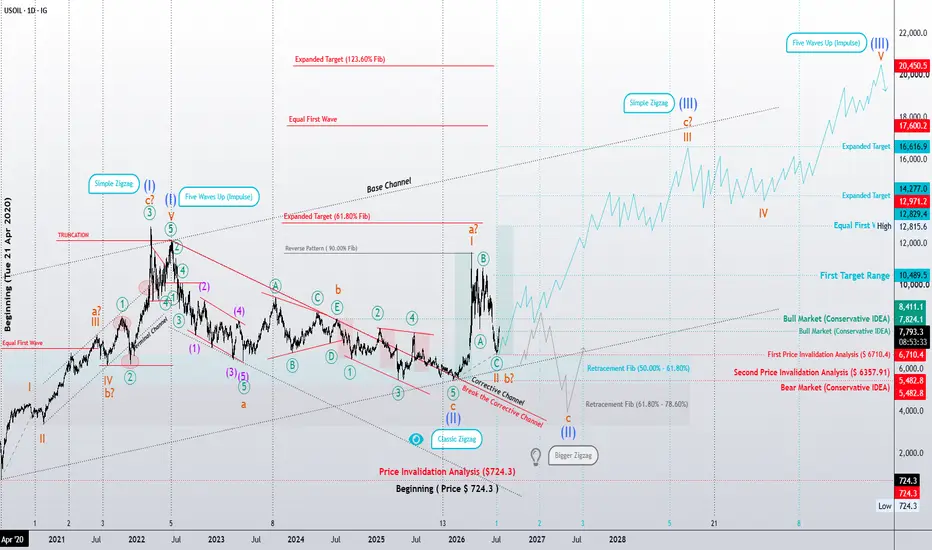
Reading the Character of the Next Market CycleCrude Oil: Impulse or Diagonal? Reading the Character of the Next Market Cycle
In my previous long-term analysis, the primary expectation was that crude oil was developing the final fifth wave of the largest degree as a classic Impulse. If that interpretation proves correct, the long-term bullish outlook remains valid and significantly higher price objectives could still become achievable over the coming years.
However, as the market structure continues to evolve, another equally valid Elliott Wave scenario deserves serious consideration.
Rather than unfolding as a traditional impulse, the final advance may develop as a Diagonal. At this stage, the structure could take the form of an Ending Diagonal, an Extended Diagonal, or—most likely—a Contracting Diagonal (wedge).
If this scenario unfolds, the long-term bullish outlook remains intact. The difference lies not in the direction of the trend, but in its character. Instead of a fast, decisive advance, price may continue to climb through an overlapping, grinding, and increasingly exhausting structure—behavior that is typical of terminal diagonals.
At the same time, the conservative scenario remains fully valid.
Under this interpretation, the decline from the previous major high represents only Wave A of a larger corrective structure. The following rally retraced more than 90% of that decline and reached approximately 11,555.4, a behavior that remains consistent with several corrective formations.
As a result, the current decline could be developing as an impulsive Wave C of a Classic Zigzag (A-B-C). Alternatively, it may become part of a larger Double Zigzag correction.
Another possibility that should not be overlooked is the development of a Flat correction—either a Regular Flat or an Expanded Flat. In such a case, Wave C could itself unfold as an Expanding Ending Diagonal. Although less common, this structure is fully consistent with Elliott Wave guidelines and is often characterized by increasing volatility, broadening price swings, and persistent overlap between waves.
At this stage, no single scenario has been confirmed. The evolution of price structure—and respect for key invalidation levels—will ultimately determine which path the market chooses.
Beyond Price: Studying the Character of Waves
Over the years, my research has gradually moved beyond simply counting waves or projecting price targets.
One question continues to capture my attention:
Can market structure reveal not only where price may go, but also the character of the environment in which future market cycles will unfold?
This is why I spend as much time studying the character of waves as I do their labels.
Many traders assume that every impulse must resemble the textbook ideal. My observations suggest otherwise. Every market has its own personality. Some trends unfold with exceptional strength and clarity, while others advance through prolonged overlap, hesitation, and exhaustion.
Perhaps these differences are not random.
Financial markets do not exist in isolation. They constantly interact with one another. Sometimes they move together through positive correlation. Sometimes they move in opposite directions. At other times, these relationships strengthen, weaken, or even reverse as global economic conditions evolve.
Understanding these relationships is far more complex than identifying a wave count, and I believe there is still much to discover.
In the case of crude oil, for example, a prolonged period of geopolitical tension, recurring disruptions to strategic energy routes, political conflicts, or a sustained war of attrition could create market conditions that are more consistent with the personality of an Ending Diagonal than with a clean, explosive impulse.
Conversely, an abrupt and severe supply shock could produce the kind of powerful momentum more commonly associated with a classic Impulse.
This is not an attempt to predict geopolitical events.
Rather, it is an attempt to understand whether market structure may reflect changes in collective psychology before those changes become fully visible through headlines and economic data.
This remains an ongoing personal research project rather than a definitive conclusion. My objective is not simply to forecast price, but to better understand the relationship between wave structure, crowd psychology, intermarket behavior, and the broader forces shaping future market cycles.
Perhaps markets do more than anticipate price.
Perhaps they also whisper something about the future itself.
Patterns whisper. I listen.
— Mr. Nobody
CFDs on Brent Crude Oil
Jun 6
Crude Oil: The Long-Term Elliott Wave Projection
CFDs on Crude Oil (WTI)
7 days ago
US Oil (WTI) – 4H Elliott Wave Update
Long 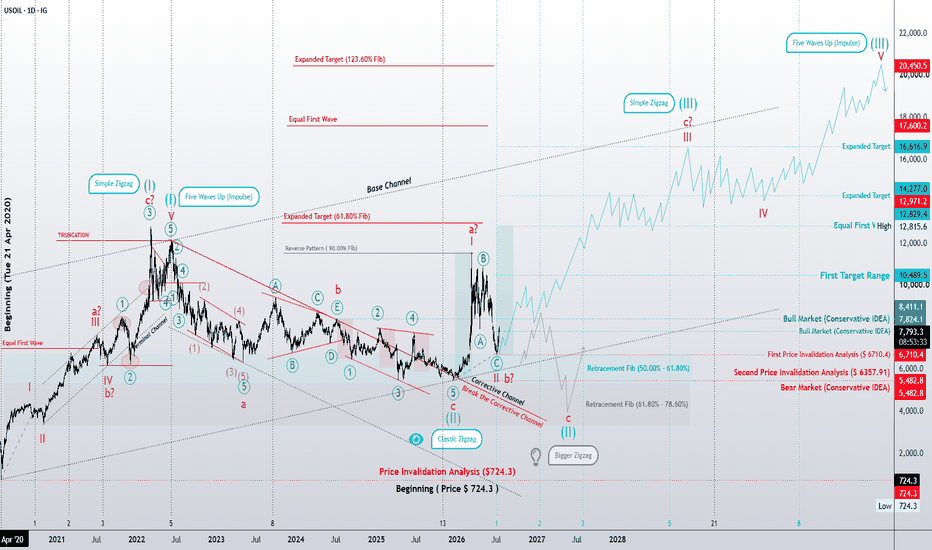
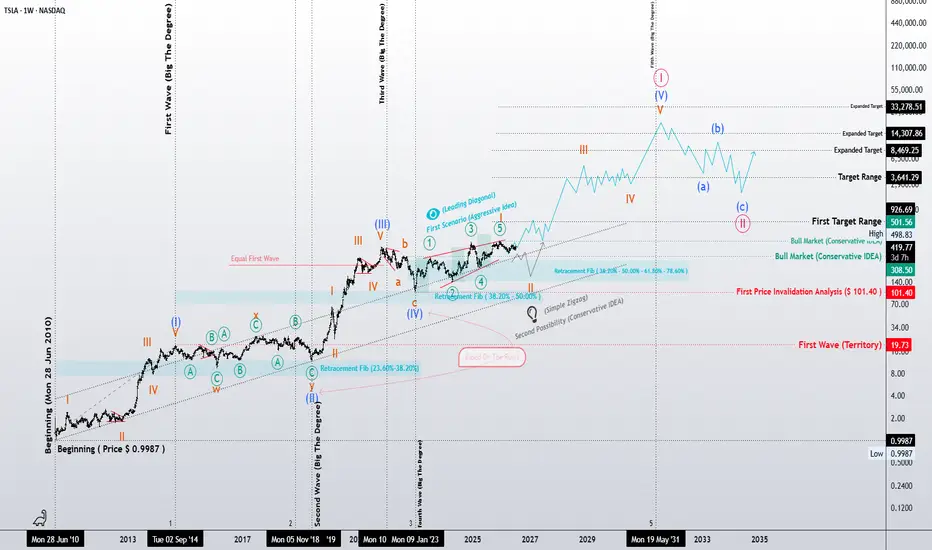
TSLA: A Structural Blueprint of the Grand Cycle
"Price is the consequence. Structure is the cause."
This analysis is not a simple price forecast. Rather, it is a structural study of Tesla's position within its Grand Cycle through the principles and guidelines of Elliott Wave Theory.
Since its 2010 low, Tesla has developed a sequence of impulsive and corrective waves, each forming part of a much larger market geometry. The objective of this study is to identify the market's current position within that hierarchy and explore the most probable paths ahead based on wave structure, Fibonacci relationships, and Elliott Wave principles.
Aggressive Scenario (Turquoise Path): A Developing Leading Diagonal
The primary interpretation assumes that Primary Wave (IV) has already completed and the market has begun constructing a Leading Diagonal, marking the first phase of a new higher-degree impulsive cycle.
Within Elliott Wave Theory, a Leading Diagonal typically emerges at the beginning of a new trend, when market sentiment remains uncertain and confidence has yet to fully return. Rather than signaling weakness, this structure often reflects the gradual transition from accumulation toward expansion.
The key question is therefore:
Has the current correction already fulfilled the structural requirements of a Leading Diagonal?
If the answer proves to be yes, Tesla may already have established the structural foundation for the next higher-degree advance, potentially leading into a powerful Primary Wave (III), which is often the strongest and most dynamic phase of an impulsive sequence.
Conservative Scenario (Blue Path): The Correction May Require Further Development
The conservative interpretation remains equally bullish over the long term but suggests that the current correction may not yet be structurally complete.
Under this scenario, the market could still require a more mature corrective formation, such as:
Zigzag
Flat
or a more complex corrective combination
Once that correction is completed—while respecting Elliott Wave rules and structural guidelines—the market would still be expected to follow the same long-term bullish path illustrated by the aggressive scenario.
In other words, the destination remains the same. The only difference lies in the maturity, depth, and internal structure of the current correction.
Key Structural Levels
Structural Invalidation Level: 101.40
First Wave Territory: 19.73
The long-term objectives presented in this study are not arbitrary price projections. They are derived from Fibonacci expansion relationships and the mathematical structure of Elliott Wave development.
Research Note
Alongside the two primary scenarios, an alternative wave count remains under continuous evaluation.
Under this alternative interpretation, the current diagonal could ultimately prove to be an Ending Diagonal, completing Primary Wave (III) rather than initiating a new impulsive cycle. Should that interpretation prevail, the market would still require a larger-degree Primary Wave (IV) correction before the next long-term advance begins.
At present, however, the available structural evidence continues to favor the Leading Diagonal interpretation. The Ending Diagonal remains a secondary research hypothesis, maintained not because it is currently preferred, but because Elliott Wave analysis requires every credible structural alternative to remain open until the market itself resolves the pattern.
My objective is not to defend a preferred wave count, but to continuously refine structural understanding through the observation of real market behavior.
Markets are often dominated by noise.
Structure reveals the logic behind price.
Patterns whisper. I listen.
– Mr. Nobody 🎧📊
Elliott Wave Researcher  Long
Long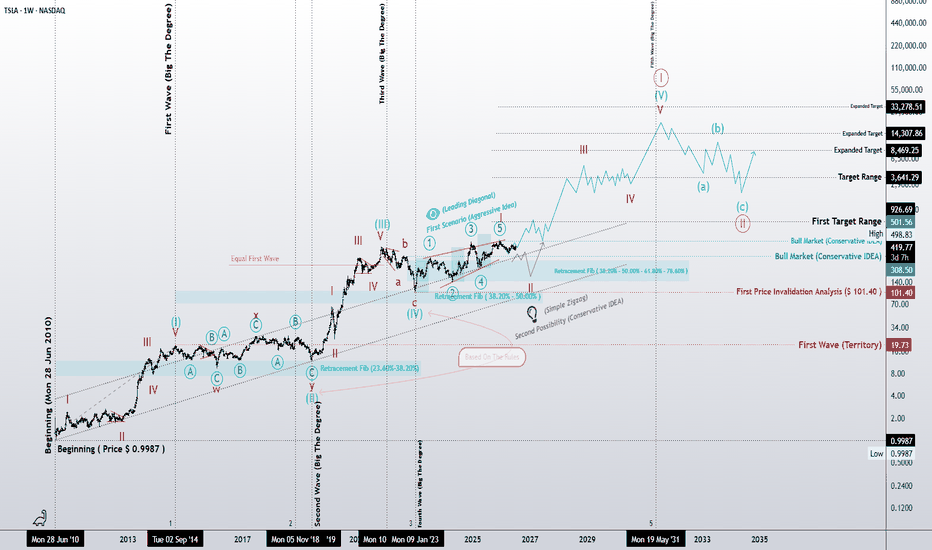
 Long
Long
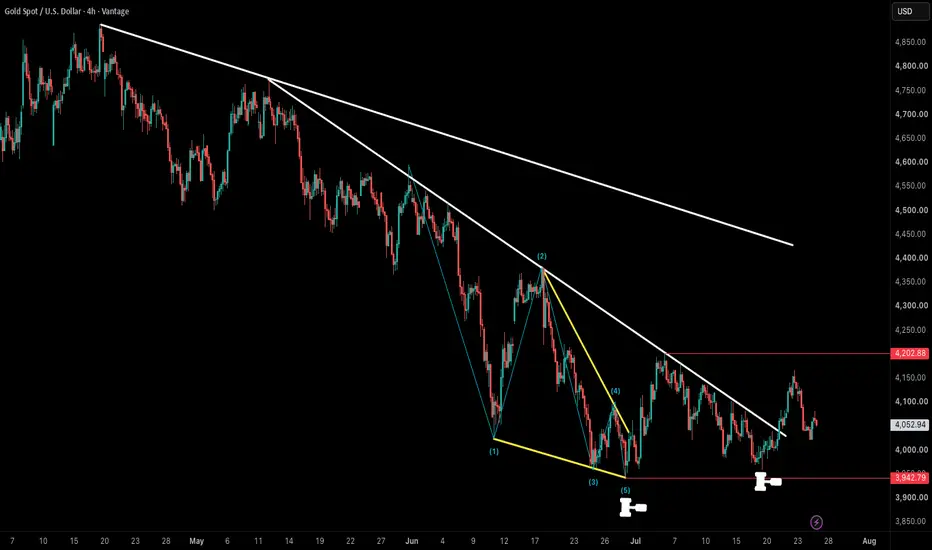
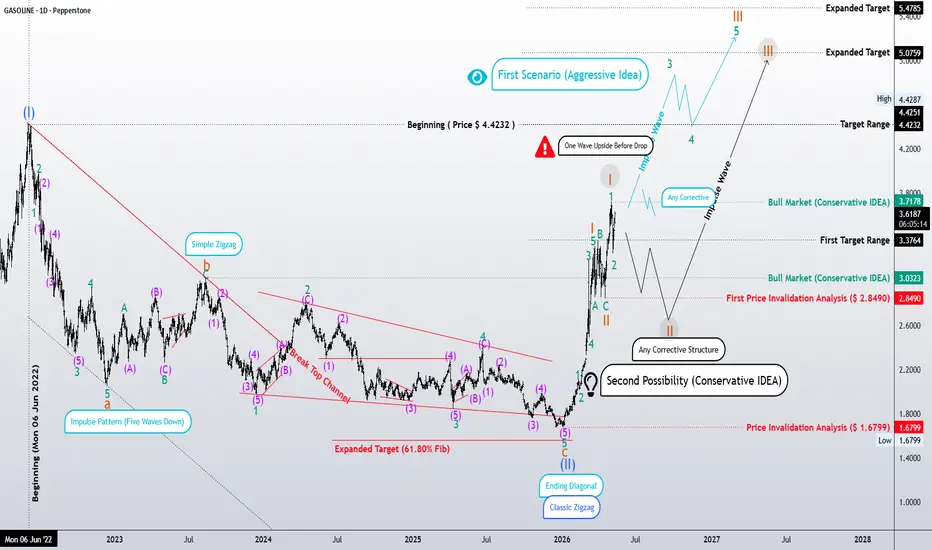
GASOLINE Daily Elliott Wave UpdateGASOLINE topped out at 4.4232 on Mon 06 Jun 2022 and then started dropping.
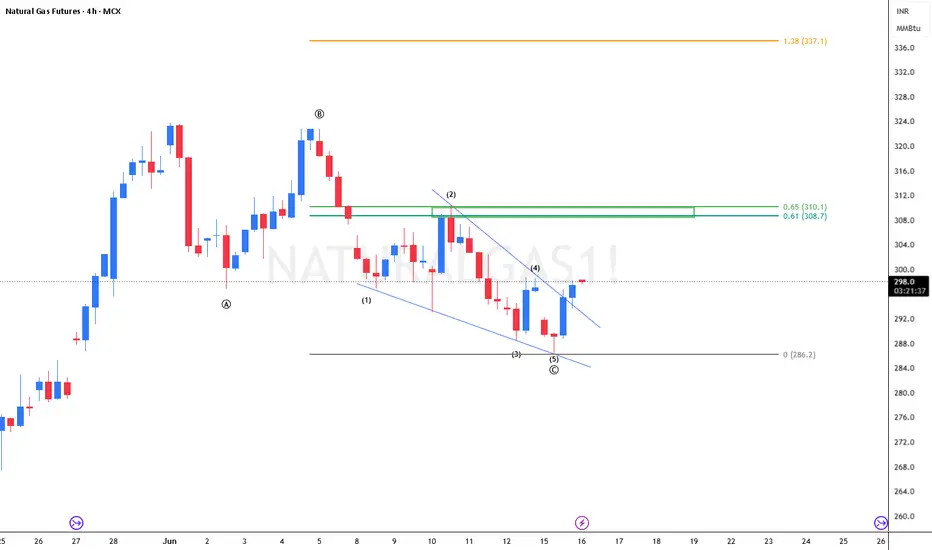
The decline looks like a classic three-wave corrective zigzag, and wave © formed an ending diagonal.
The structure finished around the 1.6799 invalidation level — so, based on the data from the chart, both scenarios you’re watching are now invalidated.
Pay close attention: wave © broke out of the corrective channel.
In patterns where wave (A) is sharp (impulsive-like), wave © often ends up building an ending diagonal.
And here’s the interesting part: if the final wave is diagonal (whether it’s coming from an impulse-style path or a diagonal zigzag), price sometimes does the opposite and effectively reverses/cancels the whole ending diagonal structure.
Now I’ve got two ideas for the next move:
Blue aggressive idea:
If price breaks above the previous peak (your current “blue” level) and then forms any corrective pattern, while keeping respect for the move into First invalidation at 2.8490, then the bullish setup stays fully valid with strong confirmation.
Black conservative idea:
Alternatively, the final part of wave 5 of I might still be unfolding, and then we could be entering a fresh corrective phase.
If that happens, it can also match a bullish outlook for the gas oil market overall.
I’m “Mr. Nobody” — I listen to what the patterns say, and I’m sharing what the chart is telling us.
Long 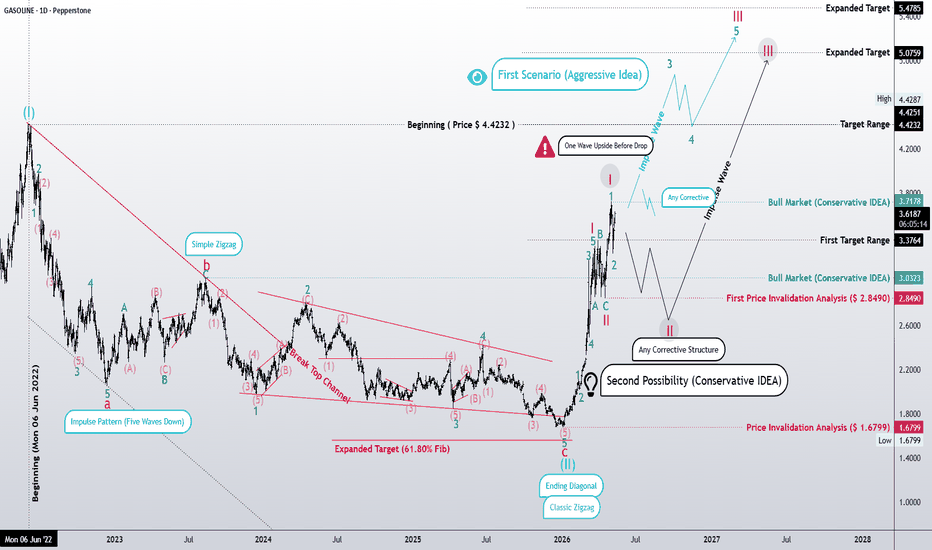
Short 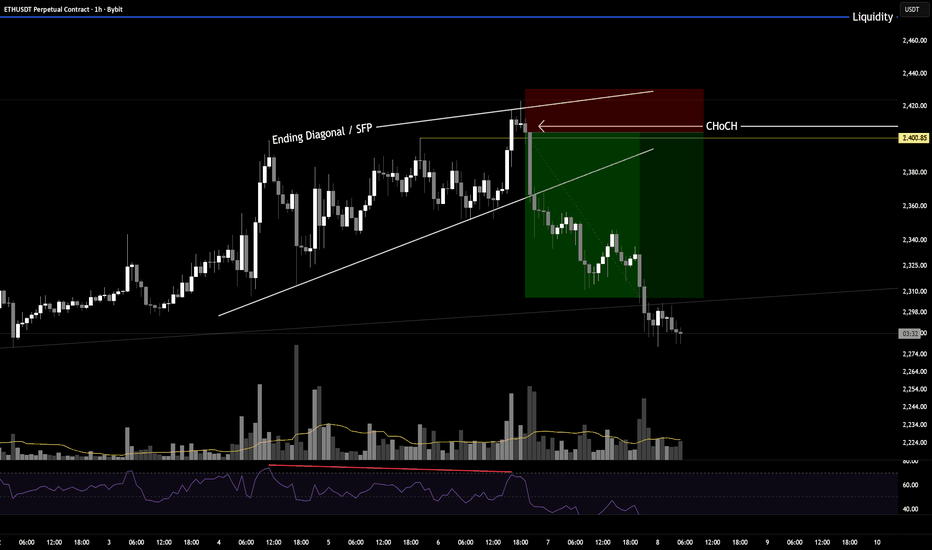
Tesla: Bullish Structure Still Intact After 30% PullbackTesla (TSLA) has experienced a sharp pullback of nearly 30% from recent highs, yet the internal structure of the decline does not currently appear impulsive. Instead, price action continues to resemble a corrective phase rather than the start of a sustained bearish trend.
The updated wave analysis points toward a potential seven-swing corrective structure, which is typical of complex consolidations within larger uptrends. This retracement is approaching the 50% to 61.8% Fibonacci zone measured from the April 2025 lows, an area that often acts as a high-probability support region in ongoing bullish cycles.
Price behavior around this zone is becoming increasingly important. Tesla has already shown signs of recovery, attempting to move out of a corrective channel, which suggests early confirmation that buyers are re-entering the market. This aligns with the idea that the “yellow box” support area is currently being respected.
From a broader perspective, there remains a possibility of another upward leg forming, potentially developing into wave C of wave five within an ending diagonal pattern visible on the weekly timeframe. This would still be consistent with a broader bullish structure, but would require confirmation through continued upside momentum.
However, risk remains on the downside. A decisive break below 260, especially if accompanied by accelerating selling pressure, would significantly weaken the bullish interpretation. In that scenario, it would suggest that the ending diagonal structure may already be complete, opening the door for a deeper correction toward 200, and in an extended bearish case, even toward 150.
Key Points:
-Current decline appears corrective rather than impulsive (likely a seven-swing structure)
-Price is reacting around the 50%–61.8% Fibonacci retracement zone
-Recovery from support suggests early bullish response within the correction
-Break above 390 would confirm continuation of the bullish rebound scenario
-Drop below 260 would shift bias bearish, targeting 200–150 range
Overall, Tesla is sitting in a critical decision zone where the next directional move could define whether this is a continuation of the broader uptrend or the beginning of a deeper corrective phase. Long 
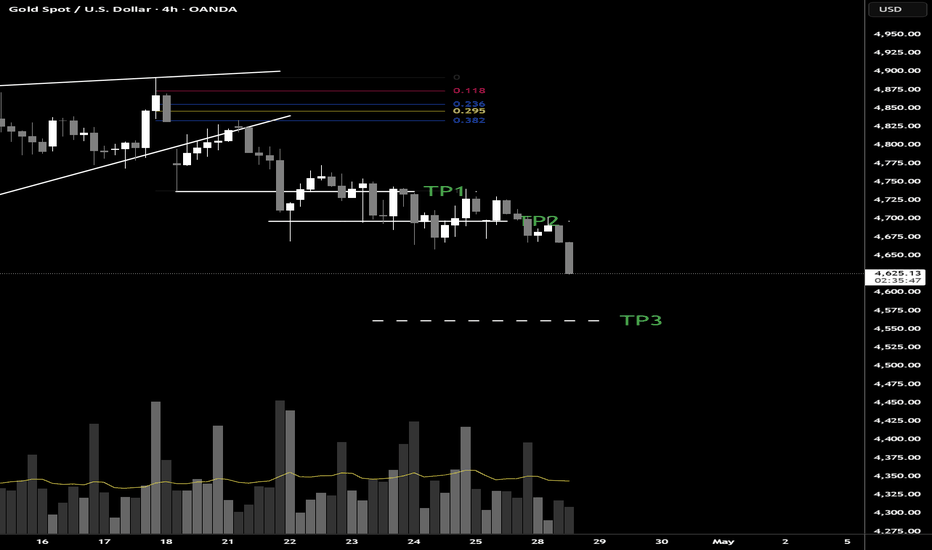
XAUUSD 4H — Ending Diagonal Update: TP1 & TP2 Done, TP3 CloseFollow-up to the ending diagonal breakdown published four days ago.
The original thesis: rising wedge rejection at the 0.118 Fibonacci level, breakdown through wedge support, three structural targets mapped from the distribution.
The update:
TP1 at $4,725 — reached and now acting as resistance confirmed.
TP2 at $4,690 — reached. Structural support level did not hold.
Current price: $4,635. Below both targets, above TP3.
TP3 at $4,575 remains the macro retracement target. With TP2 now broken, that level becomes the next logical demand zone to watch for absorption.
The invalidation from the original publication stands: reclaim and close above $4,855 on the 4H. Nothing has changed structurally to revisit that level.
Structure called the move. The targets did the work.
No revision to the framework. The read is playing out. Short