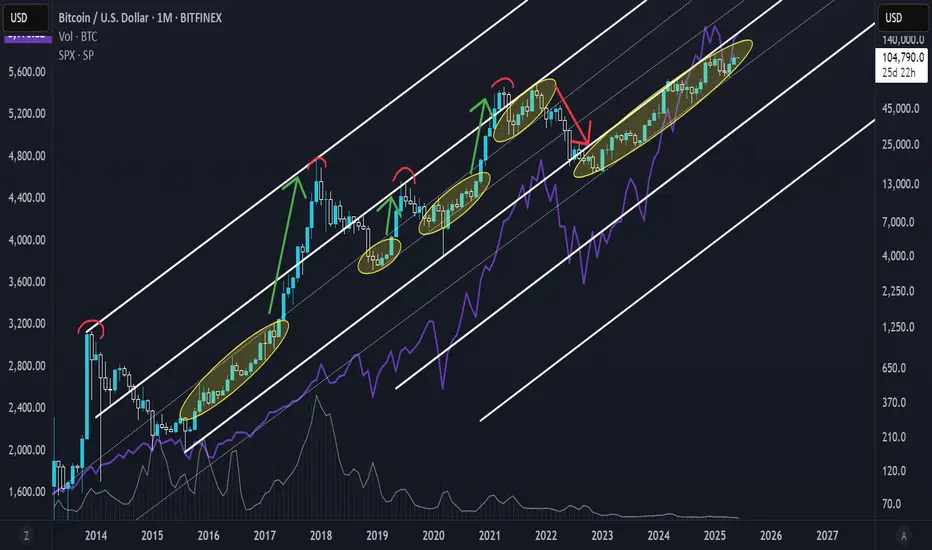
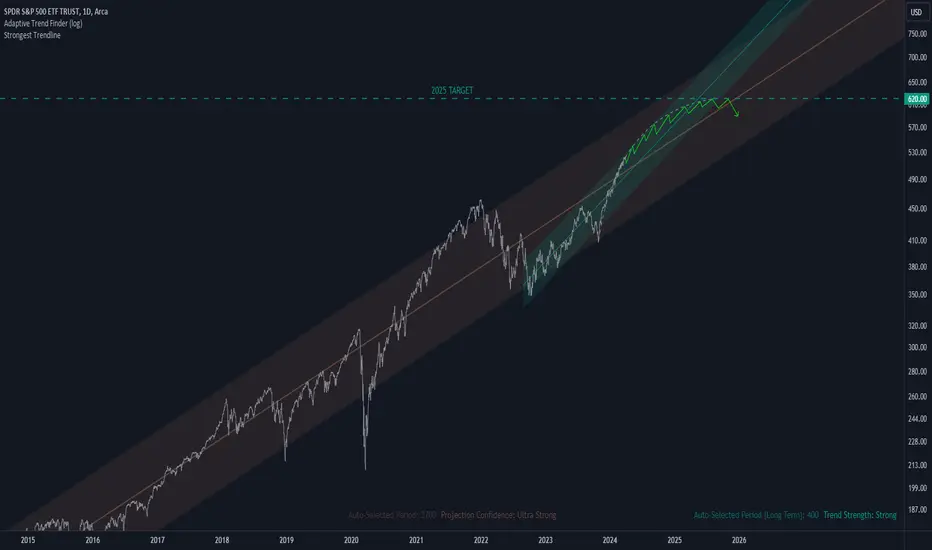
[Bearish Scenario] S&P Potential Top at This Multiyear ChannelHey all, I'm walking you through a purely technical idea here on the S&P, where we're hitting the top of a logarithmic rising channel that spans from 2022 - 2026.
More validity would be added to this "Topping idea" if the price goes on to trail higher, perhaps even breaking above the channel, but ultimately creating a:
Bearish divergence
Stumbling back into the channel
For now that hasn't happened, but it is helpful to see this technical structure beforehand so you won't get caught of
LOGARITHMIC
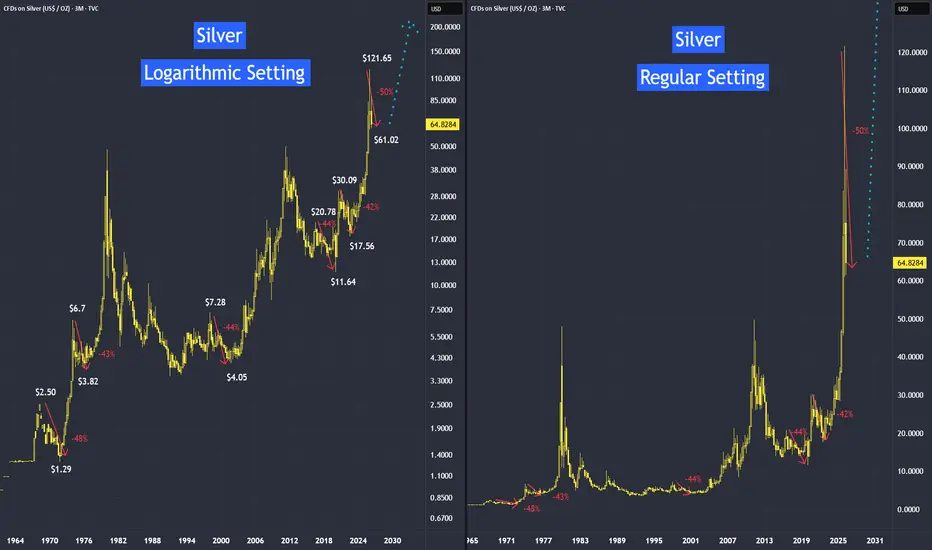
What's Next For Precious Metals - Use Logarithmic Setting If we study the historical data using the regular setting, we may miss this phenomenon: a price collapse right before a major uptrend. However, if we switch to logarithmic mode, this price behavior becomes clear.
Why use logarithmic mode when studying the historical behaviour?
Answer: This scale makes historical peaks and troughs easier to see because it plots price movements based on percentage changes rather than absolute dollar amounts.
I came across several videos claiming that precious m
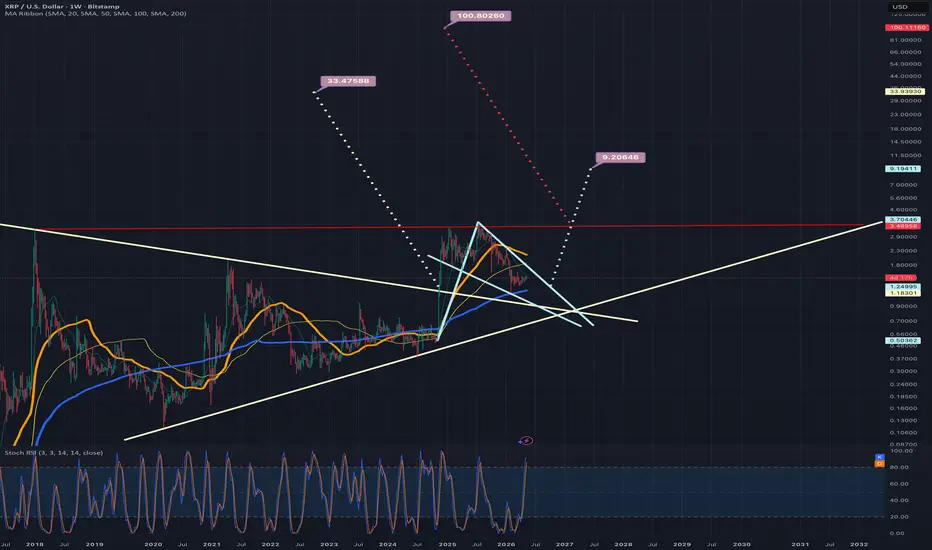
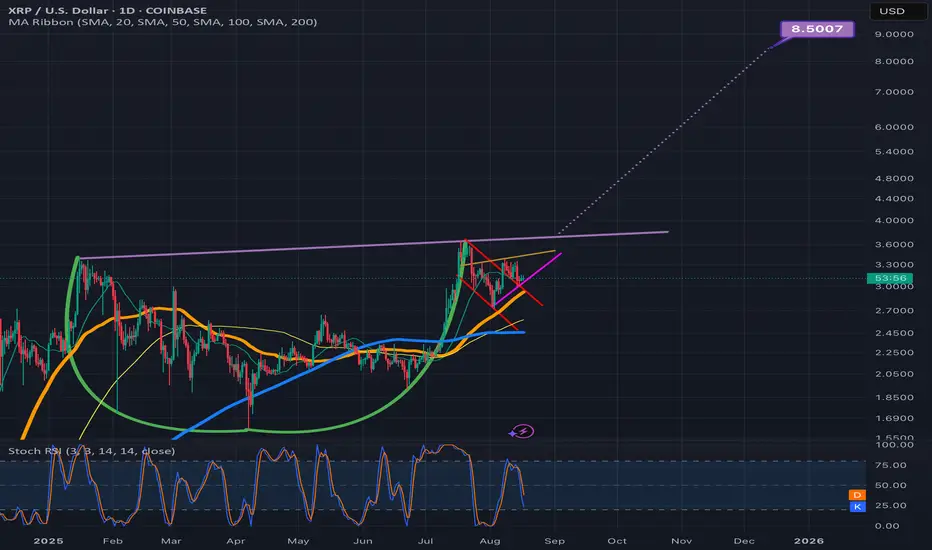
A daily chart version of the previous xrpusd logchart ideaIn addition to the weekly xrpusd log chart I just posted I figure it would be wise to also post the daily timeframe version of it too. If somehow the daily 50ma (in orange) can maintain support we will break up from this light blue pennant much sooner than where I have the dotted light blue line placed here. However, we also have the current resistance of the darker blue daily 200ma just overhead and we can see how it is starting to mimic the trajectory of the top trendline of the light blue pen
An updated look at the weekly logchart for xrpusdWe can see price action is currently consolidating inside a bull pennant that I have colored light blue here and as long as the blue 200 weekly MA maintains solid support price should break upward from the pennant by the time it reaches where I have placed the dotted measured move line. If that is the point at which it breaks out the target is around $9.19 or so but on my linear weekly chart (not shown here) price is currently a weekly candle or 2 away from breaking above the top trendline of a
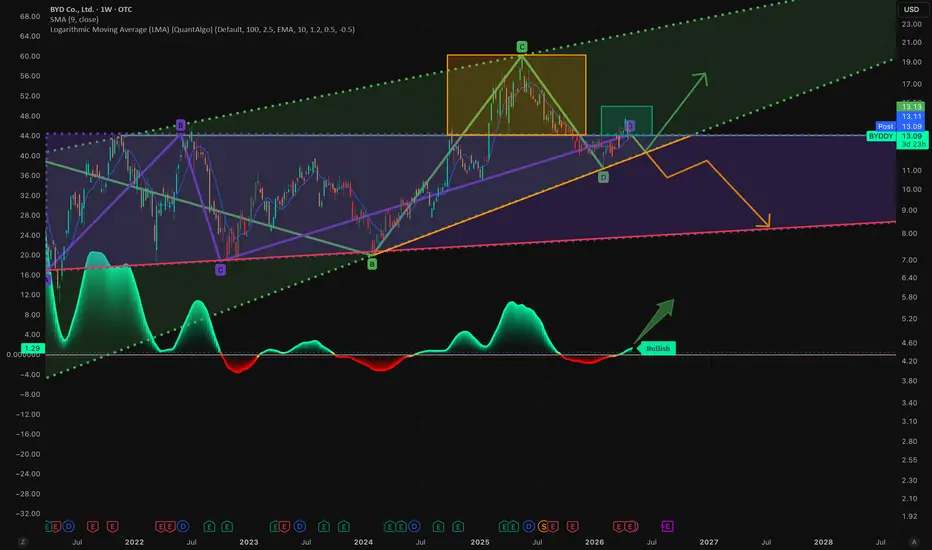
BYD ascending triangle breakout formationBYDDY price is testing the ceiling of a multi-year ascending triangle formation with bullish logarithmic moving average (LOGMA) movement to the upside. If price can test this breakout zone (turquoise rectangle), price volatility may likely continue to the upper channel (in green), if it cannot then price will likely consolidate back into the sideways ascending triangle formation (in purple).
Bull pennant on monthly btcusd log chartIf the monthly 50ma (in orange) can find a way to maintain solid support, then bitcoin should breakout upward from the current bullpennant right around where I arbitrarily placed the dotted purple line. This would give the bull pennant a breakout target of around 460k. Of course, Being a logarithmic chart pattern on a 1 month timeframe, this target could take several years to reach. *not financial advice*
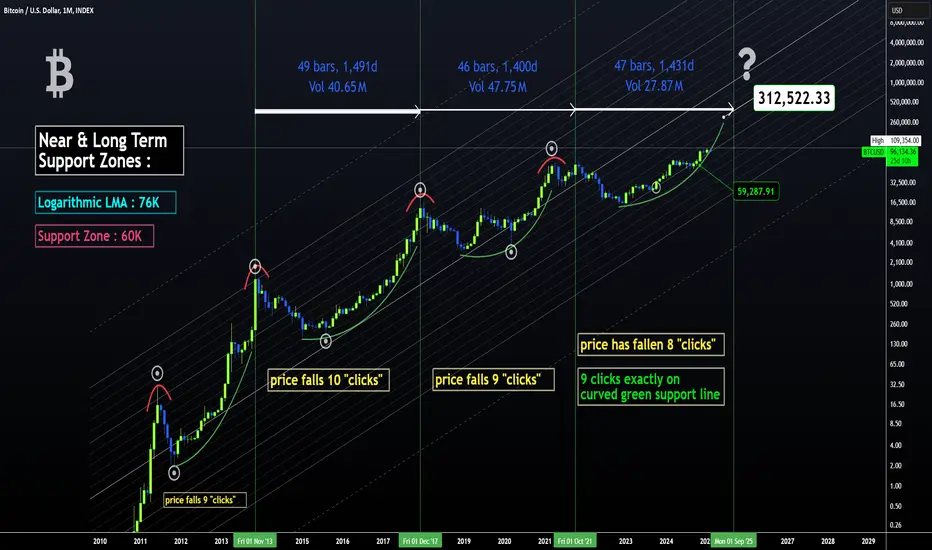
BTC Roadmap 2026-2027 ~ $320KHello BTC Watchers.
A quick update on BTC outlook for 2026 and a possible target for the next 2 years.
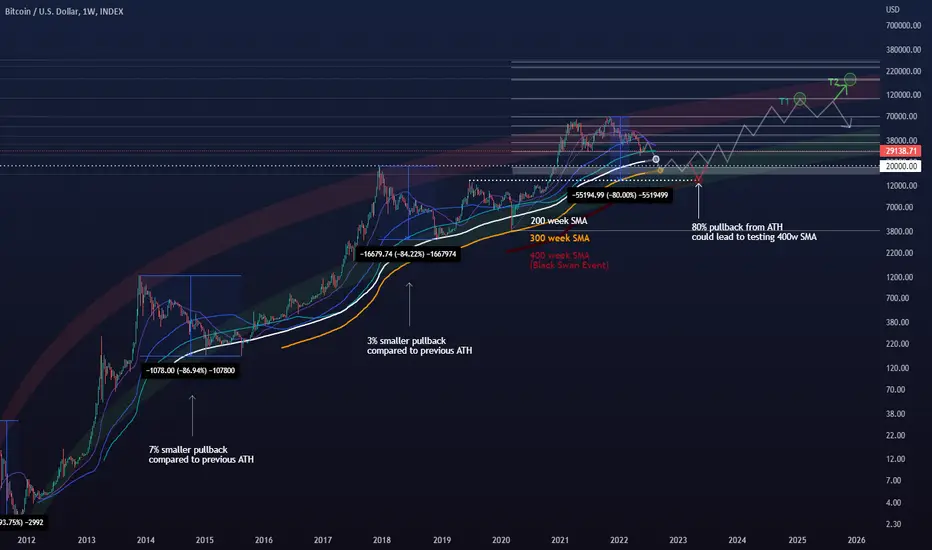
Incase you missed the explanation on the logarithmic chart, I mapped out the date-ranges, as well as how far the price fell logarithmically after each top. You'll see the word "lines" on the chart. This simply indicates the amount of diagonal trendlines it has fallen. By using this pattern-dedicated approach, a commonality is found which may be useful in speculating a future price. Because if
SNDK - Bullish Scenario Since 04 Sept, Momentum Still Intact!SNDK - CURRENT PRICE : 228.47
🔥 Bullish Scenario Supported by Trend Structure & Fibonacci Reactions
SNDK began showing early signs of a bullish scenario when price respected a rising support line , indicating steady accumulation and higher lows forming. The major bullish confirmation occurred on 04 September , when price broke above the 55.55 level (look at red arrow), triggering strong momentum and leading to a rapid vertical rally. As with many fast-moving stocks, a healthy retracement
SOLUSD at long-term linear-regression supportSOLUSD has had a rough year in 2025 with major drawdowns and new highs as well. Neither bulls nor bears have had a painless path.
Will 2026 be different? A lot depends on the Fed, liquidity, inflation prints, and more.
But SOL found a bottom today at the -2 standard deviation line on a log-scale linear regression going back to the all-time low in December 2022. This is a convenient tool developed by @Forza that is an open-source script that "slightly modifies TradingView's built-in linear re
BTC 2026 Outlook - Roadmap Speculation to $300KHello BTC Watchers.
Let's talk about BTC in the Logarithmic view.
I mapped out the date-ranges, as well as how far the price fell logarithmically after each top. You'll see the word "lines" on the chart. This simply indicates the amount of diagonal trendlines it has fallen. By using this pattern-dedicated approach, a commonality is found which may be useful in speculating a future price. Because if not for past history, how else would we speculate on the future?
It's interesting to note tha
A new look at previous logarithmic channelWith the trendlines of this channel slightly shifted we can see that it is possible that priceaction has already tested the top trendline of the channel. However in my previous version of this idea which I will try to post below it hasn’t connected with the top trendline yet. Would make more sense for it to be having the rejection it is having if it has already retested this top trendline though so I decided to post this version of the chart too so I can keep an eye on both. Even if somehow this
Introduction to a Trading System 1: Setting timeframes + bonusIntroduction to a Trading System: Setting Timeframes & Logarithmic Scaling
This educational video is the first in the "Signal and Structure" series, where an experienced crypto trader with 5+ years in cryptocurrency and additional forex background shares their systematic approach to chart analysis and trading.
Key Topics Covered:
Logarithmic Scale Fundamentals
- Why log scale is essential for cryptocurrency trading
- How it provides better perspective on price movements across different time
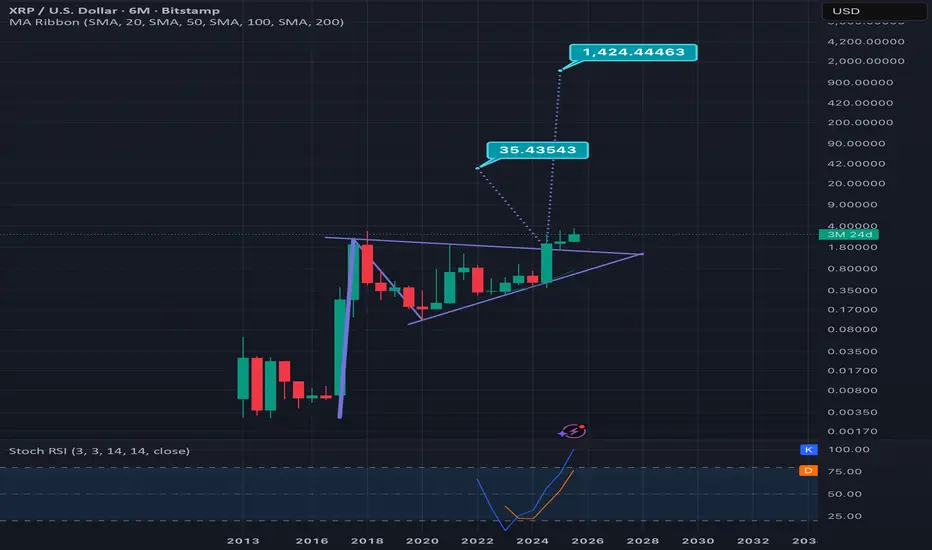
6 month log scale xrpusd chart updatedMy previous version of this chart I placed the breakout tarts arbitrarily before the actual breakout so I wanted to post an updated version with the two targets lined up directly at the point of the breakout. Smaller target is for just the triangle and the bigger target for the entire bullish pennant. Remember this being a 6 month time frame this could take several years still even to hit the highest target *not financial advice*
Monthly logarithmic chart on total3 suggests it could 44x!On the total3 chart we can see the majority of altcoins (excluding ethereum) have been consolidating for quite a long time in this ascending triangle which s also a bullish pennant. These patterns break to the upside far more than they break to the downside and this current one is nearing its apex. If we clued the pole of the pennant to calculate the Bullish breakout target/measured move, we can see that the target is 44 x higher than the current price. Of course this beng a logarithmic scale pa
BTC to $12,000,000 December '27I had a years-old bookmarked chart from @MillionaireEconomics that I wanted to update and pick a random, extremely bullish candle pattern from the last time BTC came off the bottom channel to slap on it.
Riddle me this:
Why shouldn't Bitcoin go to $12,000,000 by December 2027?
Saylor continues to lead the way for global companies to scramble to build their own BTC warchests. These early adopters are having investor money dumped into them by the truckload.
Countries are stacking BTC
SPY Price Projection: Mid-2025 TargetRevealing Market Trends: Logarithmic Regression Analysis Indicates Bullish Path for SPY
In the ever-evolving realm of financial analysis, the search for reliable predictions remains ongoing. Logarithmic scale regression analysis, coupled with potent indicators, has emerged as a promising tool for discerning trends, particularly regarding assets like the SPY.
This analysis delves into the utilization of logarithmic scale regression alongside two robust indicators, offering insights into the po
BTC can still WIN After DeepSeek DumpTings are looking rough for BTC and ETH in the daily.
Let's talk about ETH first.
The previous time I posted on ETH, we took a look at a bullish pattern forming - the Inverse Head and Shoulders Pattern.
VS the VERY different picture we see today after the weekly closed underneath support:
Apart from chart patterns and bullish indicators - I was also confident that the price of ETH would increase, as we haven't seen a new ETH all time high, compared to the drastic ATH Bitcoin made. This
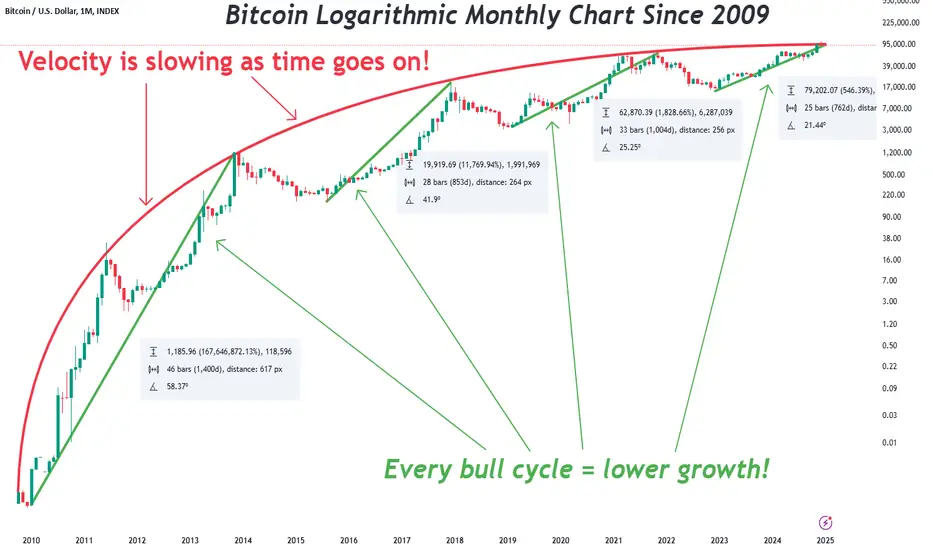
Bitcoin Logarithmic Chart Since 2009Bitcoin is currently in a bull cycle similar to previous cycles. Bitcoin has a notorious 4 year cycle that almost everyone knows about due to it's halving. This means the current bull cycle should extend into late 2025. However, things may be a little different from what most people would expect this time.
This is an all-time Bitcoin logarithmic chart going back to 2009 which is when Bitcoin was released. This is a monthly chart so all the information can fit onto a single screen.
The red line
$BTC #Bitcoin Just Gonna Leave This Here (Hmmmm..Maybe?) 😝This is just adding onto my logarithmic regression-inversion theory and how I personally believe the $BTC price movements may specifically play out. The general theory is that the logarithmic regression of $BTC will invert at a certain point in the next 1-3 years, changing the price suppression $BTC has had for its whole life into exponential support. I personally believe this is very possible, with exponential adoption of #Bitcoin for things like sovereign wealth funds, countries' legal tender