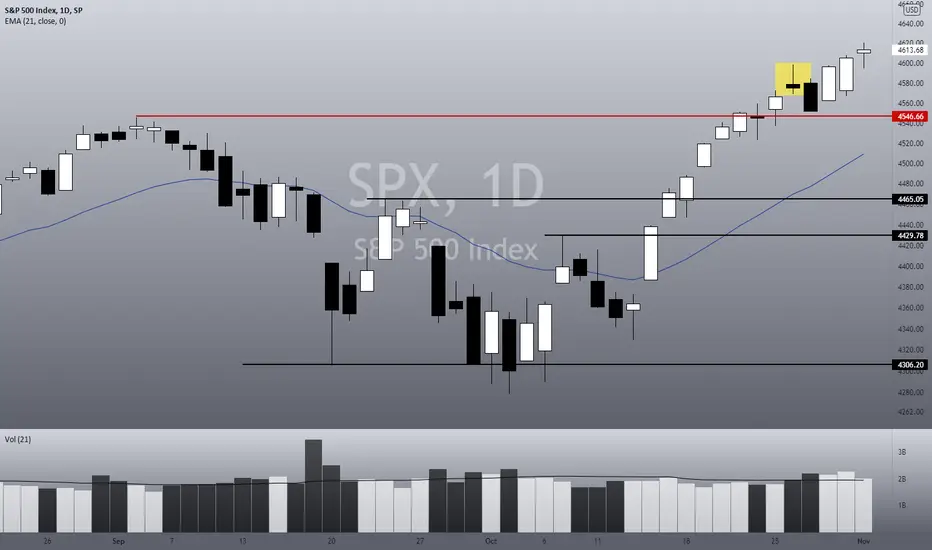
Spinning Top Candle: The Chart's Way of Asking a QuestionA small body squeezed between two long shadows appears on almost every chart, and most traders read it as a warning that the trend is turning. Thomas Bulkowski's testing of 103 candlestick patterns found the white version reverses 50 percent of the time and the black version 51 percent, ranking them 69th and 73rd for performance. That is a coin flip.
That is not a reason to ignore it, but a reason to change what you ask of it. A spinning top candle is not a signal, it is a question: the session
Spinning Top
BNBUSDT — Bullish consolidation ahead of resumed uptrendThe bullish consolidation in BNBUSDT that I’ve been watching has begun to resolve in the market’s favor. Price action is coiling after two consecutive white spinning-top candles, a pattern that signals indecision but also a readiness to resume the prior trend when confirmed. The move has occurred on heavier volume concentrated in the current price area, and the pair sits roughly halfway between two key Fibonacci retracement levels — a location that commonly precedes a corrective bounce rather th
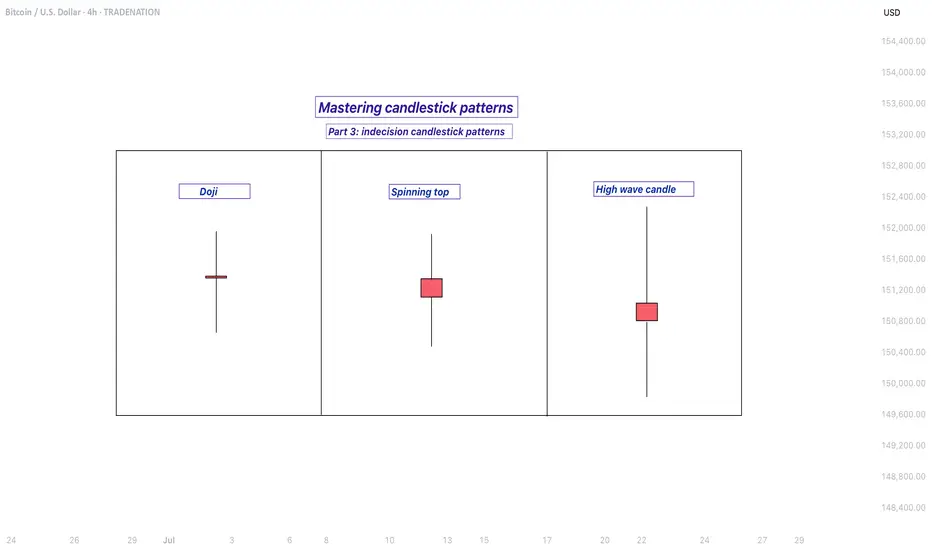
Mastering indecision candlestick patterns - How to use it!In this guide I will explain the indecision candlestick patterns. The next subjects will be discussed:
- What are indecision candlestick patterns?
- What is the doji?
- What is the spinning top?
- What is the high wave candle?
What are indecision candlestick patterns?
Indecision candlestick patterns are formations on a price chart that suggest uncertainty in the market. They appear when neither buyers nor sellers have full control, meaning the price moves up and down during the trading period
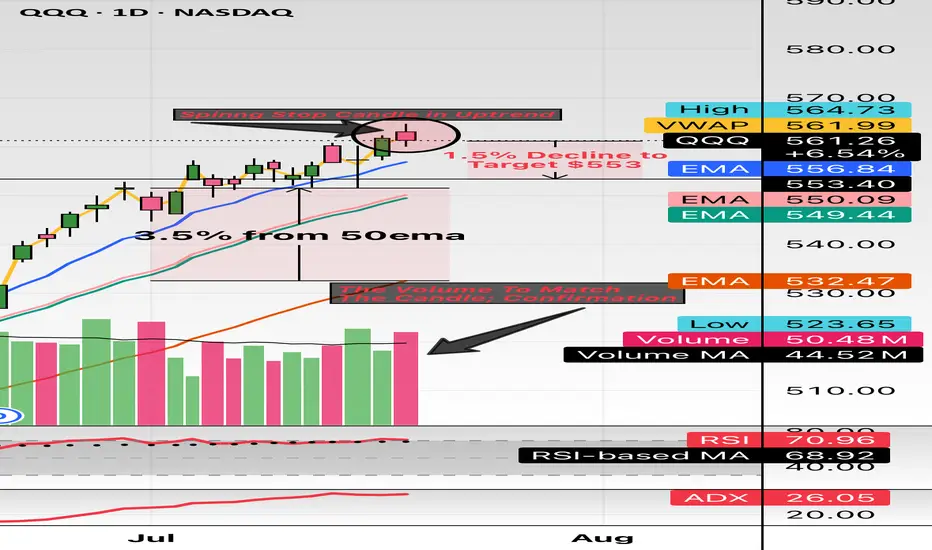
$QQQ this might the spot. Hello and good night, evening, afternoon, or morning wherever you may be. I have been looking at names all day and I wanted to check the indexes: NASDAQ:QQQ and $SPY.
Here we have the indexes up almost 30% from the April lows and sitting about 10% YTD. The candle highlighted is the spinning stop candle and has volume to match. These candles usually take place (green or red) in downtrends or uptrends and provide pivotal indication. The market has major earnings this week (07/21/2025 to 07/25/
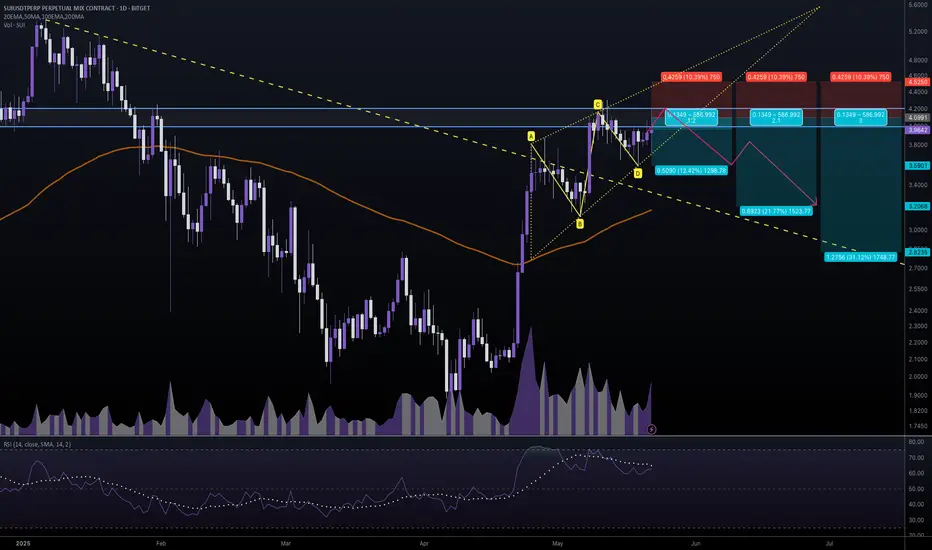
#SUIUSDT #1D (Bitget Futures) Rising wedge near breakdownSui got drained from Cetus LP and is about to print a spinning top candle on daily.
A retracement down towards 100EMA / descending trendline support seems likely.
⚡️⚡️ #SUI/USDT ⚡️⚡️
Exchanges: Bitget Futures
Signal Type: Regular (Short)
Leverage: Isolated (4.0X)
Amount: 4.8%
Current Price:
3.9642
Entry Zone:
3.9947 - 4.2035
Take-Profit Targets:
1) 3.5901
1) 3.2068
1) 2.8235
Stop Targets:
1) 4.5250
Published By: @Zblaba
CRYPTOCAP:SUI BITGET:SUIUSDT.P #1D #SuiNetwork #L2 sui.io
Risk/
$GLD - bullish momentum soon to stallHello, I was bullish on AMEX:GLD for a bit and now examining the charts, multiple frames, this may be setting up for a good short. If geopolitics and tariff talks deescalate then this should cool off. The Elliot wave placed indicates some time for a correction/pull back on this hot commodity and the candle on the Daily from Friday is a spinning stop doji which can indicate reversal in an uptrend. Also, we have so many gaps up that happened in 3 day span, crazy actually. I labeled areas of targ
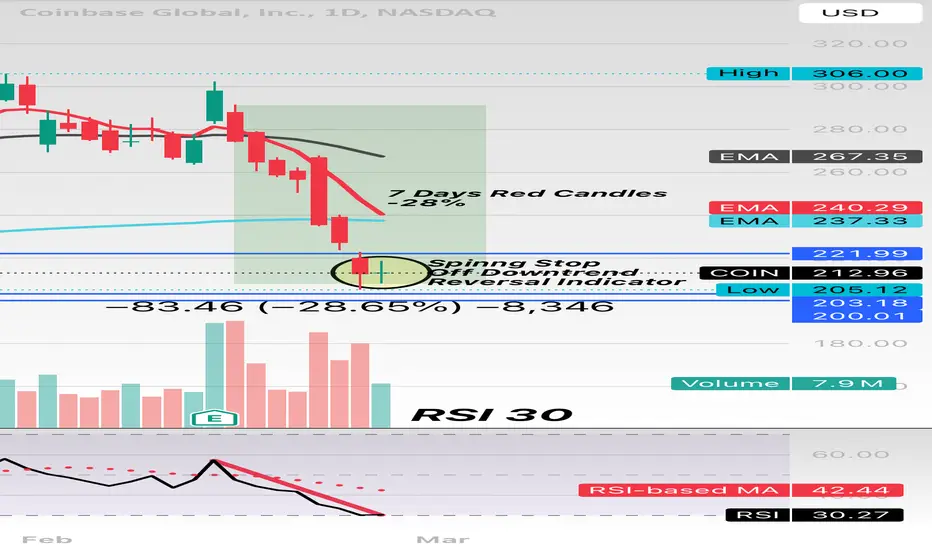
$COIN Spinning Stop Candle in Downtrend; ReversalWe have 7 days of straight beating, assault, slaughter and murder. Do I think this thing reverses 10 fold? No but do I expect a bounce into the mid 220’s? Yes. RSI is relatively low (sold) for its name, it fundamentally smashed earnings and the candle here that closed on the daily is known as a spinning stop with a green closure. Expect a volatile move soon - tomorrow or and into Friday. NASDAQ:MSTR held up well today. This is always a craps shoot, no matter the trade, no matter the look of th
GICRE - Bullish Consolidation with VolumesNSE: GICRE is closing with a bullish consolidation candle supported with volumes.
Today's volumes and candlestick formation indicates strong demand and stock should move to previous swing highs in the coming days.
The stock has been moving along the horizontal support for the past few days which is indicating demand.
One can look for a 8% to 12% gain on deployed capital in this swing trade.
The view is to be discarded in the event of the stock breaking previous swing low.
#NSEindia #Trading
1W BTC Candlestick and Wave AnalysisI continue to be bearish and, by all my logic and knowledge, think that this market has been heavily manipulated since the Genesis bankruptcy.
Just think about it. The moment when the biggest crypto lender needs to liquidate their assets, the price goes up.
Also, if you follow the social metric, you know that creators of the crypto content are struggling to get new views.
And then, we have Elon changing the Twitter logo and pumping the DOGE, and the last time he did it, he pumped and dumped
TQQQ Short Back To $17I think we are over bought! Prices have halted with a spinning top doji having formed and a candle after to confirm a possible pullback. We have room to drop back to the high volume node at $17 where smart money will make the next decision on direction. Not financial advice , DYOR
TATACOMM - Spinning Top with Volume SpikeNSE: TATACOMM is closing with a spinning top candle supported with high volumes
Today's volumes and candlestick formation indicates strong demand and stock should move to previous swing highs in the coming days.
The stock has been consolidating for the past few days which is indicating demand.
One can look for a 8% to 11% gain on deployed capital in this swing trade.
The view is to be discarded in the event of the stock breaking previous swing low.
#NSEindia #Trading #StockMarketindia #Trad
TSLA: Bullseye (again)! Next Key Points to watch [UPDATED].• In our previous post, when TSLA was around $195 I set a target around $179 - $177, if a top sign appears. It happens that TSLA did a Spinning Top, and it dropped sharply afterwards. Now it is below our original target – the link to my previous public analysis is below this post, as usual;
• Now, TSLA is just bearish, and so far there’s not a single bullish sign indicating a bottom;
• If TSLA reacts and closes above the $177 today, it might bounce to higher levels, like the 21 ema, or even to t
SPX: Be aware of this KEY POINT! Is this a bottom?• The index did exactly what we described yesterday, as we nailed another support level on the index, at 4,028 (it hit 4,026, but we aren’t that perfectionists). The link to my previous analysis is below this post, as usual;
• Now the index is trying to react, and the 4,028 is just where the 21 ema is (1h chart);
• It is losing strength, but if it closes above the 38.2% retracement, it might bounce a little bit more;
• However, if it loses our dual support level made by the 4,028 + 21 ema, then
USD/CHF How To Trade Accumulating Pair With Spinning TopsThis Is An Educational + Analytic Content That Will Teach Why And How To Enter A Trade
Make Sure You Watch The Price Action Closely In Each Analysis As This Is A Very Important Part Of Our Method
Disclaimer : This Analysis Can Change At Anytime Without Notice And It Is Only For The Purpose Of Assisting Traders To Make Independent Investments Decisions.
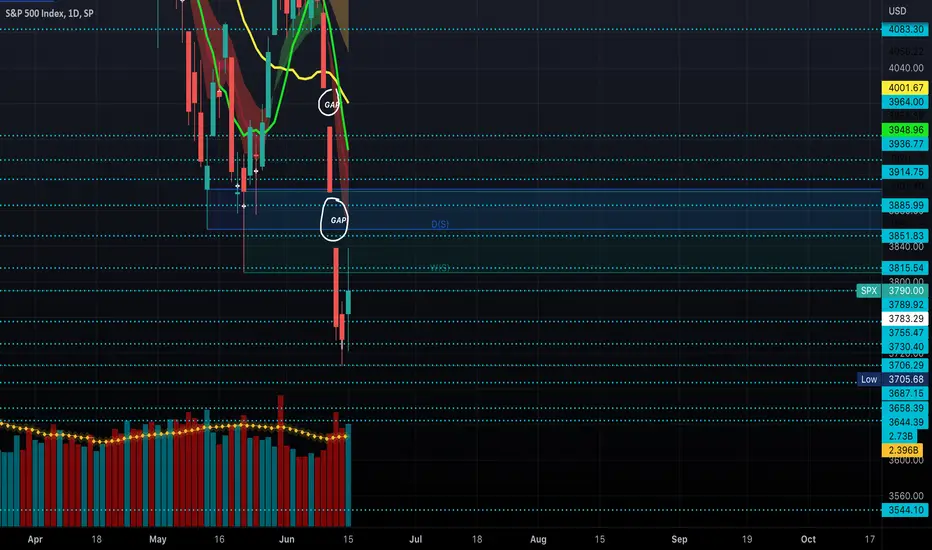
SPX Gap Fill Play!SPX has 2 gaps on the daily chart. One gap occurred June 10, 2022 and the other on June 13, 2022.
On June 15, 2022 SPX closed the day with a spinning top.
My plan is to take SPX to the upside after it breaks 3838.51. However, should it break below 3722.08, I will take it to the downside. I have an alert set at 3838.51 with the expectation of a gap fill to approximately 3900.
Please reference the screenshots of the SPX daily chart below.
*This is not financial advice.
Peace,
MrALtrades00
Algorand Short Scenario $ALGO's last two local highs both saw spinning top candles on the daily chart. Each realizing approx 20% retracement that followed the daily candle close over about 1.5 weeks.
Today, ALGO is forming another spinning top. If the trend continues, this gives a short-term price target of $0.67 by end of March.
AShort
SPY- Bearish- UpdateJust posting a quick update as the SPY is looking even more bearish after closing on Friday with a spinning top reversal pattern on the weekly timeframe- the markets have been overextended for quite some time, technicals are bearish on almost every timeframe- Some FIB levels and RSI-based supply and demand zones to keep an eye on-
- Bearish Megaphone Formed
- Bearish ABCD Harmonic Pattern Formed
- Spinning Top Candlestick Pattern Formed on the Weekly Timeframe (Bearish Reversal Pattern, See Att
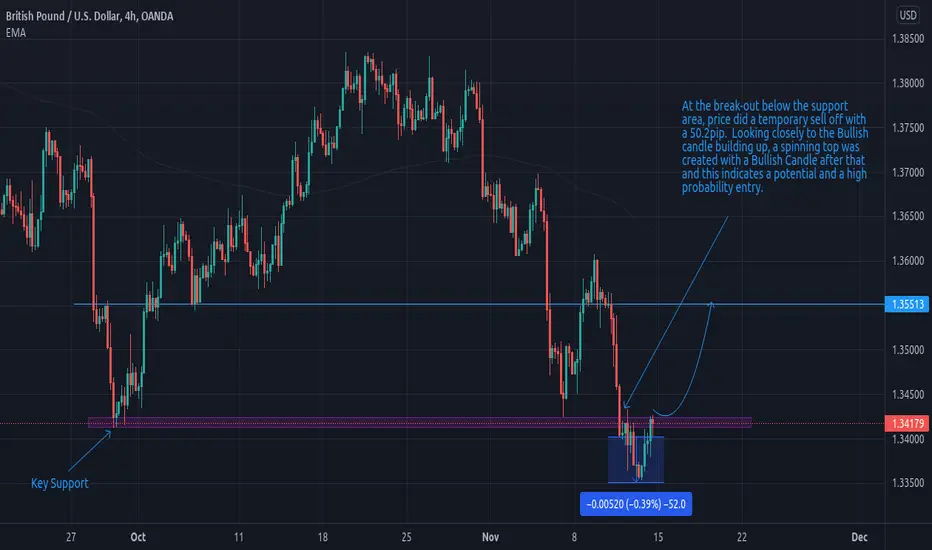
Both Daily and 4H is giving a Bullish Move for GBPUSD... At the break-out below the Key Support area, price did a temporary sell off with a 50.2pip. Looking closely to the Bullish candle building up, a spinning top was created with a Bullish Candle after that and this indicates a potential and a high probability entry.
SPY- Bearish Reversal - UpdateSPY looking very bearish here, frankly, the markets have been overextended for quite some time and all technicals are bearish on almost every timeframe- Some FIB levels and RSI-based supply and demand zones to keep an eye on-
- Bearish ABCD Harmonic Pattern Formed
- Spinning Top Candlestick Pattern (Reversal Pattern, Bearish in This Case)
- Bearish Butterfly Harmonic Pattern Also Formed (See Attached Chart)
- Buyer Volume Drying Up
- RSI way in Overbought Territory
- MACD Death Cross on the 4
SPX: When will it drop again?Hello traders and investors! Let’s see how the SPX is doing today!
It seems we see a bearish sign on the SPX, indicating a possible top (spinning top?), but I wouldn’t be too excited about it. After all, the index already did a similar pattern last Tuesday (it even more bearish, as it was a shooting star), and it was just a bear trap, as we thought.
What’s more, it is always important to analyze the hourly chart before any conclusion.
In the 1h chart, we don’t see any bearish structure yet,
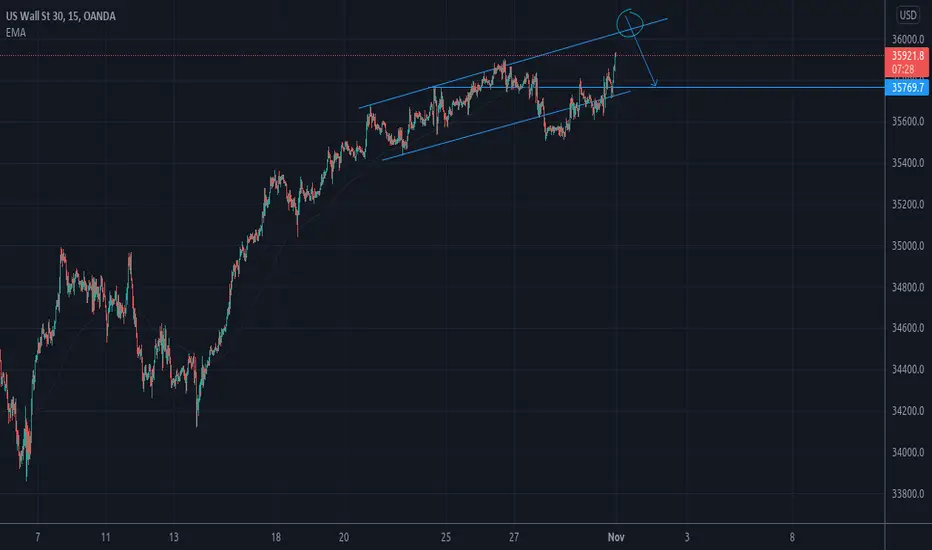
US30 has been a steady uptrend, insight on scenarios to expect.This Indices has been on a steady uptrend, we have seen a clear break-out, retest and continuation. From the chart we have identified that the price is currently trading in a channel up, a successful to buy to the upper trend-line acting as a RESISTANCE if we can see a rejection with spinning top and or a Bearish Engulfing at this trend-line acting as RESISTANCE area, there is possibility of selling to the SUPPORT AREA @ 35769.7
SPX: Another RECORD HIGH! But, what if it starts dropping?Hello traders and investors! Let’s see how the SPX is doing today!
The index is going up nicely, but the candlestick in the daily chart looks enigmatic, as it is almost a Doji. The long shadow above the daily candlestick is annoying for sure, and kind of ruins the bullish momentum.
Since October 13, it seems the index deserves a pullback to the 21 ema again, at least, but we don’t see any meaningful weakness sign. Even if it closes doing a Doji, a Shooting Star, or a possible Spinning Top cand
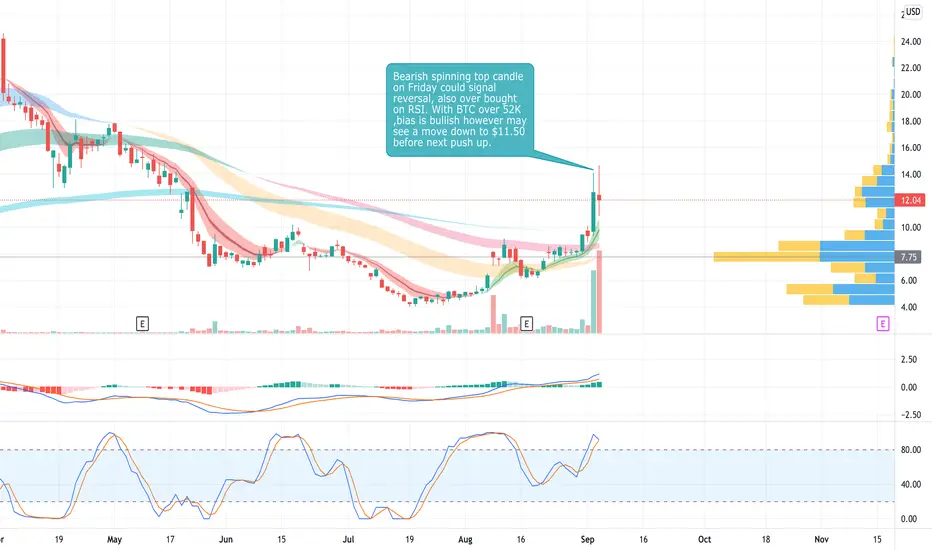
$BTCM DailyIn the short term, may see more downside before next push up. Overall longer term Bias is bullish, however slightly over bought and bearish spinning top showing market uncertainty on Friday's close. Hoping for a little dip to add to my Oct $12.50 call position. Watching Ripster EMA clouds as support.
B