Long
Long
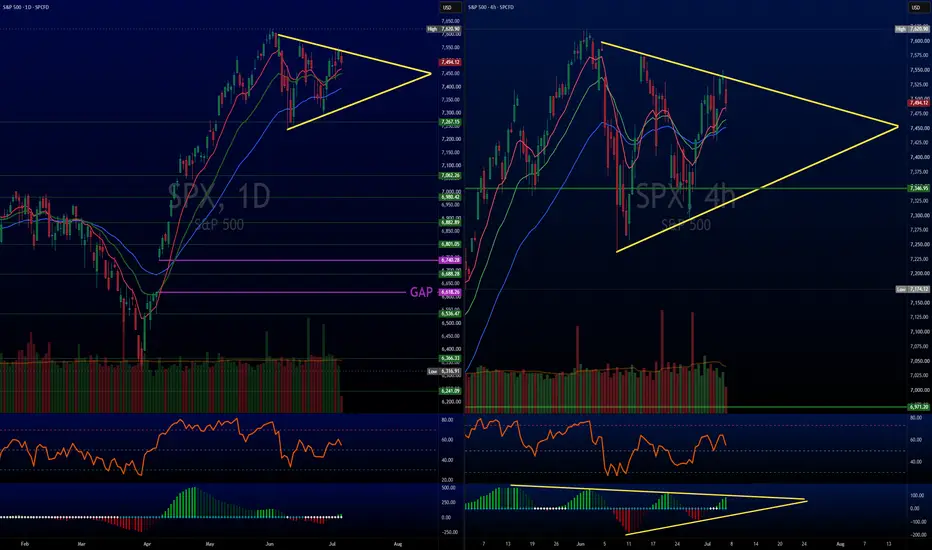
SPX Multi Timeframe Symmetrical Triangle Pt2When a market squeezes tightly into the final tip of a macro chart pattern, tracking the inner timeframes reveals a battlefield of false breakouts and rapid institutional positioning. Following up on our recent analysis of the S&P 500 SPCFD:SPX Symmetrical Triangle, the structural physics have shifted into an environment of extreme near term whipsaws.
1. The Daily Stalemate
Looking at the Daily macro chart, market has completely ground to a halt, flatlining right against its zero momentum line.
While the overall symmetrical boundaries continue to hold price captive, a closer look at the 4Hr reveals that momentum itself has formed a matching triangle structure. The momentum waves are printing lower green peaks and shallower red valleys, systematically choking out the asset's velocity. The spring is completely coiled; it is running out of physical room to move.
2. The Anatomy of a Bull Trap
The danger of trading inside the dead center of a contracting apex was perfectly illustrated by recent intraday action. Price aggressively broke above the upper descending yellow trendline, a move that textbook breakout traders usually chase.
However, institutions immediately used that brief spike past resistance as a liquidity window to dump inventory. The breakout failed to attract sustained buying velocity, forcing a sharp reversal back inside the pattern boundaries and closing lower. In a tight apex, algorithms intentionally trigger these stop hunts to trap late stage buyers.
3. Deconstructing the Heavy Institutional Volume Days
When looking at the hourly frames, certain massive, isolated volume bars stand out. These are not random market surges; they are highly structured, scheduled global index and derivative events:
The Late May Peak: Driven by the mandatory execution of the semi annual MSCI Index Rebalance, forcing passive funds to reallocate billions in capital right at the closing bell.
The June Expiration Surge: Because the mid June federal holiday fell on a Friday, the multi trillion dollar Triple Witching Options Expiration was forced to shift 24 hours earlier to Thursday. This triggered a massive, concentrated wave of institutional position rolling.
The Late June Volume Block: Sparked by the annual implementation where benchmarks reshuffle capitalization rankings.
The Strategic Takeaway
When a chart exhibits multiple moving average crossovers, a flurry of daily squeeze dots, and false intraday breakouts, the tape is telling you to step aside.
Trying to force direction onto a market that is explicitly telling you it has no direction is a low probability game. The disciplined play is to preserve capital, clear off hyper-leveraged liabilities, and let a clean daily close outside of this triangle structure definitively prove who wins the macro tug of war.
 Long
Long
 Long
Long
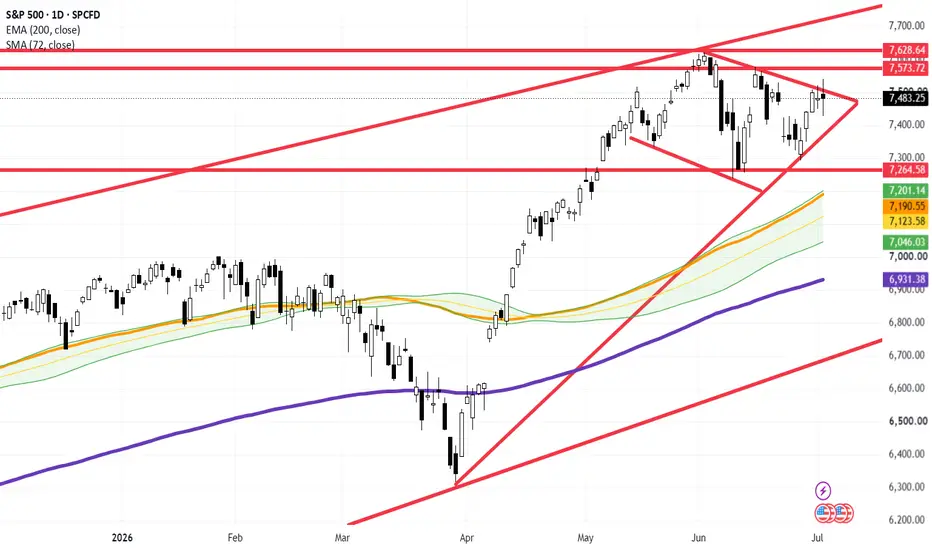
S&P 500 ($SPX) Daily Update: Index Remains Locked in SymmetricalS&P 500 ( SPCFD:SPX ) Daily Update: Index Remains Locked in Symmetrical Triangle – Tactical Range-Playbook Rules Until Breakout Confirmation
### 🇺🇸 S&P 500 Index ( SPCFD:SPX ) Mid-Weight Macro Brief (Ref: SPX_2026-07-06_10-22-10.png)
We are releasing an essential structural update on the S&P 500 Index ( SPCFD:SPX ) on the Daily (1D) time matrix. Following a brief breakout attempt last week, aggregate institutional order flow failed to secure structural acceptance above the local descending resistance line, pulling price action back into structural equilibrium.
The benchmark index starts the week flat, trading at **7,483.25 (+0.00%)**, exactly inside the heart of a prolonged volatility compression model.
---
### 🔍 Technical Geometry & Dual Macro Roadmap:
The index continues to coil tightly within a mature **Symmetrical Triangle** pattern (bounded by the converging red diagonal lines of trend). Until a clean daily close materializes outside of these key boundaries, we map out two definitive paths for directional expansion:
1. **The Bullish Expansion Scenario (~7,621+):** To trigger a fresh institutional leg of price discovery, buyers must push past the current dynamic compression ceiling and invalidate the immediate horizontal supply stack at **7,573.72**. This clear breakout will open the technical highway to re-test and breach the absolute multi-month high around the **7,621 – 7,628.64** corridor.
2. **The Mean-Reversion Corrective Scenario (~7,237):** Conversely, if sellers reject the price at the upper boundary and break the lower ascending trendline, a healthy mean-reversion phase will be triggered. This corrective slide will target the strong **7,237 – 7,264.58 horizontal support baseline**, aligning beautifully with the secondary dynamic defense band of our rising **72-period SMA (orange line sitting at 7,190.55)**.
---
### 🎯 Current Tactical Playbook: Range Mechanics Only
Because the index is locked inside a narrowing structural congestion window, chasing breakouts inside the triangle yields highly unfavorable win-probability metrics.
Our systematic framework strictly enforces range-bound rules for the moment:
* **Buy-Side Accumulation:** Executing long exposure exclusively near the lower dynamic support trendline of the triangle, with tight invalidation parameters.
* **Sell-Side Distribution:** Scaling out longs or looking for localized short setups as price tags the descending structural resistance ceiling.
We remain patient, respecting the triangle borders until institutional volume confirms a structural resolution.
---
📊 **ChartPro Data**
*US Benchmark Architecture, Symmetrical Squeeze Models & Systematic Range-Trading Systems.*
⚠️ **Disclaimer:** For educational and informational purposes only. This active market study represents a personal trading framework and does not constitute financial or investment advice.  Long
Long
S&P 500 ($SPX) Daily: Price Tests Crucial Volatility CompressionS&P 500 ( SPCFD:SPX ) Daily: Price Tests Crucial Volatility Compression Ceiling Inside Major Resistance Cluster
### 🇺🇸 S&P 500 Index ( SPCFD:SPX ) Macro Technical Update (Ref: SPX_2026-07-01_08-40-38.png)
We are deploying an updated institutional structural study on the S&P 500 Index ( SPCFD:SPX ) on the Daily (1D) matrix. The benchmark global equity index has entered a high-stakes technical junction, consolidating inside a major volatility compression model right beneath historical distribution zones.
The index is displaying strong buy-side momentum today, trading up **+0.79% at 7,499.35**, pushing directly into critical overhead trendline barriers.
---
### 🔍 Geometry of Compression & Overhead Ceilings:
1. **The Volatility Squeeze:** Following the historical peak established at **7,628.64**, price action initiated a healthy mechanical cooling phase. This rotation has localized into a tight symmetrical consolidation triangle (bounded by the converging red diagonal lines). Today's bullish expansion candle is testing the exact upper descending trendline of this pattern.
2. **The Structural Supply Stack:** If buyers successfully trigger a daily close above this immediate diagonal line of trend, the index will immediately confront a heavy horizontal resistance cluster:
* **Intermediate Supply Barrier:** Locked at **7,573.72** (the lower red horizontal line).
* **Absolute Macro Ceiling:** Positioned at **7,628.64** (the upper red horizontal line).
---
### 📈 Trend Health & Support Baselines:
Despite the near-term structural consolidation, the broader macro architecture remains exceptionally constructive and aligned with absolute bullish dominance:
* **Medium-Term Filter:** The rising **72-period SMA (orange line sitting at 7,166.45)** provides steady dynamic support.
* **Long-Term Anchor:** The institutional **200-period EMA (purple line sitting at 6,920.24)** remains the primary line of defense for the broader bull market market regime.
* **Major Horizontal Flip:** Below current prices, the **7,264.58** horizontal baseline stands as a massive structural support cushion.
### Tactical Framework:
We are at an aggressive decision point. Entering heavy long exposure directly into a converging diagonal ceiling and a horizontal supply pocket carries unfavorable near-term risk/reward metrics.
Our systematic playbook favors a two-pronged approach:
1. **The Breakout Scenario:** A decisive, high-volume daily close above the descending trendline and **7,573.72** will validate a structural expansion sequence to challenge new all-time highs beyond **7,628**.
2. **The Rejection Scenario:** A failure to break through this ceiling will likely trigger a localized mean-reversion rotation back toward the lower boundary of the triangle or a retest of the rising **72 SMA (7,166)**, which would offer a highly optimized discount entry window for long re-accumulation.
---
📊 **ChartPro Data**
*US Equity Architecture, Volatility Squeeze Models & Institutional Supply Sourcing.*
⚠️ **Disclaimer:** For educational and informational purposes only. This technical framework represents a personal trading model and does not constitute financial or investment advice. SPX Navigates a Multi Timeframe Symmetrical TriangleWe spoke on Market Wide Squeeze and the Defensive Rotation a few days ago. Let's touch on it again.
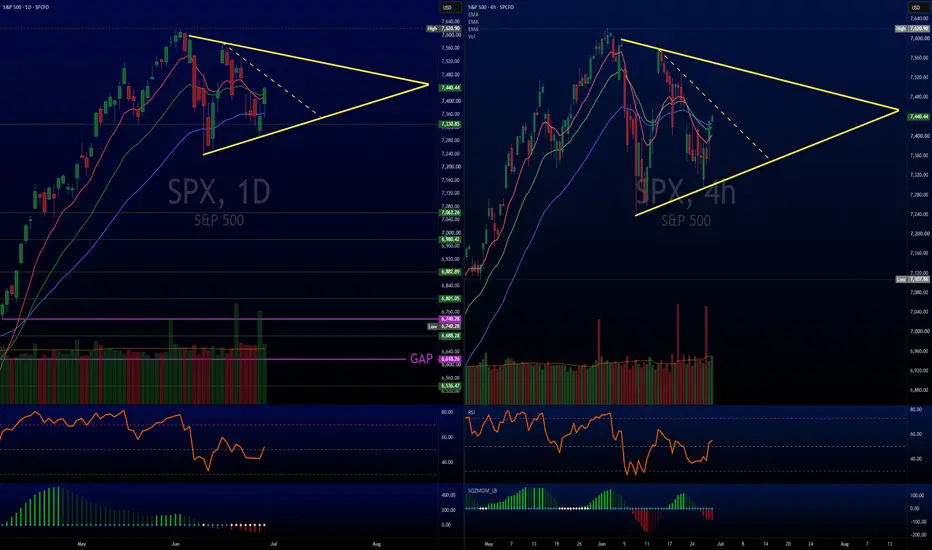
When a market enters a heavy consolidation phase, tracking multiple timeframes is the only way to separate true institutional direction from daily noise. Right now, the SPCFD:SPX is carving out a massive, clean Symmetrical Triangle pattern that is rapidly approaching its apex.
The Pattern: Equilibrium Ready to Uncoil
A symmetrical triangle represents absolute equilibrium. A sequence of lower highs and higher lows where price is compressed into a tighter corner.
Textbooks love to label these as continuation patterns that theoretically resolve in the direction of the dominant trend (which would be up). However, a recent look at Crude Oil NYMEX:CL1! serves as a perfect reality check: oil formed a textbook triangle, failed to find buyers, and broke violently to the downside. The lesson? Do not front run a triangle; let the market breach the boundaries first.
The Structural Setup: Multi-Timeframe Divergence
Dropping down to the 4Hr chart reveals a fascinating disconnect from the daily macro view:
The Daily Compression:
The macro chart remains completely locked down in a volatility squeeze. Price is tightly coiled, churning sideways right on top of major daily moving average support shelves.
The 4-Hour Rejection:
On the 4Hr timeframe, the volatility gates are wide open, meaning there is plenty of room for fast price movement. We recently saw a sharp rally straight into the upper descending trendline, followed by an immediate, aggressive rejection by institutions. That rejection was so rapid that 4Hr momentum flipped instantly from green to red, pinning price right back down against the lower ascending trendline.
The Game Plan: Tracking the Apex
Price is bouncing at a critical decision point right at the absolute floor of the triangle structure.
The Bearish Scenario:
If support fails and price breaks firmly below this lower ascending yellow trendline, it will act as the catalyst that forces the macro daily squeeze to fire to the downside. This opens the door for a rapid, trending flush toward the deeper downside gap zones.
The Bullish Scenario:
If this lower trendline holds, expect a tactical bounce right back up toward the upper descending line, which will keep the daily macro squeeze cooking a little longer. A clean, high volume breakout above the upper descending trendline would invalidate the near-term bearish distribution, officially uncoiling the daily squeeze to the upside for a run at new highs.
The Bottom Line:
We are in a high stakes environment where the market is deciding its next multi-week direction. Protect near-term capital, avoid getting chopped up inside the middle of the pattern, and wait for the definitive daily closing print outside the trendlines to dictate your next major trend allocation.
UNITDSPR: 221-Point Price Squeeze Near Decision Zone🔥 UNITDSPR: 221-Point Price Squeeze Near Decision Zone — What Happens Next? 📊
United Spirits Limited (UNITDSPR) is currently trading inside a well-defined Symmetrical Triangle pattern. The price range has been getting smaller over the last few weeks, suggesting that the stock is moving towards an important decision point.
________________________________________
📐 Chart Structure
The current pattern is formed by lower highs and higher lows.
Key Levels
Pivot A (Base High): 1,431.00
Pivot B (Base Low): 1,210.00
Pivot C (Recent High): 1,398.00
Pivot D (Recent Low): 1,229.00
As these levels continue to come closer together, the stock is moving into the narrow end of the triangle.
Pattern Measurement
Pattern Size: 221.00 Points
Upper Reference Level: 1,558.70
Lower Reference Level: 1,008.00
These levels are based on the size of the current chart pattern and are used only as reference points for educational analysis.
________________________________________
📉 What Volume Is Showing
Volume has generally been falling during May and June while the stock continues to move inside the triangle.
This is often seen in healthy triangle patterns. As buyers and sellers wait for direction, trading activity slows down and the price range becomes tighter.
A future move with stronger volume may help confirm the next phase of the trend.
________________________________________
👀 Levels Worth Watching
Situation What To Watch
Price Moves Higher Daily close above the upper trendline along with stronger volume
Price Moves Lower Daily close below the lower trendline along with stronger selling activity
At the moment, price is still trading inside the triangle, so the pattern remains incomplete.
________________________________________
⚠️ Important Reference Levels
On The Upside
1,398.00 remains an important resistance area.
A sustained move above this level would change the current chart structure.
On The Downside
1,229.00 remains an important support area.
A sustained move below this level would weaken the current pattern.
These levels help us understand whether the triangle remains valid.
________________________________________
📊 Simple Technical View
The stock is currently in a phase where neither buyers nor sellers have full control.
Price is moving within a smaller and smaller range, while volume continues to reduce. This type of setup often attracts attention because a stronger move can sometimes follow after a long period of consolidation.
For now, the chart remains a good example of how markets pause before choosing their next direction.
________________________________________
📚 Educational Note
This analysis is shared to demonstrate how triangle patterns, support levels, resistance levels, and volume behaviour can be studied on a price chart.
________________________________________
💬 Community Discussion
Would you prefer waiting for a clear daily close outside the triangle before forming a view, or are you already watching the price action closely as it approaches the apex?
Share your thoughts below.
________________________________________
Disclaimer:
This publication is intended solely for educational and informational purposes. It is based on chart structure and historical price action and should not be considered investment advice, trading advice, or a recommendation to buy, sell, or hold any security. Please conduct your own research before making any investment or trading decisions.
 Long
Long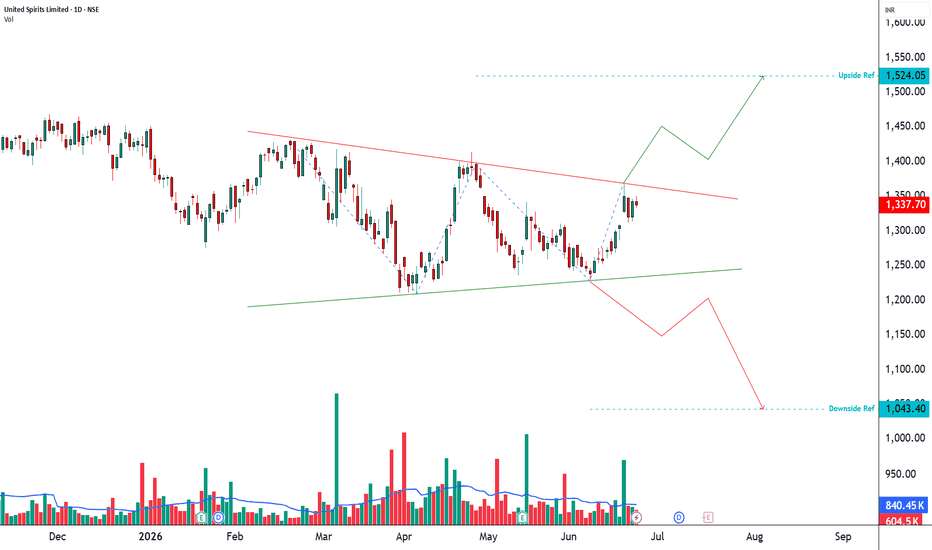
OFSS: Volatility Coiling for an Imminent 1,938-Point Move!🔥 OFSS: Volatility Coiling for an Imminent 1,938-Point Move! 🚀
Oracle Financial Services Software Limited (OFSS) is currently trading at a critical decision point as price compresses into the apex of a well-defined Symmetrical Triangle. With volatility steadily contracting and structure tightening around Pivot D, the market appears to be storing energy for a directional move that could exceed 1,900 points.
________________________________________
📐 Pattern Structure: Symmetrical Triangle
The current formation reflects a classic battle between buyers and sellers:
Pivot A (Base Low): 8,646.50
Pivot B (Base High): 10,584.50
Pivot C (Higher Low): 9,050.00
Pivot D (Lower High / Current Level): 9,925.00
This sequence of higher lows and lower highs has produced a textbook Symmetrical Triangle, a pattern known for generating powerful expansion phases once compression reaches its final stages.
Pattern Metrics
Implied Pattern Height: 1,938.00 points
Upside Ref: 11,863.00(as per pattern metrics)
Downside Ref: 7,987.00(as per pattern metrics)
The key takeaway is simple: the longer the compression persists, the more meaningful the eventual breakout tends to become.
________________________________________
📉 Volatility Profile
One of the strongest confirmations of this setup is the behavior of volume.
Throughout the May–June consolidation phase, participation has gradually diminished, producing a clear contraction in traded volume. This decline in activity is precisely what technicians expect to see during the development of a healthy Symmetrical Triangle.
Lower volume during consolidation followed by volume expansion at breakout often marks the transition from accumulation/distribution into trend continuation.
________________________________________________________________________________
🎯 Execution Triggers
Scenario Trigger Confirmation Projection
Upside Ref Daily Close above 9,925.00 Volume ≥ 2x recent average 11,863.00
Downside Ref Daily Close below 9,050.00 Strong volume expansion 7,987.00
________________________________________________________________________________
Patience is critical. Premature entries inside the triangle often result in whipsaws as price continues to oscillate within the contracting structure.
________________________________________
⚠️ Risk Management & Invalidation
For Bullish Participants
Entry only after a confirmed daily close above 9,925.00
Initial protective stop below 9,050.00
Conservative traders may trail stops as new swing lows develop after breakout
For Bearish Participants
Entry only after a confirmed daily close below 9,050.00
Protective stop above 9,925.00
Avoid initiating shorts while price remains trapped within the triangle
The most important rule here is respecting the boundaries of the structure. Until either Pivot C or Pivot D is decisively breached, OFSS remains in compression mode.
________________________________________
📊 Technical Perspective
Symmetrical Triangles are neutral by nature—they do not predict direction, they predict expansion.
At present, OFSS is approaching the latter stages of its consolidation cycle. The narrowing price range, declining volatility, and fading volume profile collectively suggest that a significant directional move may be approaching.
The market is essentially advertising one message:
A large move is likely coming. The only missing piece is direction.
________________________________________
💬 Community Discussion
Are you accumulation-heavy here or waiting for the 9,925 breakout trigger before committing capital?
Let me know your view below.
Disclaimer :
This analysis is shared purely for educational and informational purposes and should not be considered investment advice, research advice, or a recommendation to buy, sell, or hold any security. The chart patterns, price levels, targets, and technical observations discussed are based on historical price action and market structure, which may change without notice. Markets involve risk, and all trading and investment decisions should be made after conducting your own research and assessing your risk tolerance. Past performance is not indicative of future results.
 Long
Long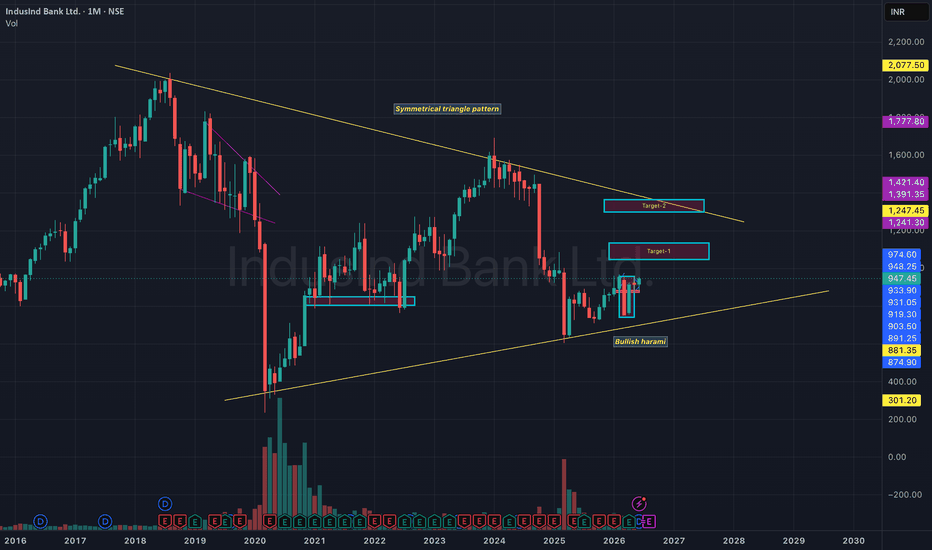
BlackRock ($BLK): Symmetrical Triangle CompressionBlackRock ( NYSE:BLK ): Symmetrical Triangle Compression – Range Inefficient Trading vs. Macro Breakout Vectors
### 💼 BlackRock Inc. ( NYSE:BLK ) Daily Technical Framework (Ref: BLK_2026-06-17_10-12-33.png)
We are tracking a highly defined, multi-month structural compression pattern on BlackRock Inc. ( NYSE:BLK - NYSE) on the Daily (1D) chart.
The stock concluded its last formal session up **+0.29% at 1,052.23**, with pre-market data prints hovering slightly lower near **1,050.11**. Price action is now deeply locked inside a massive, tightening **Symmetrical Triangle** framework, which is developing within a broader macro consolidation trading range.
---
### 🔍 Structural Geometry & Cluster Confluence:
1. **The Overhead Descending Trendline (LTB):** Connecting the structural lower highs since the January peaks. Price is currently expanding upward toward a retest of this diagonal supply barrier (as indicated by the immediate blue arrow).
2. **The Lower Ascending Trendline (LTA):** Formed by the consecutive higher lows established since March, providing a reliable demand floor for swing long positions.
3. **The Exponential Moving Average Cluster:** Both the long-term **200-period EMA (blue line at 1,046.25)** and the intermediate **72-period EMA (red line at 1,039.72)** have completely flattened out and entangled. This behavior is a textbook indicator of a non-trending, highly compressed market equilibrium where moving averages act as an axis rather than a dynamic trend guide.
4. **The Macro Range Limits:** The overall accumulation block is heavily defined by two major horizontal boundaries: resistance supply at **1,108.48** and a key historical demand floor at **985.17**.
---
### ⚡ Operational Playbook: Two-Phase Execution
* **Phase 1: Inside-the-Range Mean Reversion (Immediate Setup)**
As long as the price remains bound within the converging boundaries of the triangle, the optimal strategy focuses on range-bound execution. Traders can look to deploy capital to short/sell near the upper diagonal LTB and buy/long near the lower diagonal LTA, capturing the rotational waves (noted by the alternating blue and red internal vectors).
* **Phase 2: The Apex Volatility Expansion (The Breakout Setup)**
As the price action pushes closer to the apex of the triangle, volatility will inevitably collapse before exploding into a directional expansion. We must maintain high alertness for a decisive daily candle close outside either trendline boundary:
* **Upside Escape:** A clean breakout above the LTB opens a rapid liquidity pocket to test the **1,108.48** macro ceiling.
* **Downside Escape:** A breakdown below the LTA (as projected by the large red extension arrow near the apex) will signal a major institutional distribution phase, paving the way for a sharp wave downward into the crucial macro baseline support floor at **985.17**.
### Summary:
Trade the boundaries with tight risk definitions for now, but save core allocation capacity for the ultimate breakout confirmation.
---
📊 **ChartPro Data** | By Rogerio Zaglia
*Institutional Asset Research, Geometric Compression & Systematic Range Management.*
⚠️ **Disclaimer:** For educational and informational purposes only. This technical analysis represents a personal trading framework and does not constitute financial or investment advice.  Education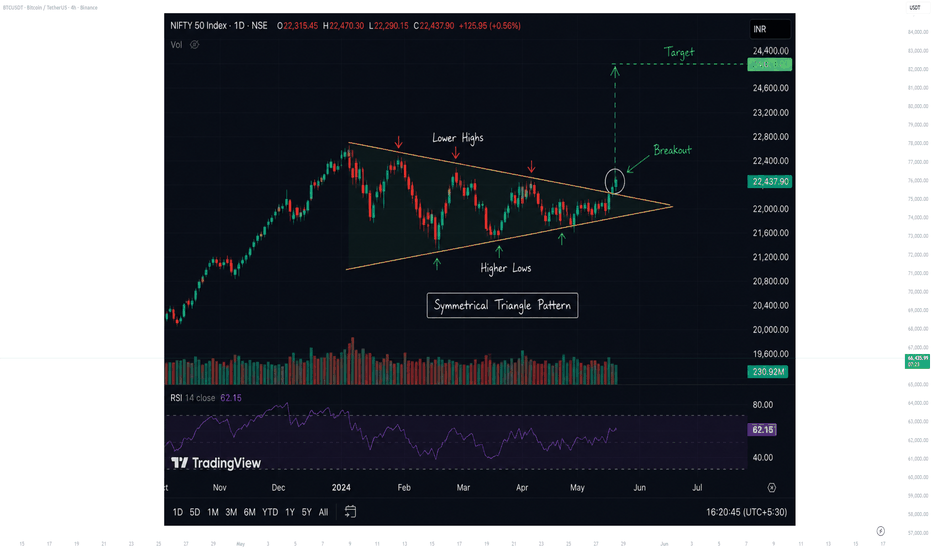
Gold Futures Update: Price Action Squeezed Inside Tight TriangleGold Futures ( COMEX:GC1! - COMEX) is displaying a classic volatility compression framework on the Daily (1D) chart, with price action tightly coiled inside a prominent symmetrical triangle.
As highlighted by the yellow circle, the precious metal is undergoing a massive liquidity build-up, indicating that a major directional expansion is approaching.
### Key Structural Clusters:
* **The Symmetrical Squeeze:** The asset is currently bound between a descending line of resistance (LTB) and a rising line of short-term support (LTA), leading the price directly toward the pattern's apex.
* **The Institutional Demand Floor (4,381 - 4,408):** The lower boundary of this triangle features exceptional technical confluence. It rests immediately on top of the critical horizontal support wall at **4,408.3** and is heavily backed by the long-term **200-period Exponential Moving Average (EMA 200 - purple line at 4,381.3)**.
* **Macro Overhead Targets:** Should buyers validate a clean structural breakout above the triangle, the primary macro resistance targets remain firmly established at the horizontal red zones of **4,787.3** and **4,901.3**.
### Tactical Outlook & Execution Strategy:
Trading inside the absolute apex of a symmetrical triangle carries a low probability for directional swing-trading due to choppy, mean-reverting behavior. The professional approach mandates waiting for a confirmed breakout:
1. **The Bullish Expansion Scenario:** A daily candle close with strong volume above the descending LTB will signal a continuation of the primary macro uptrend, offering high-odds setups to target the upper horizontal levels.
2. **The Bearish Test Scenario:** If selling pressure breaks the lower trendline, a swift flush into the 4,408 - 4,381 block is expected, where institutional order absorption will likely offer a major long defensive setup.
Patience is our edge. We will let the market break the boundaries of the apex before establishing fresh swing positions.
---
📊 **ProData Chart** | By Rogerio Zaglia
*Technical Analysis, Price Action & Global Macro Strategy.*
⚠️ **Disclaimer:** For educational and informational purposes only. This study does not constitute investment advice or trading recommendations.  Short
Short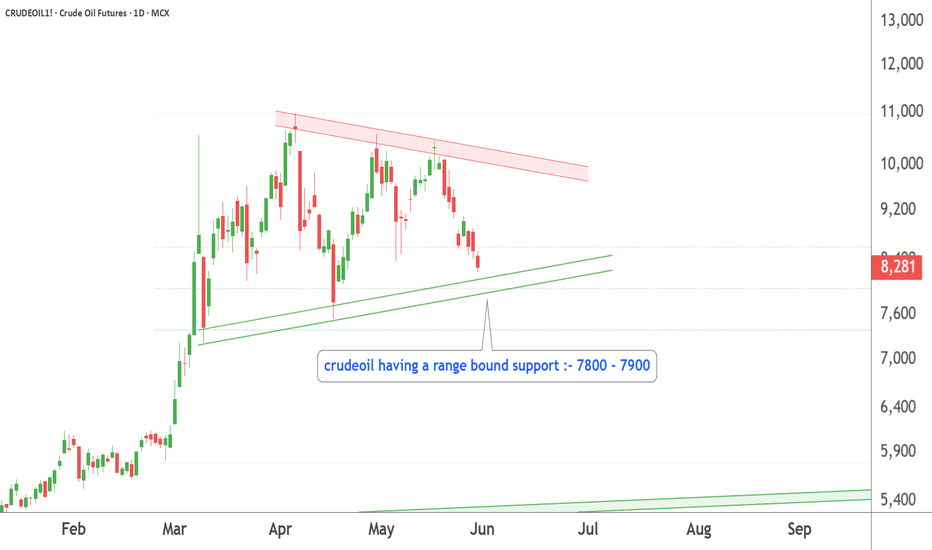
 Short
Short
FTSE 100 Daily: Symmetrical Triangle Breakout Looming at Key LonThe UK 100 (FTSE 100 Index) is presenting a highly textbook technical structure on the Daily Chart, consolidating within a large Symmetrical Triangle pattern.
As a core benchmark for European markets, tracking these macro compressions provides excellent high-probability setups for position and swing traders.
### Key Technical Insights:
* **The Symmetrical Triangle Compression:** Following a powerful long-term bull run, the index has entered a healthy consolidation phase. The price has captured liquidity at the lower ascending trendline and is now actively testing the upper descending resistance line.
* **Key Overhead Resistance Levels:** A successful breakout faces immediate horizontal resistance at the **10,635 level** (previous structure high). Beyond that, the ultimate macro target sits at the major historical peak of **10,910**.
* **The EMA 200 Baseline:** The long-term trend remains firmly bullish, beautifully supported by the rising 200-Period Exponential Moving Average (purple line currently climbing near 9,936), keeping the structural buyer bias intact.
### Strategic Scenario (The Breakout Sequence):
The green arrows on the chart illustrate the expected technical behavior as liquidity dries up near the apex:
1. **Short-Term Rejection/Retest (First Arrow):** A minor, healthy intraday pullback from the upper trendline to retest internal local support within the triangle structure.
2. **The Bullish Expansion (Second Arrow):** A decisive daily close above the descending trendline, triggering momentum to attack the 10,635 resistance barrier and opening the doors for a macro continuation rally toward 10,910.
### Execution Takeaway:
Watch the daily close carefully. A confirmed breakout from this compression pattern will offer a highly favorable risk-to-reward ratio for long positions, using the triangle's lower support line for risk definition.
---
📊 **ProData Chart** | By Rogerio Zaglia
*12+ years of daily global market technical analysis.*
⚠️ **Disclaimer:** This analysis is for educational and informational purposes only. It does not constitute financial advice or an investment recommendation. Past performance is not indicative of future results.  Short
Short