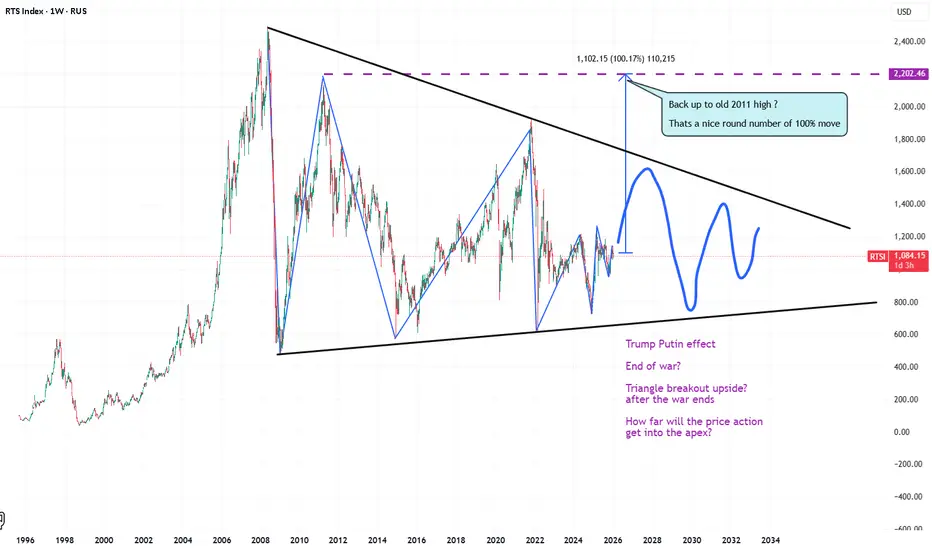
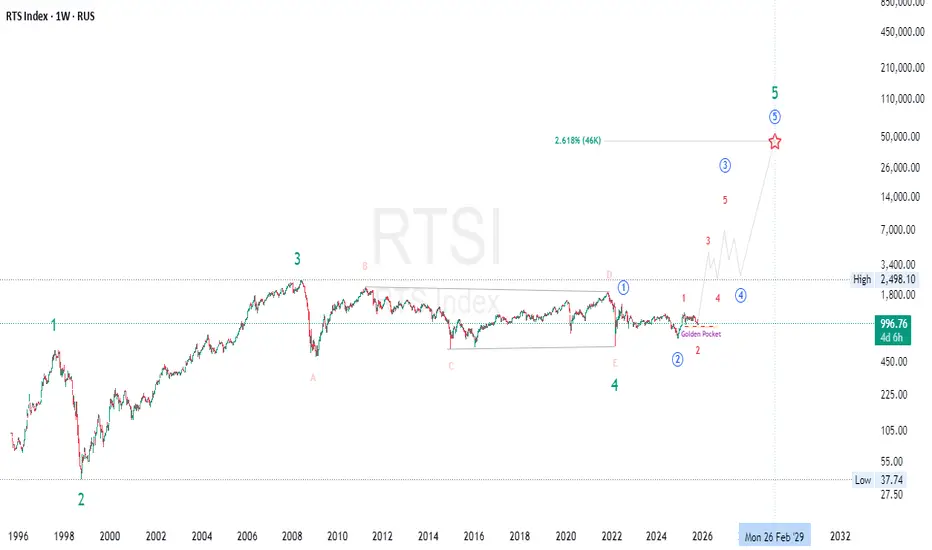
RTS IndexRTS IndexRTS Index

RTS Index

No trades
No trades

Compare with RTS index


RTS market breadth


Advancing and declining
AdvancingDeclining
39 · 89%5 · 11%
Net advances
+34
A/D ratio
7.80
Up / down volume
40.1 M / 3.7 M
New highs and lows
‪−2.4%‬
‪−1.2%‬
‪0.0%‬
‪1.2%‬
‪2.4%‬
1W
1M
3M
1Y
−1
−1
0
1
1
New highs
New lows
Net highs, %
Above moving averages
20-day93%
50-day86%
200-day30%
Outperforming the index
Over 1 month30%
Over 3 months82%

Equal-weight vs RTS, 1M−2.2%

Index info


The RTS Index tracks the performance of the largest and most liquid Russian companies traded on the Moscow Exchange, covering key sectors like energy, finance, and metals. Unlike the MOEX Russia Index, which is calculated in Russian rubles, the RTS Index is calculated in US dollars, making it highly sensitive to changes in the ruble-to-dollar exchange rate. It is weighted by free-float market cap, meaning massive energy and banking giants like Lukoil, Sberbank, and Gazprom carry the most weight in its daily price swings. Global investors and traders use the index to track the overall health of the Russian stock market and speculate on raw material prices.

See all ideas 

Summarizing what the indicators are suggesting.
Oscillators
Neutral
Oscillators
Neutral
Summary
Neutral
Summary
Neutral
Summary
Neutral
Moving Averages
Neutral
Moving Averages
Neutral
Displays a symbol's value movements over previous years to identify recurring trends.