How long will the Russian war last ? Chart clues ?Observations from the price action of the Russian Index
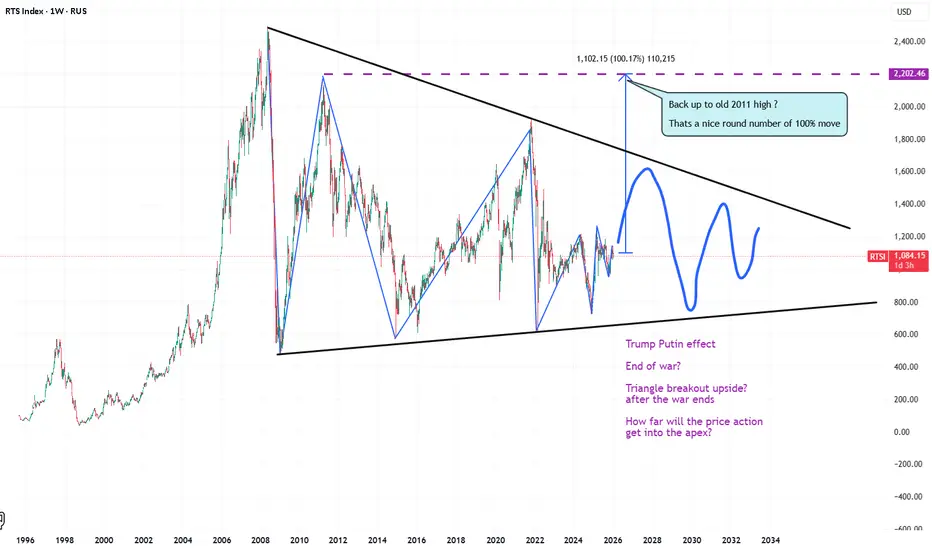
I can see a macro long term triangle forming on the Russian index
As the price eventually pushes into the apex it will pop out upwards or downwards
This price movement into the apex may give a clue as to how long the war will last.
If the price moves out of the triangle, before the war is officially over the people in the know maybe telling us that the war is ending. ie if the price breaks the upper or lower trend line
Unfortunatel
RTS Index
No trades
No trades
In-depth trading ideas
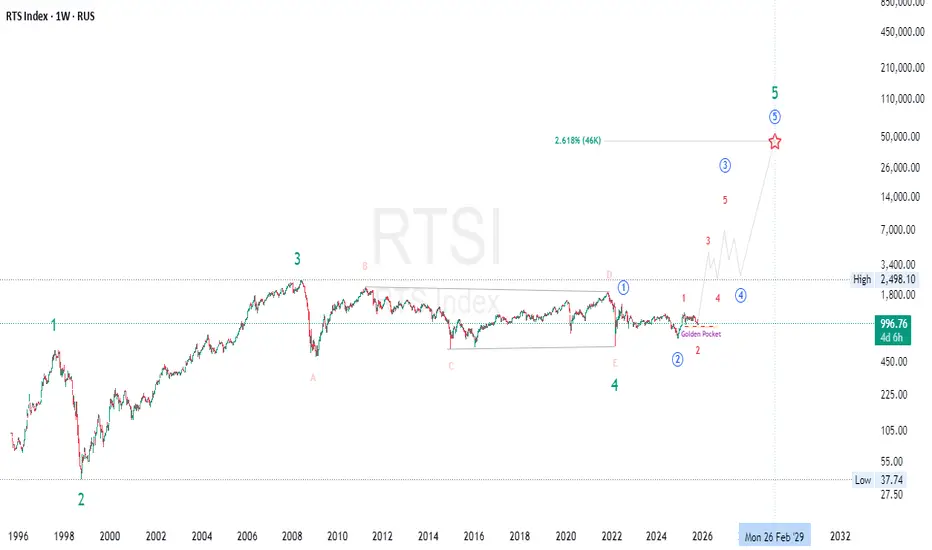
"Smart Money Alert | RTS Index Could Hit 40,000+"🚀 The next big wave isn’t coming — it’s already forming.
RTSI – The Birth of a New Macro Wave! 🌊
The RTS Index (RTSI) appears to have completed a multi-decade Elliott Wave cycle correction — setting the stage for a massive Wave 5 expansion.
📉 Wave Breakdown:
🌊 Wave 1: The early post-1998 surge — the birth of a new trend and Smart Money accumulation.
⚡ Wave 2: The healthy pullback that shook out weak hands while keeping higher lows intact.
🔥 Wave 3: The impulsive macro rally
The Russian market is about to explode higherThere is something about an ABCDE correction progressively getting more and more impulsive towards its completion - you can predict with 95% certainty that the correction is over and the next move is clearly in the direction of the trend of the upper degree.
1800+ should be hit before April-May 2026.
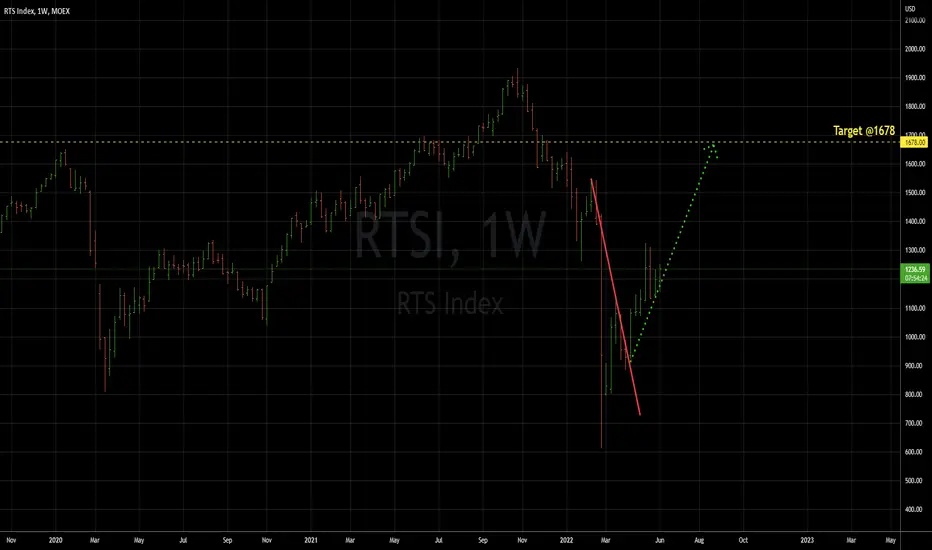
RTS IndexCurrently RTS index is testing the resistance around 920. The resistance level is strong and RTS will consolidate below this level. RTS has been in major consolidation since 2011 and now the spring will be compressing, preparing for a major decline. Targets are mentioned on chart.
More likely the third target will play out in this scenario, which means around 75% decline from current levels.
Cancellation of this scenario will be in case of fixation above 1240.
DYOR
NFA
The 2023 master plan is pretty clearThere will be an overwhelming amount of events happening in H2'23:
- A crash in Treasuries (10Y above 10%)
- A crash in EURUSD (0.75 is waiting)
- A totally unexpected move in USDJPY to 100
- A crash in SPX below 1500
- A crash in RTS to 250..300
- A silent withdrawal of financing of Ukraine by US and EU
- Peace talks RU <> UA on Russian's terms
RTSI - possibly greater downfall ?Against the background of the expectations of tougher sanctions together with the absence of obvious peaceful ways to resolve the problem with Russian war of aggression, plus the structural degradation of the economy and "SME" business defaults and export embargo, here it comes an understanding is coming of a probably deeper slide for RTSI. Forecasting is a thankless task anyway.
1050 should be reached before the crash resumesA new minor high is due in the next couple of weeks. The Russian market will be lifted by the last bullish wave worldwide. Then the downtrend will resume.
7 months to form 1-2-1-2, means at least another 7 months to hit the low. It's not about Russia: the crash will be a worldwide affair. It will be destructive, will take its time to make the markets suffer, and the recovery won't be easy. The entire 2023 will be just bad across the globe.
Russia - RTS$ Index - Does this suggest War will go end? Does this suggest War will go end?
A multi-year triangle gives us a clue.
Triangles are one of the most recognizable patterns in the Elliott Wave Principle. As with all wave patterns, they occur at every time scale and the large-degree triangles are especially interesting because they often contain a notable socionomic element.
Large-degree triangles in rallies are bear markets. Sideways movement in nominal terms means that, with consumer price inflation generally positive, in real terms,
RTSI UpdateMy interpretation is that the Russian Stock market has restarted its descend to new lows. Lots of people feel relieved and optimistic today argueing that the market will continue going up despite geopolitics. I looked at the recent advance (propelled by abrupt ruble strengthening) as a bounce. As technically the count has not been completed and there was no divergence on RSI.
If some form of embargo is a trigger the market can take a deep dive and stay at lower levels for a while.
Russian Market Close Up A closer view of the Russian Market. The triangle is notional and can turn out to be a wxy combination. However, since there was no triangle spotted on the way down so far there is a fair chance we will have it here near the bottom. Given the bigger picture posted previously the chance to load Russian stocks will come somewhere in May or maybe later during the summer.
Russian Market Long-term ViewThe Russian market picture is getting clearer with the latest abrupt decline. There is a chance that in the coming years we will see 400%+ growth. As to from when exactly and what stocks to buy - I will cover separately. Stay in touch.
Suffice to say that in an expanding triangle we could expect wave e to travel beyond the a-c-e trendline, hence the sell-off is not yet complete.