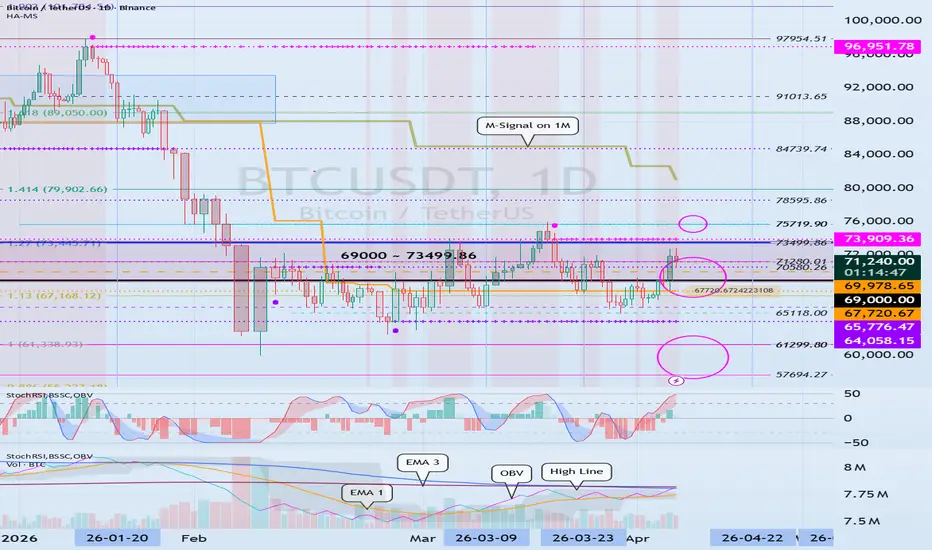
Confirming support around 69978.65
Hello?
Nice to meet you, fellow traders.
If you "follow" me, you can always get new information quickly.
Have a great day.
------------------------------------
As the price rises, the HA-Low indicator on the 1W chart is showing signs of forming at the 69978.65 point.
Accordingly, the key question is whether it can find support and rise in the range of 69978.65 to 71058.26.
However, since the StochRSI indicator is in the overbought zone and the OBV indicator is located near the EMA 3 line,
Fibonacci Projection
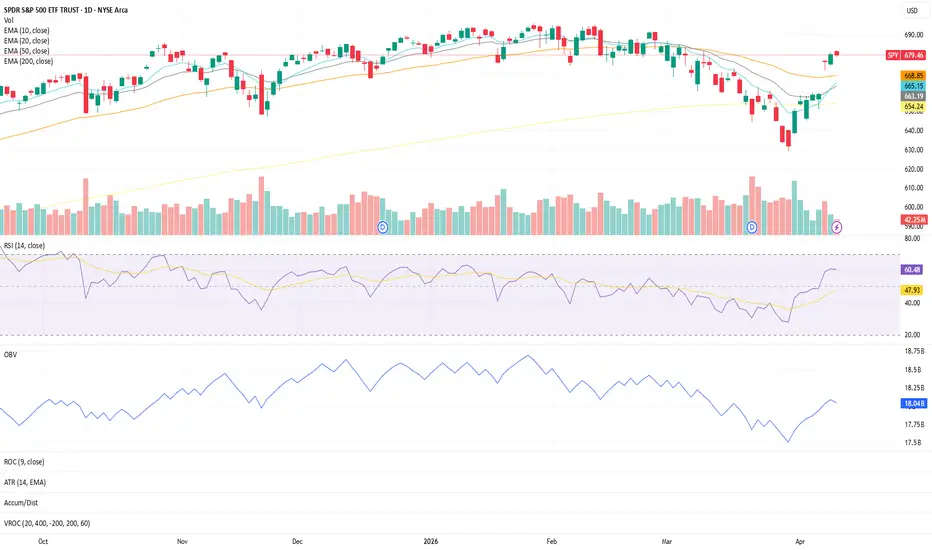
SPY Daily — Structure Holding StrongPrice continues to trade above the 10, 20, 50, and 200 EMAs, with short-term momentum building.
The 10 EMA and 20 EMA are both trending upward, showing continued short-term strength, while the 50 EMA remains flat but stable—acting as a base of support beneath price.
RSI is holding steady around 60, indicating controlled momentum without entering overbought conditions.
On the volume side, OBV has been trending higher since March 30th, suggesting underlying accumulation remains intact.
Overall
Checking for support in the 234.11 ~ 241.05 range
Hello?
Nice to meet you, fellow traders.
If you "follow" me, you can always get new information quickly.
Have a great day today.
------------------------------------
(AMZN 12M Chart)
The important point is the one marked with a circle.
The trend may be determined by whether support is found near this important point, so you need to watch it carefully.
-
(1M Chart)
Looking more closely, the key zones are:
1. 206.16 ~ 239.30,
2. Around 165.73,
3. 70.43 ~ 84.00.
To continue the stair-step
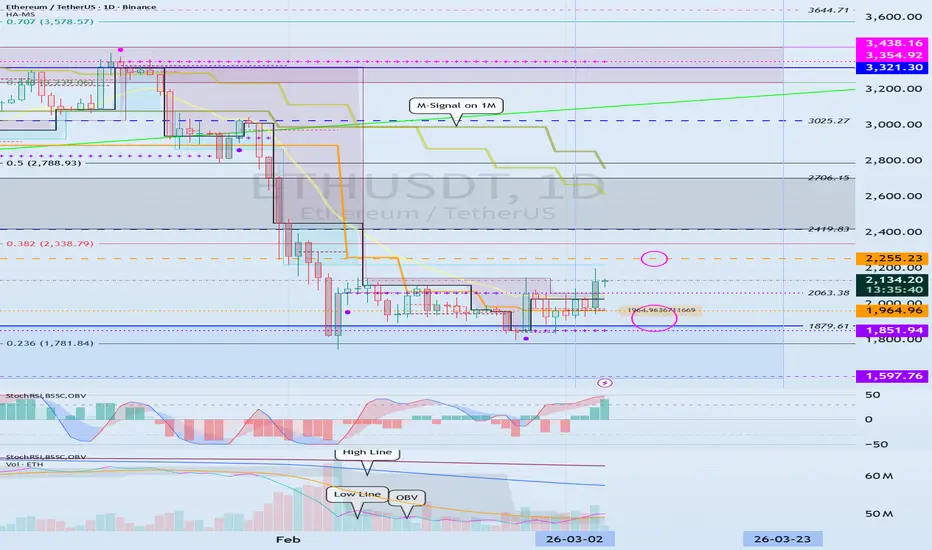
Need to confirm support in the 1964.96 ~ 2111.42 range
Hello?
Nice to meet you, fellow traders.
If you "follow" me, you can always get new information quickly.
Have a great day today.
------------------------------------
(ETHUSDT 1D Chart)
This period of volatility is expected to continue until April 3rd.
After that, the direction in which it moves is expected to be a critical factor.
The next period of volatility is expected to begin around May 2nd.
However, since BTC's volatility is expected to occur around April 22nd (April 21st–23rd), w
Next Volatility Period: Around April 22
Hello?
Nice to meet you, fellow traders.
If you "follow" me, you can always get new information quickly.
Have a great day.
------------------------------------
(BTCUSDT 1D Chart)
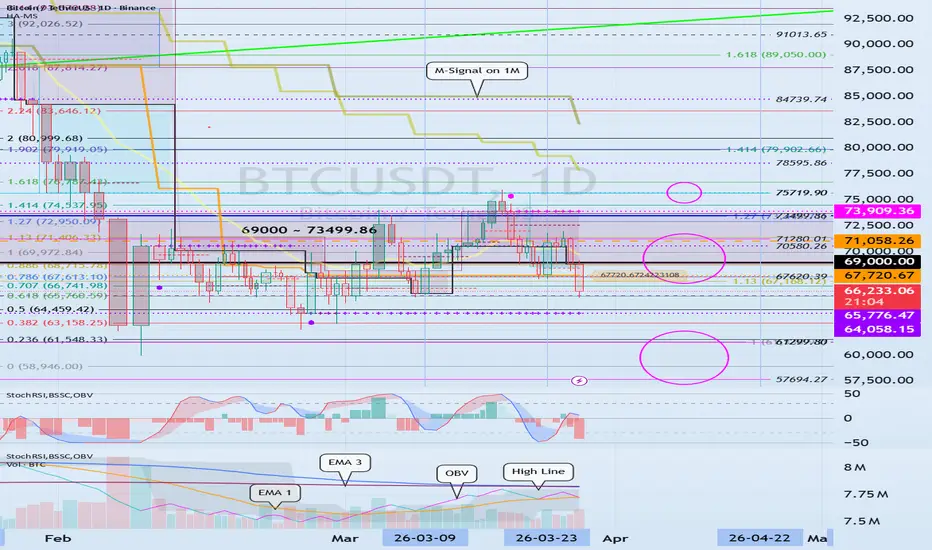
From a chart analysis perspective, the important range is between 69000.0 and 73909.36.
This is because if it falls below this level, there is a high probability that it will show a downtrend in the mid-to-long term.
Therefore, from a chart analysis perspective, I believe it is appropriate to explain countermeasu
BTC repeating 2022 pattern ??COINBASE:BTCUSD
BTC weekly pattern is repeating its pattern in 2026.
It has come back to ema200 after making 3 highs, 2 highs of divergence pattern and 1 of LH.
After that it has now broken ema200 and made a low, just like in 2022.
Then it went sideways for 39 weeks till it broke ema200;
and kept on sustaining above ema200 for next 24 weeks before it went on next upside.
What will be the possible low zone ??
2022 low was 0.786 fib level of 2020 low-2021 high swing : 16000 zone
2026 low will
Checking if the HA-Low indicator is generated at 71058.26
Hello?
Nice to meet you, fellow traders.
If you "follow" me, you can always get new information quickly.
Have a great day.
-------------------------------------
(BTCUSDT 1M Chart)
Looking at the current price level, you can see that it corresponds to the previous high zone.
Therefore, it is evident that the current price level, specifically the range of 57,694.27 to 71,280.01, is a critical zone.
-
(1W Chart)
Currently, the HA-Low indicator appears to be forming at the 71,058.26 p
Support Zone: 1964.96 ~ 2111.42
Hello?
Nice to meet you, fellow traders.
If you "follow" me, you can always get new information quickly.
Have a great day today.
------------------------------------
(ETHUSDT 1W Chart)
With this rise, the HA-Low indicator is expected to form at the 2111.42 point.
Accordingly, the key factor is whether it can find support around 2111.42.
If it finds support in the range of 1597.76 to 2111.42, it is a buying opportunity.
However, since it is currently located below the M-Signal indicator on
Check if it can rise above 216.60
Hello, fellow traders!
Follow me to get the latest updates quickly.
Have a great day.
-------------------------------------
The key is whether the price can hold above the M-Signal indicator on the 1M chart and rise above 216.60.
If it doesn't and falls, it could enter mid- to long-term investment territory, so caution is advised when trading.
To initiate an uptrend, the price must rise above the previous high of 221.46 to 262.40 and remain there.
-
The short-term low is formed in the 2
See if it can rise above 1.4033 ~ 1.4698
Hello, traders!
Follow us to get the latest updates quickly.
Have a great day!
-------------------------------------
The price is declining from important support and resistance levels, and the DOM (-60) indicator is showing signs of forming.
Therefore, the key question is whether the price can sustain above 1.2455 and rise above key support and resistance levels.
Since it has fallen below key support and resistance levels, it has entered a medium- to long-term investment zone, so caution
Divergence with confirmation signals on UAE marketsThis is for educational purposes only.
Recently, I've been asked to share my strategy that making most of my wins in UAE markets. 7 out of 10 the winning rates (no proofs)
First and foremost:
- I prefer a swing trade, and usually that may goes between 2 weeks up to 6 months.
- Daily timeframe for observation.
- 4H timeframe for confirming the strategy.
- 1H timeframe for Enter or Exit.
Be aware:
Supply and demand zones are very important.
Risk management - critical.
Price act
The main volatility period is expected to occur around March 23
Hello, fellow traders!
Follow us to get the latest information quickly.
Have a great day!
-------------------------------------
With this rally, the HA-Low indicator on the 1W chart is showing signs of forming at the 74057.90 level.
Accordingly, the key question is whether support will be available around 74057.90.
-
The OBV indicator is showing signs of rising above the High Line, suggesting a forced upward movement.
At this point, the key question is whether the price can rise above EM
The key is whether it can rise above 87.68 ~ 92.50
Hello, traders!
Follow me to get the latest information quickly.
Have a great day.
-------------------------------------
To continue the uptrend, the price must remain above 81.28.
Therefore, the key is whether it can find support in the 81.28 ~ 91.78 range and rise.
If the upward movement fails, a decline to the 27.15-36.84 level is likely, so a response plan should be considered.
Accordingly, the 66.26 level is the stop-loss point.
If the price finds support in the 81.28-91.78 range a
Next Volatility Period: Around March 23rd
Hello, fellow traders!
Please "Follow" to always get the latest information quickly.
Have a great day.
-------------------------------------
With this rise, the HA-Low indicator on the 1W chart is showing signs of forming at the 2255.23 level.
Therefore, if the HA-Low indicator forms at the 2255.23 level, it will be important to determine whether support is found near this level.
The current low on the 1D chart is between 1581.94 and 1964.96.
Therefore, if the price declines, we should c
Next Volatility Period: Around March 10th
Hello, fellow traders!
Follow us to get the latest updates quickly.
Have a great day!
-------------------------------------
A short-term low has formed between 397.21 and 418.18.
Therefore, as we move through the next volatility period, around March 10th, we need to monitor the direction in which the price deviates from the short-term lows.
If it rises, it could rise to around 480.91.
If it falls, it could touch the M-Signal indicator on the 1M chart.
-
The key is whether the price can
The coin market is expected to start its uptrend in July
Hello, traders!
Follow me to get the latest information quickly.
Have a great day.
-------------------------------------
The coin market appears to be following the larger pattern: a three-year uptrend followed by a one-year downtrend.
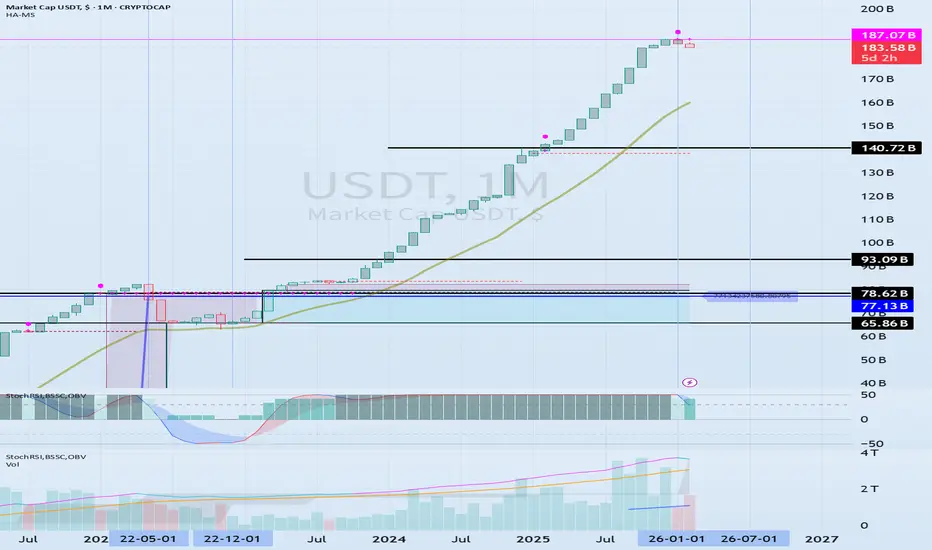
For the coin market to continue its upward trend, at least through USDT and USDC, there needs to be no outflow from the market.
However, I believe we are currently seeing an outflow of funds from the coin market.
The current price level appears to be mai
Check if support can be found around 1861.57 ~ 2063.38
Hello, traders!
Follow us to get the latest information quickly.
Have a great day.
-------------------------------------
(ETHUSDT 1D chart)
The BSSC indicator is holding above the 0 level.
However, it appears to be showing weak buying momentum.
For ETH to begin an uptrend, the On-By-Value (OBV) indicator must rise above the High Line.
Therefore, the channel formed by the Low Line and High Line must contract.
This could lead to a prolonged sideways movement.
The next volatility period f
Checking for support near 65760.59
Hello, traders!
Follow us to get the latest information quickly.
Have a great day!
-------------------------------------
Looking at the On-By-Volume (OBV) indicator on the 1D chart, we can see that the High Line has fallen, forming a converging Low Line ~ High Line channel.
Therefore, volatility is expected to occur soon.
The expected volatility period is around March 9th (March 8th - 10th).
-
However,
If BTC dominance and USDT dominance show a simultaneous decline,
Volatility is lik
Next Volatility Period: Around March 9th
Hello, fellow traders!
Follow us to get the latest information quickly.
Have a great day!
-------------------------------------
The M-Signal indicator on the 1M, 1W, and 1D charts is useful for monitoring the overall chart movement.
A major uptrend occurs when the M-Signal on the 1D chart > M-Signal on the 1W chart > M-Signal on the 1M chart.
Conversely, if the M-Signal on the 1M chart > M-Signal on the 1W chart > M-Signal on the 1D chart, a major downtrend is indicated.
-
The HA-Low and
Support Zone: 0.2750 ~ 0.2809
Hello, traders!
Follow us to get the latest information quickly.
Have a great day!
-------------------------------------
(TRXUSDT 1M Chart)
It looks like there's been a significant drop, but it's still in an uptrend.
To initiate a downtrend, the price must fall below and remain below the M-Signal indicator on the 1M chart.
Therefore, from the current price level, it must fall below 0.2548.
-
Support is crucial around the HA-High ~ DOM(60) range (0.2851 ~ 0.3410).
If the price continues
The key is whether it can rise above 0.11747 ~ 0.13127
Hello, fellow traders!
Follow us to get the latest information quickly.
Have a great day.
-------------------------------------
When interpreting charts, the key is the movement of the 1D chart.
However, the 1D chart has many volatile sections, which can make it difficult to interpret.
In such cases, looking at the 1W chart can help you more easily observe the movement.
-
Looking at the 1W chart, you can see that the price has risen sharply, rising above the Fibonacci level of 0.5 (0.15
How to interpret the current movement
Hello, fellow traders!
Follow us to get the latest information quickly.
Have a great day.
-------------------------------------
The key points to watch are the HA-Low indicator and the DOM (-60) indicator.
If the HA-Low and DOM (-60) indicators provide support, then that's a good time to buy.
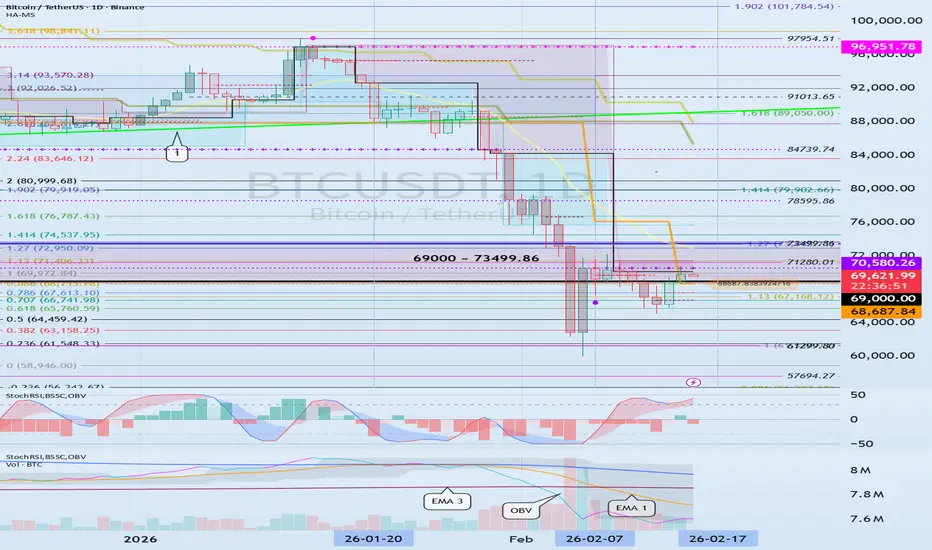
Accordingly, the key question is whether the price can rise after finding support in the 68687.84 ~ 70580.26 range.
-
The StochRSI 20, 50, and 80 indicators are displayed on the chart because they p
This Volatility Period: February 6th - 8th
Hello, fellow traders!
Follow us to get the latest information quickly.
Have a great day!
-------------------------------------
(BTCUSDT 1M Chart)
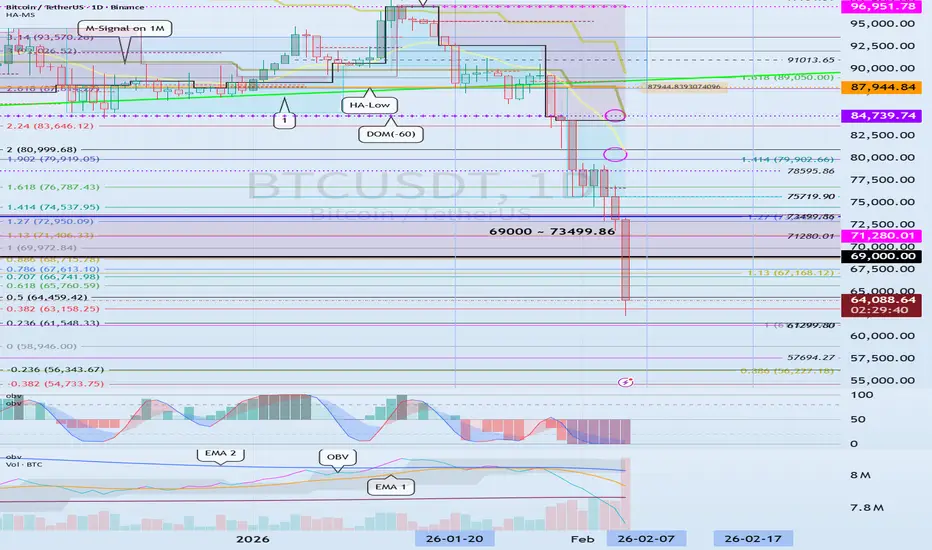
The price fell from the critical 69,000 - 73,499.86 range.
We need to see if it finds support near the previous high of 57694.27 to 61299.80.
I believe the price range it cannot return to is below the 42283.58 to 43823.59 range.
-
(1D chart)
This period of volatility is expected to last from February 6th to 8th.
Therefore, the key question i
2063.38 ~ 2261.70: Support zone forming
Hello, traders!
Follow us to get the latest information quickly.
Have a great day!
-------------------------------------
(ETHUSDT 1D chart)
The current position can be viewed from two perspectives.
First, we need to consider whether the price can rise after finding support in the 1597.76 ~ 1879.61 range.
This is because, as seen in the chart above (), if it declines, it will enter a range with no end in sight.
Therefore, to maintain the uptrend, the price must remain above the 1597.76 ~