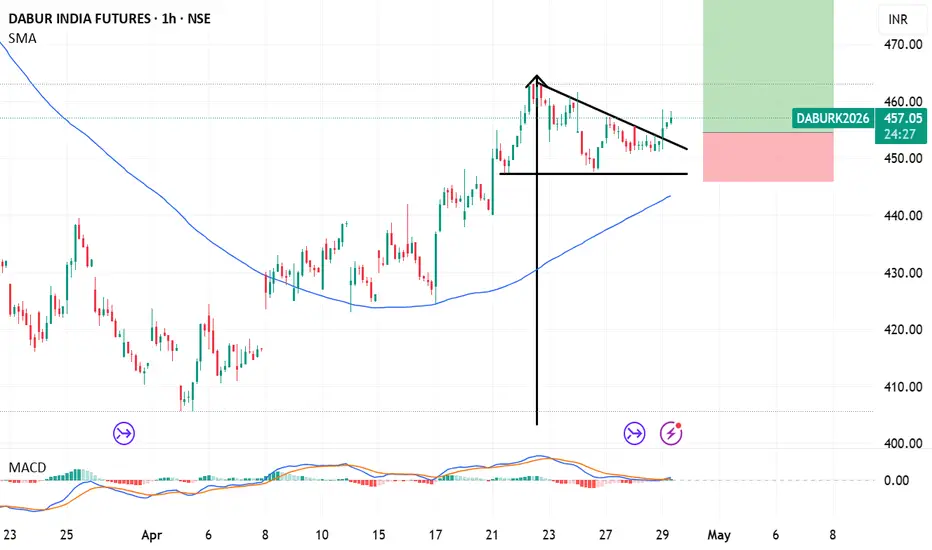
DaburDabur India Futures (DABUR) has been showing signs of consolidation and potential base-building, with analysts noting technical signals that could indicate a reversal, including a potential flag pattern on lower timeframes.
The stock has been attempting to form a base in the ₹440–₹465 range.
Action: Potential Long/Buy
Target (T1): ₹485 (Based on pattern breakout projection)
Stop Loss (SL): ₹445 (Below immediate support levels)
Key Support to Watch: ₹446–₹449
Key Resistance to Break: ₹461–₹463
Flag
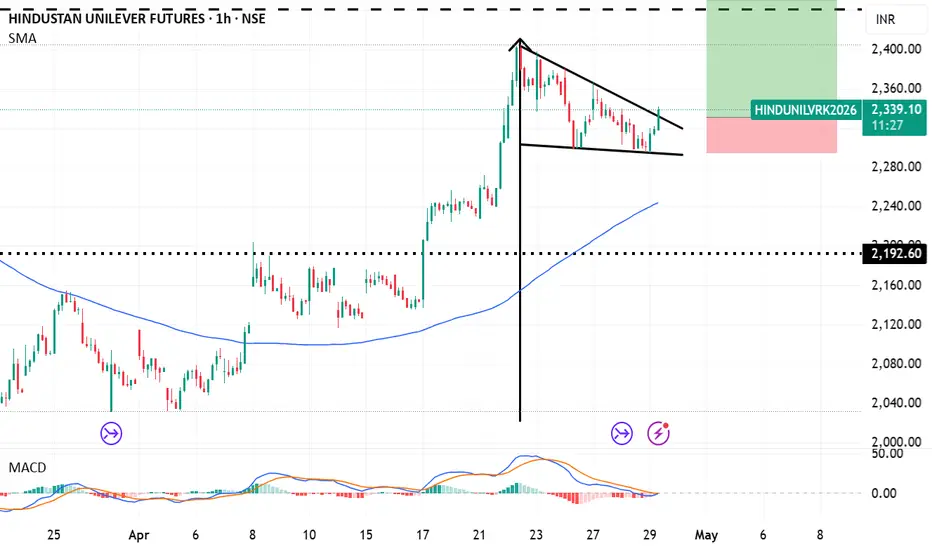
HUL Hindustan Unilever Limited (HUL) futures on the hourly chart, the identified bull flag pattern suggests a potential breakout.
Pattern: Bull Flag (Hourly Chart). This continuation pattern typically forms after a sharp price increase (the pole), followed by a brief consolidation period (the flag) before resuming the uptrend.
Stop Loss: ₹2295. This level is crucial for risk management, placed just below the recent consolidation support to protect against a trend reversal.
Target: ₹2550. This pric
SNDK Post-Earnings Breakout LevelsSandisk came out of earnings strong beat, raised guidance, and pushed into new all-time highs.
Daily closed with a 2-2-3u bullish engulfing, so momentum is clearly there. Now it’s about whether continuation shows up or we get a pullback into inefficiency.
Above $1,190 opens continuation toward $1,220, then $1294 if momentum holds.
If price loses $1,048, I’m looking for downside into $992, with $951 as the next level below.
Clean breakout vs breakdown setup. Let price decide.
CIFR: When a Bitcoin miner becomes the landlord of the AI eraCipher started by mining Bitcoin in the Texas desert, but today it is a completely different animal. The rebranding to Cipher Digital in February 2026 sealed the metamorphosis: now it is an AI infrastructure operator leasing out data center space to Amazon and Google. The company trades on Nasdaq, and everyone who understands critical infrastructure for hyperscalers is watching – because owning such assets is no longer speculation but almost a rent collection business.
Fundamentals
Next ear
BTCUSD SELL IDEABTC/USDT (4H) is compressing into a Bearish flag, within a larger ascending channel. Price is testing the upper boundary after completing a likely A–E structure. This type of formation often ends with a breakdown—looking for a rejection here could trigger a move back toward the lower channel support (~58k–60k).
Transocean Ltd (RIG) – Bullish BreakoutSummary:
RIG has broken out of long consolidation and strong resistance at 3.40 with high volume , showing strong buyer interest.
After the breakout, price pulled back and formed a flag pattern , then broke out again yesterday , confirming bullish continuation .
Trading Plan:
Entry: 4.20
Support: 3.72
Target: 5.20
Descending Channel Breakout - Sustaining below strong resistanceSSP started a bullish rally after deep retracement. Rally is backed by volume. It has broken another descending channel and so far sustaining below a strong resistance zone of 56.2 - 59.
Daily outlook is still bullish. I would expect a breakout as long as it doesn't close below 53 on daily TF (SL). If SSP breaks 56.5 and 59, then next targets would be 72 and 78 for now. Long term it might test its ALL TIME HIGH near 90.
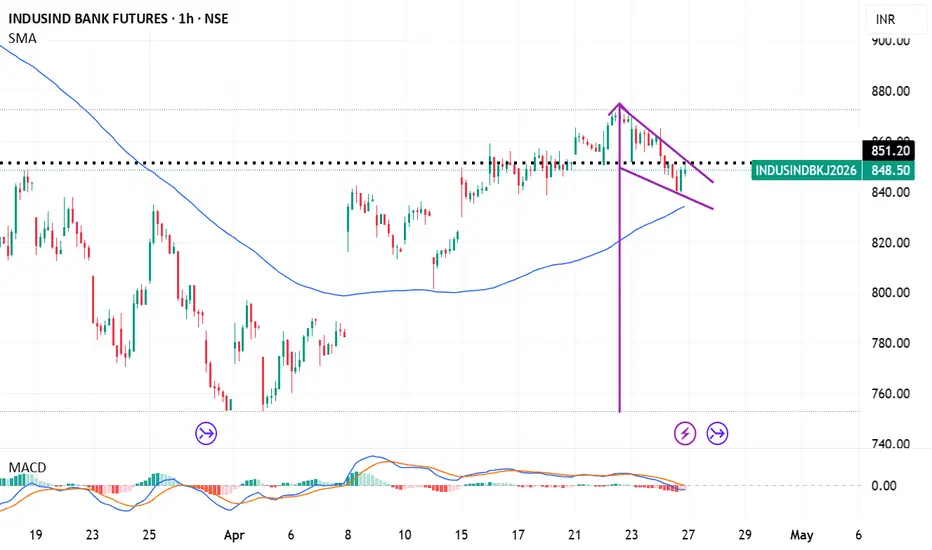
indusindBased on technical analysis of the hourly chart, here is the breakdown of the potential pole and flag setup for IndusInd Bank (INDUSINDBK) around April 24, 2026.
Pattern: Bullish Pole and Flag (Continuation Pattern)
Entry Strategy: Wait for a clear breakout above the flag resistance (around ₹865-870) on high volume on the hourly chart.
Stop Loss (SL): ₹825 (Tight SL) or below ₹820 (Ideal).
Target (T1): ₹900 (Immediate Resistance).
Target (T2): ₹920+ (Target based on flagpole height projection)
The Silent Signal: How Open Interest May Shape the Next MoveIntroduction — The Signal Beneath Price
Price is what most traders see. Participation is what most traders miss.
In futures markets, open interest (OI) offers a unique lens into market behavior — not by telling us where price is, but by revealing how committed market participants are to the move. When combined with structural tools and quantitative overlays, OI can act as a “silent signal,” highlighting shifts in conviction that price alone may conceal.
The current environment presents a com
Bitcoin Roadmap _ Macro Signals Turn Against BTCToday, I want to analyze Bitcoin ( BINANCE:BTCUSDT ) on the daily timeframe to give you a mid-term perspective. In this analysis, I’ve tried to integrate economic indices with Bitcoin’s chart to approximate what we might expect in the coming weeks—so stick with me!
Currently, on the daily timeframe, Bitcoin is moving near a resistance zone ($80,600-$78,250), Cumulative Short Liquidation Leverage ($80,600-$79,500), and the 21_SMA (Weekly).
From a classical technical analysis standpoint, on the
IREN: When a Bitcoin miner switches to AI cloudIris Energy builds vertically integrated data centers running on 100% renewable energy to mine Bitcoin and lease computing power for AI training and inference. The company trades on NASDAQ and everyone who understands the shift from mining to AI cloud is watching because this is no longer about diversification but about survival after the halving and access to 70%+ margins.
Fundamentals
The next earnings report is due May 7 2026. On April 23 the company announced its inclusion in the MSCI i
Next down leg coming We need to look at Bitcoin historically and each bear market to help guide us on what price will likely do as it tends to follow in its past movements.
We are still in bear market structure and Bitcoin usually consolidates beyond 76percent from each market cycle top. We have currently only hit around the 52 percent mark. I believe we need to come down at-least to $40k or even $31k support before we see any major price turn around. Or a new bull market start. We will likely see that type of acc
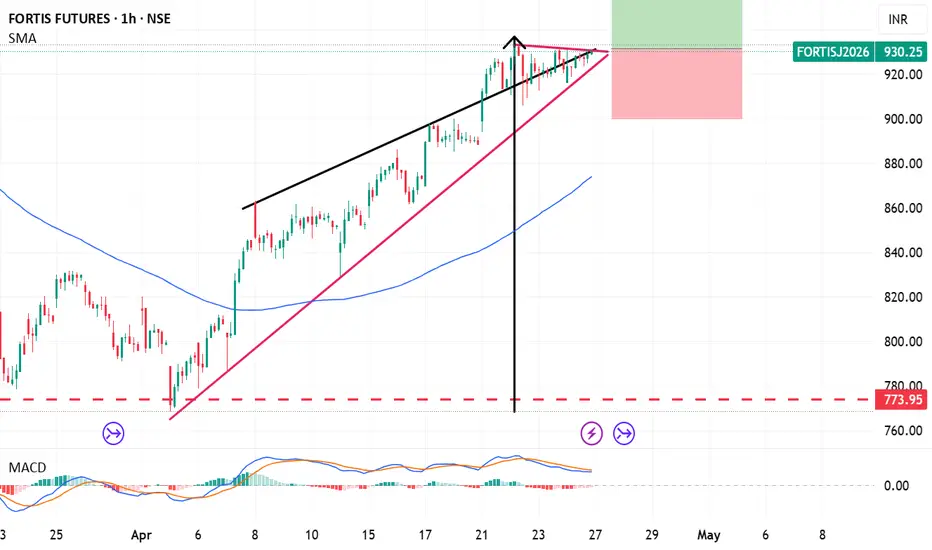
FortisBased on the provided technical parameters (1-hour chart, pole-and-flag pattern) and market context as of 24 April,bullish trade on Fortis Healthcare (FORTIS) Futures.
Entry/Current Price: ~₹920–₹930 range
Stop Loss (SL): ₹900 below the near-term support zone of ₹900–₹910
Target (Tgt): ₹1,000
Timeframe: 1-Hour Chart
Brent Crude – Pole & Flag Breakout Watch
Setup: Weekly chart shows a classic Bullish Pole & Flag formation.
Levels to Watch:
Support: $95.96
Resistance: $126.54 → $139.13
Final Target: $148.41 if breakout sustains.
Why Traders Care:
Strong pole rally already in place.
Flag consolidation tightening — breakout imminent.
Macro backdrop (energy demand + geopolitics) adds fuel to the move.
My Take: Brent is coiling for a big push — a clean breakout could open a fresh leg higher.
Community call: Is Brent heading for $148+ or will t
MSFT to fill the gap?MSFT broke out of its weekly down trend line. And then has printed a bull flag. That measured move takes you up to fill the gap above.
Caution - we’ve gone straight up (blow off top) so will we go down?
I like the $480 6/18/26 exp calls here with the breakout above the bull flag that has formed on the 4H.
Happy trading!
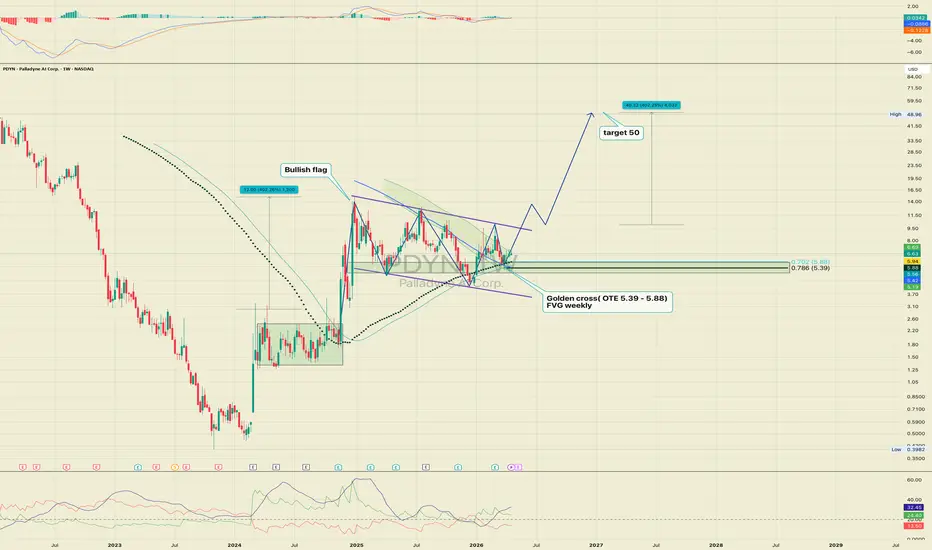
PDYN: When embodied AI meets hypersonicPalladyne AI Corp. builds embodied artificial intelligence and collaborative autonomy solutions so robots, drones and defense systems can operate independently in complex environments without constant human control. The company trades on NASDAQ and everyone who understands embodied AI is watching because this is no longer about automation but about defense, hypersonics and national security.
Fundamentals
The next earnings report is expected on May 13 2026. On March 5 the company reported fo
SILVER Ready for Bullish Expansion | Flag Breakout Setup#SILVER is currently respecting a healthy correction phase on the higher time frame, indicating strong market structure and trend continuation potential.
On the 1H timeframe, price action is forming a clean Bullish Flag, which is typically a continuation pattern after an impulsive move.
Key Observations:
Market structure remains bullish on HTF
No significant bearish signals so far
Price is consolidating within a flag formation (low volatility phase before expansion)
Trading Plan:
We are n
LRCX Next Leg Higher?Currently LRCX is in a strong uptrend that has been established over the last few weeks. What I’ve noticed here on the chart, is a strong bullish flag on the 4H time frame.
Entry here is a break above the top trend line of the flag to somewhat, front run this trade.
Safest entry - break above the top of the flag on a 4H candle close, followed by a retest of that breakout, with a bullish candle close after the retest.
Measured move takes this next leg up to around the $320 area.
BITCOIN (BTCUSD): Very Bullish Pattern
Bitcoin is positioned to grow more after a confirmed breakout
of a resistance line of a bullish flag pattern on a 4h time frame.
Expect a price rise to 77830 level.
❤️Please, support my work with like, thank you!❤️
I am part of Trade Nation's Influencer program and receive a monthly fee for using their TradingView charts in my analysis.