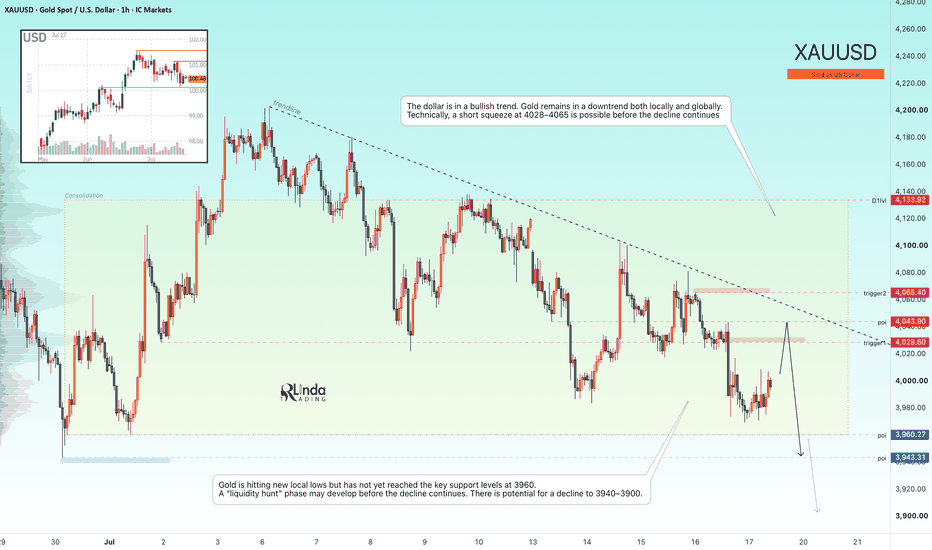
GOLD - The hunt for liquidity before the fall to 3900...FX:XAUUSD has completely unwound the bullish momentum generated by the recent news and has printed fresh local lows. The market remains in both a local and broader bearish trend, driven by persistent fundamental and geopolitical uncertainty
Gold continues to trade under pressure, with sellers firmly in control. The next key catalysts will be the U.S. Consumer Sentiment and Inflation Expectations reports. The technical outlook remains bearish, with price making new local lows while still ho
Triangle
Multi-Week Confluence Analysis: Labeled Study of RELIANCE IndustCurrently, the weekly chart of Reliance Industries presents a compelling technical case study involving structural price support and momentum alignment:
1. Structural Trendline Support
Looking at the weekly time frame, price action has corrected from its higher levels back down toward a long-term ascending trendline. This trendline has historically acted as a major demand zone, where buyers have repeatedly stepped in over previous quarters. Testing this floor indicates that the asset is sitting
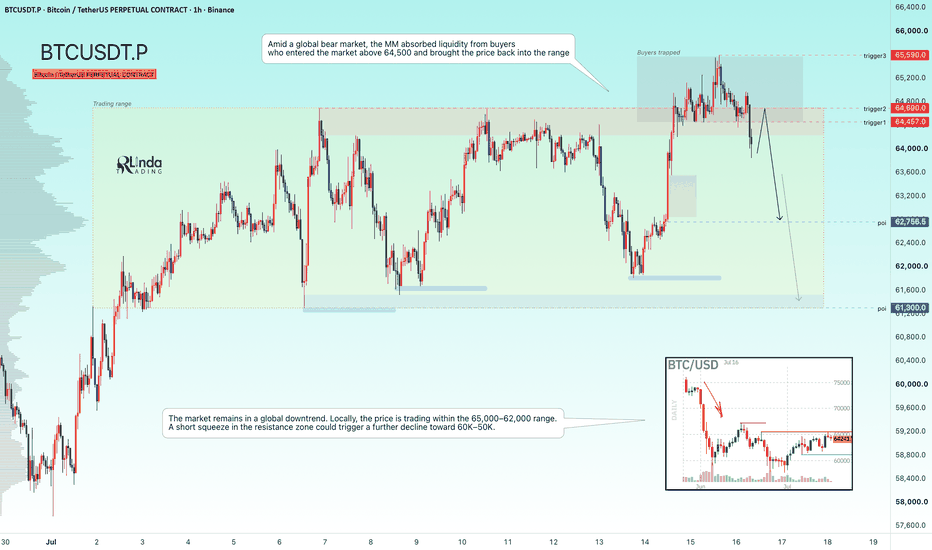
BITCOIN - A false breakout of resistance in a bear market BINANCE:BTCUSDT.P is forming a retest of the key 64,500 resistance level as part of a countertrend correction, trapping late buyers while the market remains in a liquidity sweep phase
The broader trend remains bearish. Unstable ETF flows, the lack of meaningful fundamental support, and ongoing geopolitical uncertainty continue to weigh on the market.
Within the broader bear market, the market maker has swept liquidity above 64,500 before pushing price back into the trading range. Bitcoin
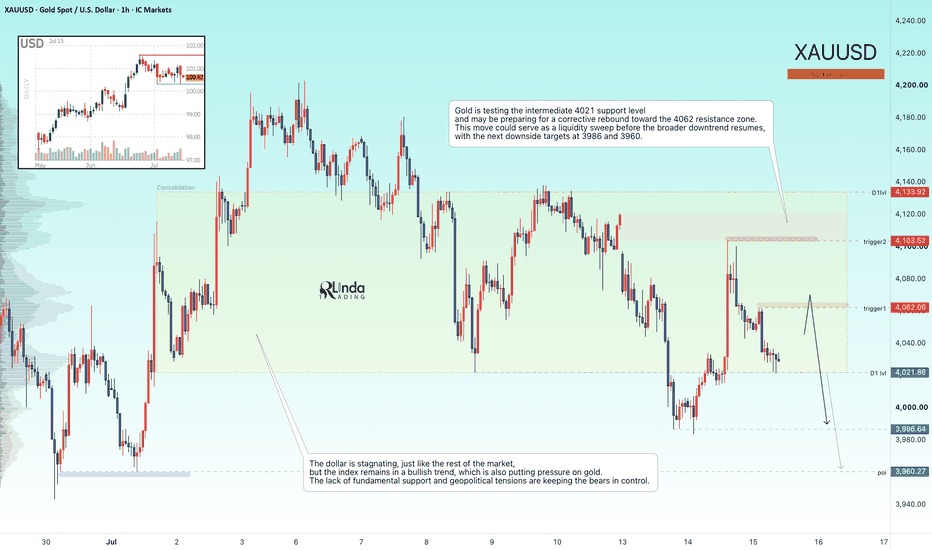
GOLD - Anticipating a short squeeze before the decline continuesICMARKETS:XAUUSD experienced a short squeeze around the key liquidity zone following Tuesday's CPI release. However, the market quickly regained its bearish momentum and resumed selling in line with the prevailing trend
The U.S. dollar remains in consolidation, as does the broader market, but the Dollar Index (DXY) continues to maintain its broader bullish trend, keeping pressure on gold. The lack of fundamental support, combined with ongoing geopolitical tensions, continues to favor the b
Pre-Earnings Triangle in Tesla Tesla has been struggling all year, and now some traders may see risk of a break to the downside.
The first pattern on today’s chart is the tight range since July 2. The EV giant has made lower highs while remaining above roughly $390.50. That could be viewed as a bearish triangle, with potential for a move lower if support breaks.
Second, TSLA tried unsuccessfully to break its late-2024 high in December before making lower weekly highs. That may be consistent with a longer-term top.
Third, t
Selling Patterns in the Nasdaq-100The Nasdaq-100 has moved sideways for six weeks, and now sellers may be getting active.
The first pattern on today’s chart is the pair of converging lines, with lower highs and higher lows. Such a triangle may be consistent with a stalling trend.
Second, NDX opened yesterday above the previous session’s high and probed below the previous session’s low before closing red. That bearish outside day may signal a reversal.
Third, MACD has been falling.
Finally, prices have tried to hold the risin
EURUSD: Breaks Channel Support — 1.1350 Target in FocusHello everyone, here is my breakdown of the current EURUSD setup.
Market Analysis
EURUSD previously traded inside a broad range before breaking below support, confirming a bearish shift. After a brief recovery, price was rejected from the long-term descending trendline and continued lower toward the 1.1350 Support Zone.
Currently, EURUSD is trading below the 1.1440 Resistance Zone after a fake breakout from the ascending channel. The recent breakdown below channel support suggests that selle
Gold Continues to Respect the Descending Channel, Aim 3,940$Hello traders! Here’s my technical outlook based on the current XAUUSD (3H) chart structure. XAUUSD previously traded inside a broad range before breaking above resistance, but the breakout failed near the 4,100 Seller Zone, where sellers regained control. Price then formed a descending channel, confirming a renewed bearish structure. Currently, XAUUSD is trading above the 3,940 Buyer Zone while remaining below the 4,100 Seller Zone. Price continues to respect the channel resistance, suggesting
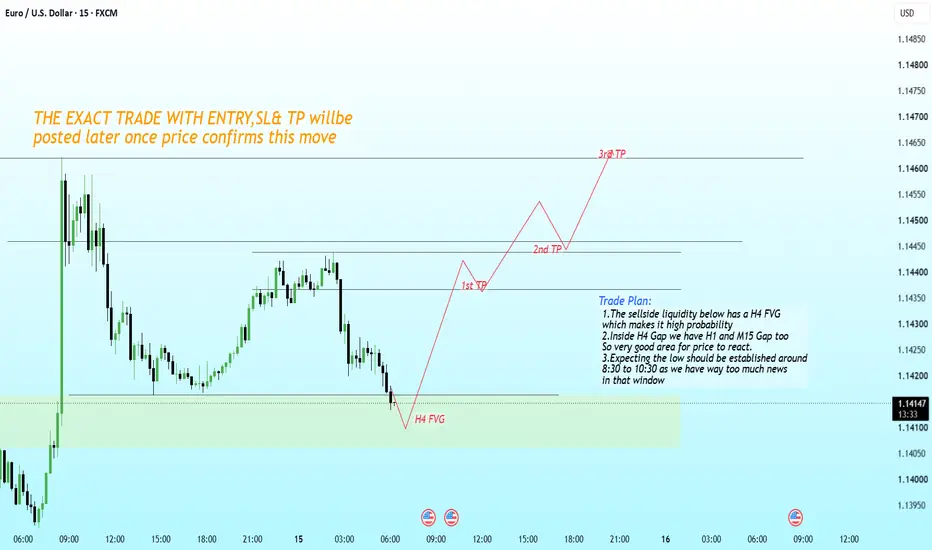
EURUSD Eyes H4 FVG ReversalEURUSD is approaching a high-confluence H4 Fair Value Gap where multiple lower-timeframe imbalances align. If price completes the expected sell-side liquidity sweep during the upcoming news window, this could become a textbook ICT reversal setup.
Patience pays. Let price come to you.
Market Structure
• H4 Fair Value Gap is the primary draw.
• H1 & M15 imbalances sit inside the HTF zone, creating strong confluence.
• Expect liquidity to be engineered before expansion.
• News volatility could p
Nasdaq 100 at a Decision PointThe Nasdaq 100 is trading within a symmetrical triangle, reflecting a period of consolidation after its strong rally. Price is approaching the apex of the pattern, suggesting a breakout could be imminent. A sustained move above 29,700–29,800 would reinforce bullish momentum and potentially open the door for fresh highs, while a breakdown below 29,200 could trigger a short-term corrective phase.
With RSI hovering near 50, momentum remains neutral, indicating the next directional move will
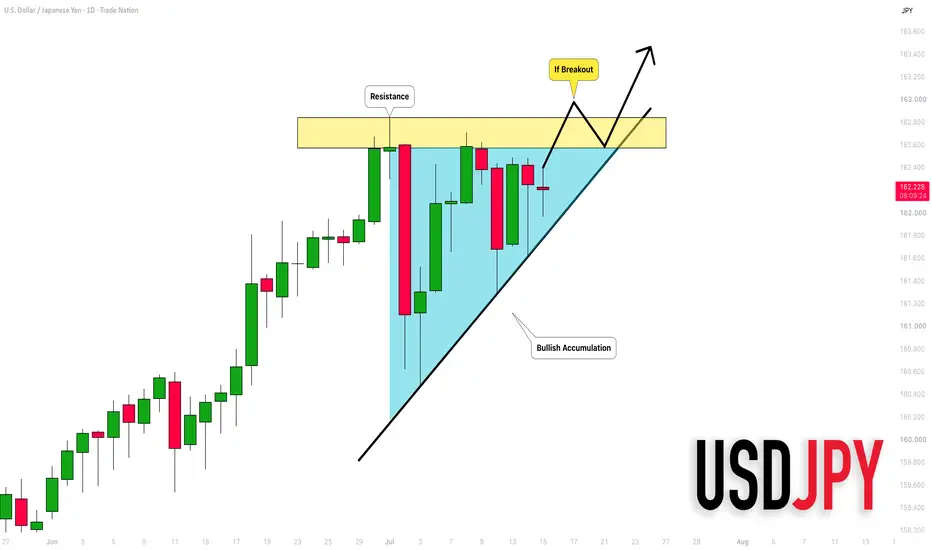
USDJPY: Another Bullish Accumulation 🇺🇸🇯🇵
It looks like USDJPY is preparing for another bullish movement.
I see an ascending triangle pattern on a daily time frame.
Its breakout and a daily candle close above its neckline will provide a strong bullish signal.
The price will continue rising at least to 163.5 level then.
❤️Please, support my work with like, thank you!❤️
I am part of Trade Nation's Influencer program and receive a monthly fee for using their TradingView charts in my analysis.
## KALYAN JEWELLERS – 15-Minute Chart Analysis## KALYAN JEWELLERS – 15-Minute Chart Analysis
1. Kalyan Jewellers is in a **strong short-term uptrend**, supported by a series of higher highs and higher lows after a sharp breakout from the ₹380 zone.
2. Price is currently trading inside a **rising channel**, approaching the upper boundary near **₹550–₹555**, where resistance is likely to emerge.
3. The stock has rallied significantly in a short period, increasing the probability of **profit booking** from higher levels.
4. The upper trend
USDCAD - From consolidation to downward distributionFX:USDCAD is forming a reversal pattern following its recent strong rally. The market appears to be transitioning from a consolidation phase into a distribution phase
The U.S. dollar has entered a period of consolidation, while the Canadian dollar is beginning to strengthen, putting additional pressure on the pair.
After the strong advance, USDCAD moved into a 1.4150–1.4250 trading range. Instead of continuing higher, price is now showing signs of a reversal. Buyer participation may lead t
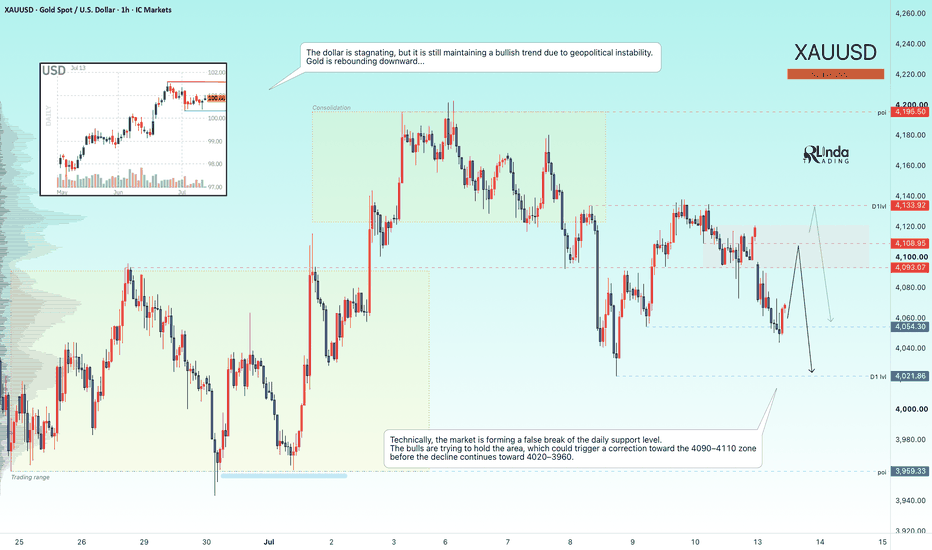
GOLD - A countertrend correction before a decline FX:XAUUSD has reversed lower from the 4120–4133 resistance zone—exactly the scenario we had been anticipating since the end of last week—and is now testing the 4050 support area while forming a false breakout. The fundamental and geopolitical backdrop remains weak, suggesting that the broader decline may continue
Gold fell sharply on Monday, breaking below the $4100 level as renewed tensions in the Middle East boosted the U.S. dollar. Although the dollar is currently consolidating, it rema
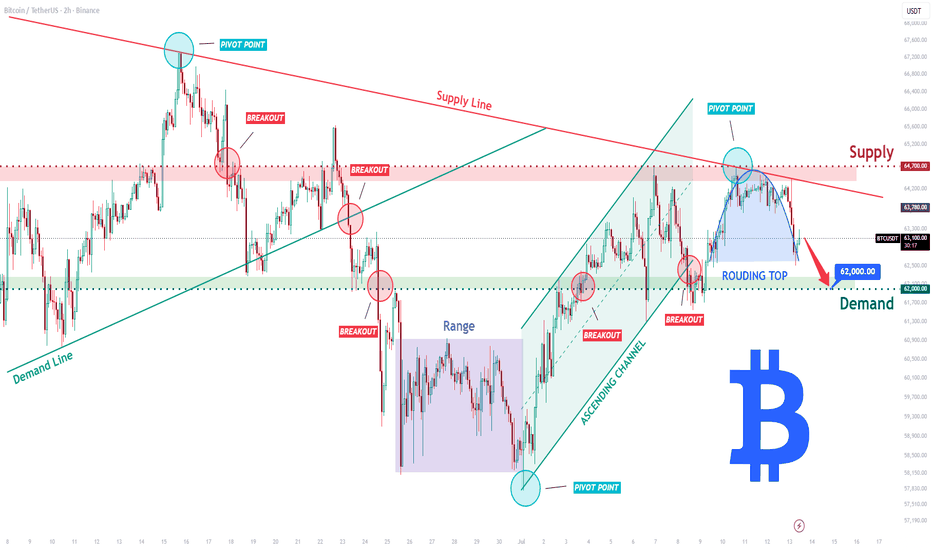
BTCUSDT Short: Bears Target 62,000$ After Supply RejectionHello traders! Here’s my technical outlook based on the current BTCUSDT (2H) chart structure. BTCUSDT previously traded above a rising demand line before breaking below support, confirming a bearish shift. After consolidating inside a range, buyers regained control and pushed price higher through an ascending channel, but the recovery stalled near the 64,700 Supply Zone, where a Rounding Top pattern has formed.
Currently, BTCUSDT is trading above the 62,000 Demand Zone while remaining below the
EOG Approaches Breakout As Energy Sector Gains Momentum One of the most important skills of a successful trader is knowing where to look before the big moves happen.
With tensions in the Middle East escalating and the possibility of a full-blown conflict back on the table, the energy sector is heating up again. Volatility is returning, momentum is building, and there are currently plenty of interesting setups with a great R/R for a swing trade.
EOG is one of the stocks on my watchlist. Using the 4H chart, we can see that the stock has been consolid
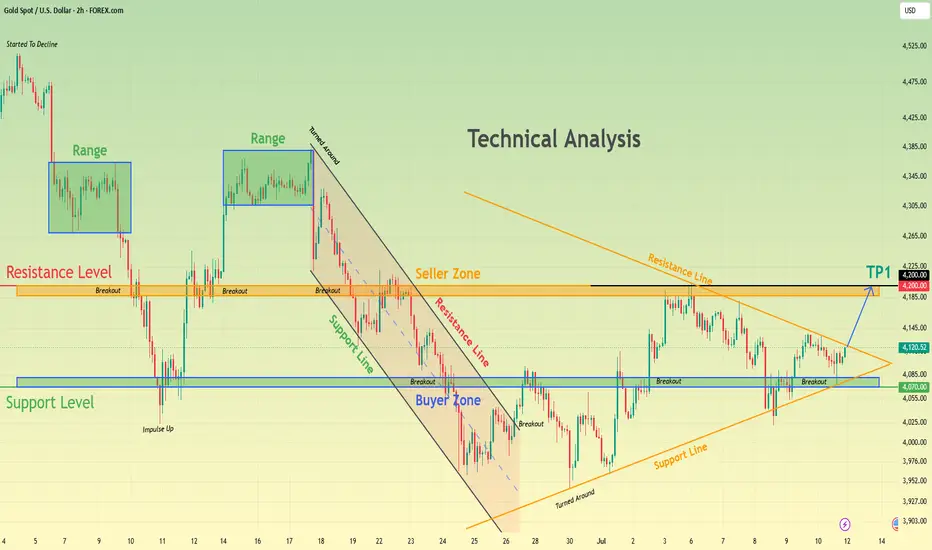
XAUUSD Triangle Breakout Could Open the Door Toward 4,200$Hello traders! Here’s my technical outlook based on the current XAUUSD (2H) chart structure. XAUUSD previously experienced a strong decline before recovering from the 4,070 Buyer Zone. After breaking above this key level, price continued higher but faced rejection near the 4,200 Seller Zone. Currently, XAUUSD is trading above the 4,070 Buyer Zone while consolidating inside a triangle between rising support and descending resistance. The structure suggests buyers are attempting to maintain contro
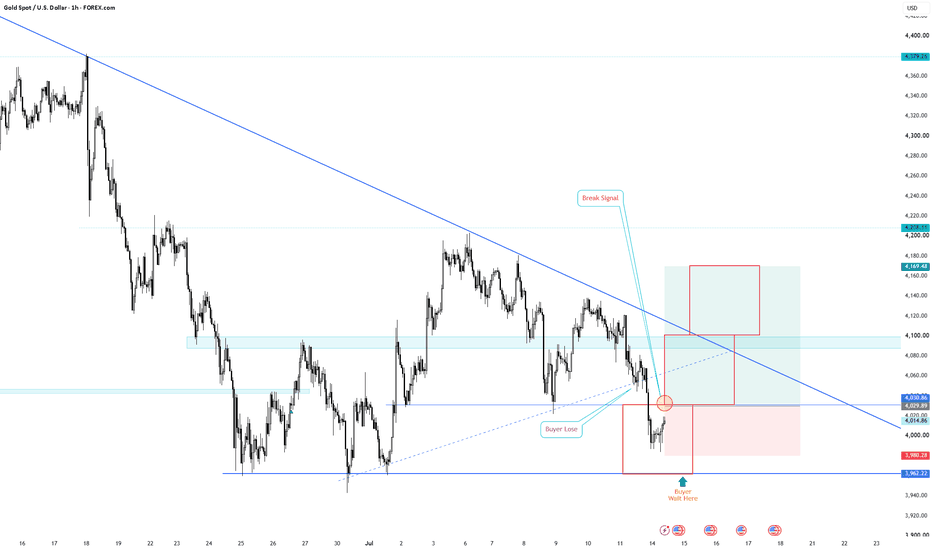
XAUUSD 1H: Reclaiming the Base & Short Squeeze (Long Setup)1. Market Context
On the 1H chart, Gold recently executed a rapid downswing to flush out retail buyers. After sweeping below the local support level, the price found strong institutional buying interest at the major support zone. It is now starting a V-shape recovery back above the key level of 4,029.89. A successful reclaim of this base confirms a bullish shift, opening the way for a rally toward the descending trendline resistance near 4,169.48.
2. Sentiment & Price Trap Analysis
• The Retail
EURUSD Short: Trendline Resistance Signals Move Toward 1.1370Hello traders! Here’s my technical outlook based on the current EURUSD (3H) chart structure. EURUSD previously traded below a long-term descending trendline after breaking down from a consolidation range, confirming strong bearish momentum.
Currently, EURUSD is trading above the 1.1370 Demand Zone while remaining below the 1.1470 Supply Zone. Price is forming a rising structure but continues to face resistance from the long-term descending trendline.
As long as EURUSD remains below the 1.1470
EURUSD Could Retest 1.1380 After Resistance RejectionHello traders! Here’s my technical outlook based on the current EURUSD (4H) chart structure. EURUSD previously traded inside a broad range after breaking below an ascending support line, confirming a bearish shift in market structure. Price later broke beneath the range support and continued lower while respecting the long-term descending trendline, reinforcing seller dominance. Currently, EURUSD is trading above the 1.1380 Buyer Zone while remaining below the 1.1470 Seller Zone. Price is recove
BITCOIN - Retest of the 64,500 liquidity zone BINANCE:BTCUSDT.P remains within the 58,000–67,000 trading range, established as part of the broader bearish trend. Locally, the market is testing the upper boundary of the consolidation zone at 61,000–64,500, with the primary focus now on the resistance area
Bitcoin is currently caught between three major forces: the hawkish FOMC minutes, unstable ETF flows—with outflows resuming after three consecutive days of inflows—and ongoing geopolitical uncertainty. The market still lacks a strong
RIVN 1W: When an electric vehicle becomes a businessNASDAQ:RIVN
Rivian builds electric vehicles and commercial vans in the US: the R1T, R1S, EDV for Amazon, and the mass-market R2, whose first units began reaching customers on June 9, 2026. The company trades on Nasdaq.
Operational turning point
On July 2, Rivian released its Q2 production and delivery numbers. It produced 12,613 vehicles and delivered 12,194, beating its own guidance of 9,000–11,000 units. Full-year delivery guidance was raised from 62,000–67,000 to 65,000–70,000 vehicle